LTCUSD: In love with Litecoin. ;-)Hello my friends!
Did I already tell you that I love Litecoin? Anyway. You can see my resistance lines and support lines in the chart.
--
Let's see what happens.
Happy trading. :-)
--
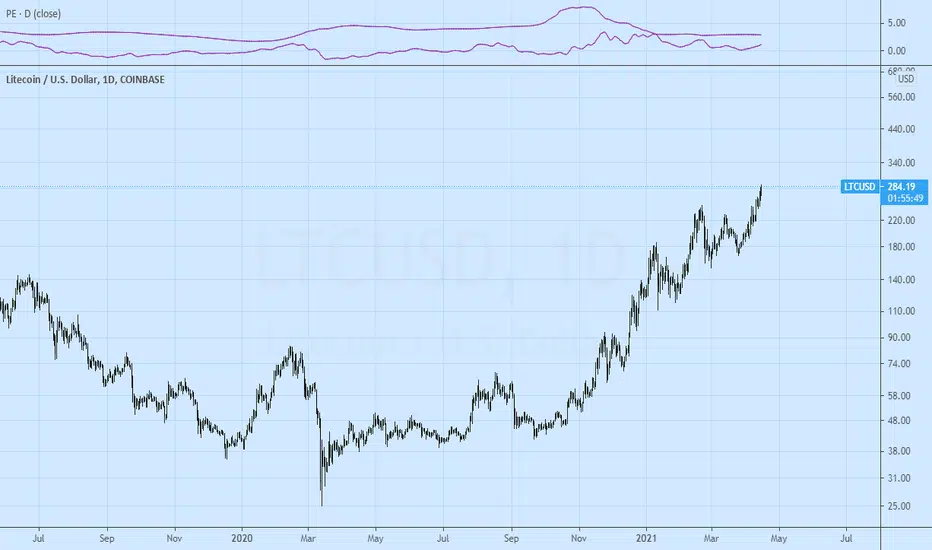
Litecoinusd

Litecoin will go to the moon!!Check the road for new ATH on Litecoin.
Litecoin was sleaping during whole bullmarket. The volume is growing now and litecoin go very fast up.
Now is out of range and you can catch retest on the trendline. Be careful around 320-330usd - there is weekly level.

LTCUSD soon at ATH. Bears at very last chance to shortLast 2:1 chance to short is near ATH. How long will bears last?

BTC will follow LTC PathAs BTC and LTC have both bounce off of the ParaEye possibility. This is an example of how BTC future path will go. Right now LTC is rising and what crypto standards would be a modest pace but for many would be considered excellent. Either way LTC and BTC both have more room to run higher.
Litecoin $LTCUSD Long Term Target PTs 350-600 and higherLTC/USDT
Litecoin (LTC) flipped the breakout level at $246.96 into support on April 11 and 12. This reignited buying from the bulls and the altcoin resumed its uptrend on April 13. The next target objective to watch on the upside is $307.42.
The 20-day EMA ($227) is rising and the RSI is close to the overbought territory, suggesting the bulls are in command.
However, the long-legged Doji candlestick pattern today shows indecision among the bulls and the bears. If the price slips below $255, the LTC/USDT pair could drop to the $239 to $246.96 support zone.
A strong rebound off this zone will suggest the bulls are accumulating on dips while a break below it could drag the price down to the 20-day EMA.

Will Litecoin keep moving towards 325 now?Litecoin closed above first target level. With new support level, will it continue to 325 now?


LTCUSD $312 Next LONG TargetQuick update on the price of Litecoin looking at the 4-hour time frame we can see that LTC just recently regained the $262 weekly level that hasn't been hit since early 2018 after the 2017 ATH around $380.
It is obvious now that Litecoin is in a bullish swing upwards and I believe that this run is going to continue all the way up to $312 and beyond.
Longer Term Targets
TP1 🎯$312
Expect some decent consolidation around the $262 weekly level, fractally, this level is very important and will take a little bit of time before it moves up.

ATH soon and than new ATHsWe'll test the ATH at 370 than maybe we'll have a small correction and if we break the ATH we'll have three targets for long term
715 (90%)
1062 (184%)
1322 (260%)
Please like the idea for Support & Subscribe for More ideas like this and share your ideas and charts in Comments Section..!!
Thanks for Your Love & Support..!!

Litecoin making new 52 week highsRespecting trend lines, it's moving along to its first target of 272. Will it hit it today or tomorrow?

#LTCUSDT #4HHi guys..its the latest analyze chart of #LTCUSDT in #4H time frame(folowers Requested analysis) .if you are interested any crypto that you want analyze with me and any questions please do not hesitate and comment below the chart!
if u like it press like-comment and folow me.thx

LTC Bullish Trend - Possible 295 USDTSince March 31st, Litecoin has had a reoccurring sequence of an ascending broadening wedge (bearish), followed by a downtrend to support level, then succeeded by a sideways channel between support and resistance levels which plays out for 2-4 days. This sequence has appeared 2 times since March 31st and is forming again with current price levels.
Currently, the price is forming the sideways pattern after breaking down from the ascending broadening wedge back down to support. Therefore, for the next couple of days, Litecoin can be expected to fluctuate in a sideways manner between 245USDT (support) and 260USDT (resistance). If it breaks the resistance of 260USDT, another ascending broadening wedge should occur. Based on the magnitude of previous ascending broadening wedges, the mean percentage increase is approximately 17.79 percent. Therefore, the next ascending broadening wedge should increase the price by around 46USDT, forming a new price level of around 306USDT.
However, 300USDT is a massive psychological resistance, and therefore I would take profits at 295USDT to 300USDT.
Right now, the MACD and Stochastic RSI are showing bullish crosses, which indicate the price should increase within the support and resistance levels in the short term. The RSI is at a neutral level of around 50, meaning the coin is neither overbought nor oversold.
Entry points:
If you are an aggressive trader, a good buy point would be between 240-250USDT. This is high risk and high reward as LTC can fail to break resistance and fall past support.
If you are a conservative trader, a power play would be to buy the retest once it breaks the 260USDT resistance. Therefore, a good buy level would be a retest at 260USDT.
*Edit: The resistance level is simply the highest peak in the graph within this month and the support level is the previous peak as created by the previous ascending broadening wedge.

Can litecoin attack to its ATH?After hitting its ATH , litecoin got stuck in a symetrical triangle .
If litecoin could break this zone from the top 1st target would be ATH at 247$
But if this triangle break from the bottom we have a strong support at 170-160$

Nice close for Litecoin this week. Possible path to 272 and 325 Now resistance trend line should hold as good support line for Litecoin to keep moving up.
PS: I like to keep chart simple. No indicators. Only tools I use are trend lines, price levels, price boxes and occasionally fib tools.

Long term LitecoinLooks like a double bottom on the weekly and bullish golden cross on moving averages! waiting for a pullback for entry!

LTC USDLTC has broken the median of the first channel reference on old chart below. It has also broken above purple resistance. Price expected to hit median of larger channel around previous ATH and likely experience a pull back. Long term target is still top of main channel.
**Disclaimer: I am not a professional. This is not financial advice. Trade at your own risk. I am merely sharing my thoughts.**

New 52 week high for Litecoin! March towards 272 continues.As posted few days back, the new highs today. Now, as long it holds 217, next target is 272

LTCUSDT Look Bullish!LTCUSDT (4H Chart) Technical Analysis Update
Waiting for the Resistance Breakout
LTC/USDT currently trading at $245
Buy-level: Above 248 (only buy if 4h candle closes above 248)
Stop loss: Below $216
Target 1: $275
Target 2: $300
Target 3: $325
Target 4: $350
Max Leverage: 3X
ALWAYS KEEP STOP LOSS...
Follow Our Tradingview Account for More Technical Analysis Updates, | Like, Share and Comment Your thoughts.

Litecoin to 320.00?I’ve been obsessed lately with the Fibonacci tool and now it’s telling me Litecoin's next jump will be to $300-$320. Based on 1.618 line. And the fact we are currently testing the resistance area from our prior high makes me feel like we might see it soon..Thoughts?
Thanks for your time!
Please like and follow!


LTC USDT weekly timeframe showing big squeezeLitecoin has been lagging compared to other altcoins such as Ethereum in this bull market, still 50% away from ATH of $420. Weekly chart looking prime for upside momentum with this squeeze forming.

litecoin in Triangle Pattern
litecoin formed a triangular pattern and was climbing, but always with Bitcoin falling to the return line, if we see the return of Bitcoin, we will wait for the return of litecoin.

Litecoin, LTC/USDT - go go goThe coin has been forming a triangle for over 2 months. I like to trade it. I expect for entry point after retest. Keep in mind this coin.
Write in the comments all your questions and instruments analysis of which you want to see.
Friends, push the like button, write a comment, and share with your mates - that would be the best THANK YOU.
P.S. I personally will open entry if the price will show it according to my strategy.
Always make your analysis before a trade
