LTCUSDT (Litecoin) Next Target $365 ??#LTCUSDT Technical Analysis Update
Resistance breakout in weely chart
LTC/USDT currently trading at $160
Buy level: $150 to $160
STOP LOSS: Below 120
Resistance level 1: $184
Resistance level 2: $255
Resistance level 3: $365
Max leverage: 2X
ALWAYS KEEP STOP LOSS...
Follow our Tradingview Account for more Technical Analysis Update, | Like, Share and Comment your thoughts.
Litecoinusd

Complementing Chart to my Prior LTC analysisHere is the LTC/USD chart i'm referencing when making my psychological trend analysis/argument using the LTC/BTC chart published a moment ago.

Litecoin to $250 and why investing Always beats TradingI know a lot of you are thinking this is overbought, over heated, ran up too fast, etc and are trying to apply some sort of technical analysis to it but I want you to know - you are focusing on the wrong thing. Your mind focuses on "warning signs" because our brains are programmed with a survival instinct that always seeks a safe shelter (i.e. cash)....
Here is one bitter truth that is very hard to accept and that every trader learns only after loosing a fuck ton of money: trading will never beat investing because trading focuses on all of the negatives (resistance/support lines, bear/bull flags, etc.) but investing focuses on only 1 positive long-term vision. Until you understand it, you will never win big.
Take a look at every chart I made and compare it to this weekly chart. Notice how on the weekly chart its a straight shot up without any interruptions? Investing ignores all of the noise, trading focuses on the noise. That is the big difference.
On weekly, we see a clear Adam and Eve bottoming pattern. I expect this to rip higher regardless if we correct here or not.
STOP trading and start learning macro behind assets that matter (Real Estate, Gold/Silver, Dollar, Bitcoin, Ethereum, etc.). Nobody gives a fuck about tokens so trade those all you want, but do not trade the big stuff or will sit back, look at the weekly chart and realize that if you didn't dink around past 6 months, you would have been a millionaire by now and the only person responsible for it is you. Focus on the noise and lose or focus on good macro and win big.

Litecoin 🥈 -Silver (if BTC is Gold)🥇⭐Our favorite second, doing very well and looking prosperous from a technical point of view as well.

Litecoin Bearish OutlookLiquidity has been taken to the upside.
Several lows to the downside protected over the years are expected to be wiped before we move into ATHs for Litecoin.
Seeking downside


Moment parfait pour entrée dans LTC- BB plate UT2H
- Combo haussier en préparation ( IVT ) UT4H
- Combo UT2H
- Suivis de tendance
- Accu après pump
STOP LOSS 120
IN
Note : Personnellement cela n'engage bien-sur que moi, je m'attend à un beau bull run de LTC et ETH.

Critical Levels and Targets for Litecoin #LTC/USDWelcome everyone,
My name is Schyler with NewWave Traders. NWT is a movement in Elliott wave and trading education, a movement in creating independent and profitable traders, and a movement in lifestyle. I've been a full time trader since 2017 in the crypto markets and I help traders create a full time income for themselves without working the full time hours by mastering a proven Elliott Wave trading system that will allow you to trade on your time and live the life you deserve. Hit the follow & like button if you'd like to make it a reality. I've helped hundreds of traders just like you make it a reality for themselves. Looking forward to helping you create your success story and life.
Let's Discuss The Outlook for #LTC/USD
LTC has been moving up correctively and its difficult to see a more bullish count than just the potential gains that a corrective climbing asset can provide.
I've been noticing this among the majority of alts, and the way I interpret this is that altcoins move more in 3 waves than they do in impulses, similar to currency pairs such as EUR/USD. The other way to interpret this from an Elliott wave perspective is that we're dealing with a macro flat correction that will lead to an extensive downside leg that will surprise most investors and induce panic selling as critical levels are broke.
As such, in this chart I highlight the previous lows that I feel are important to maintaining an uptrend without drawing attention to the bears, If successful, this could give us a scenario of $160 for #litecoin.
What are your thoughts on LTC in the chart above? Does it have more upside potential? Or Do you think the critical lows will get broken?
Don't forget to follow, like and comment and I'll be doing a $500 giveaway if I can get ranked as a top #ElliottWave analyst on TradingView.
To Your Success,
Schyler

LTCUSDT BINANCEAdam&Eve pattern on monthly time-frame.
In case of break-out of $146 the target will be $220


LITECOIN - Still our favorite to buy right now (after BTC)Our Litecoin Big chart for your friends. We had a private idea for our clients and it has been going really well. Time to share our chart with you

Litecoin retracement incoming $100Litecoin is ready for a retracement to $100 & the 61.8 fib before we get our next leg up to $170

#LTCUSD - #Litecoin is alsoin a BullrunGood Evening,
there could still come an other doubling in my opinion.
Indicators getting hotter but does not mean that the bulls already give up.
I have already taken the first profits to reinvest in some other opportunities.
Greetings
Stefan Bode

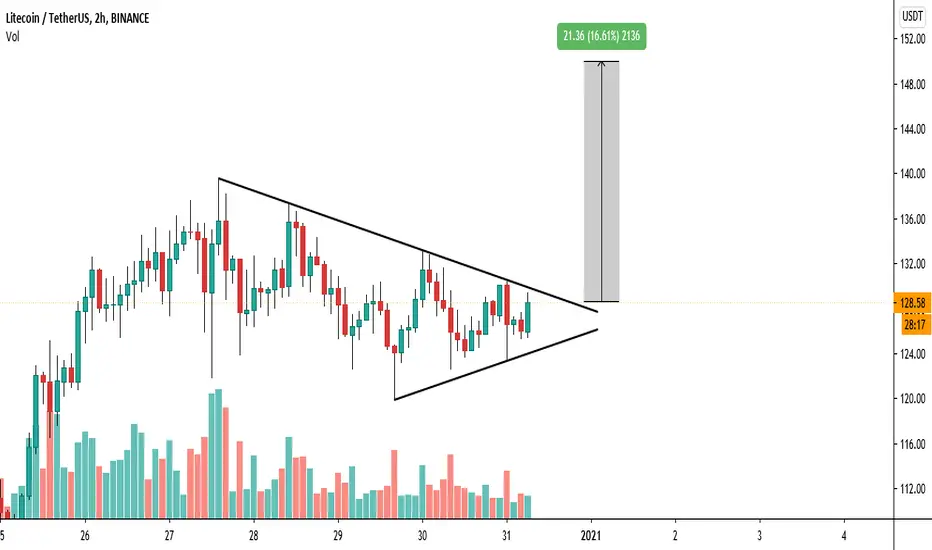
LTC (Litecoin) possible Breakout LTC / USDT
Possible Breakout from bullish pattern
If this pattern successed it will moon
I want to remind you that we already had signal about LTC in my channel and bought it early around 105$
Also you can check my last idea about LTC I told you to buy the pullback 👇👇:
Good luck 🤞

Litecoin the Litecoin is a price triangle component. If the triangle breaks above it, it will rise strongly, and if the triangle is broken down, I think it will return to the $ 50 and $ 40 areas when it breaks above. It will be a good opportunity to enter after breaking the upper trend resistance of the triangle …
Stay alert ..
what is your opinion ?

LTC 1D What is more likely: growth by +40% or fall by two times?Analyzing the previous idea , we can say that the price of LTCUSDT was unable to fix below $71.
Against the background of the BTC growth, buyers began to actively buy out LTC. By the way, few altcoins showed such growth on the last impulse of Bitcoin.
So, having fixed above $91 , buyers took control of the situation on the chart and easily reached the top target of $124.
Now we are thinking that it is time to correct for the rapid growth of the LTCUSD price. The intermediate target is $71 and the global one is $63.
Although, trading risks should be based on the level of $119 . Since above it, buyers will again, without resistance, begin to push the price towards the previous high in the range of $145
_______________________________
Since 2016 , we have been analyzing and trading the cryptocurrency market.
We transform our knowledge, trading moods and experience into ideas. Each "like under the idea" boosts the level of our happiness by 0.05%. If we help you to be calmer and richer - help us to be happier :)

LTCUSDT (Resistance line Breakout)LTCUSDT Technical Analysis Update
Resistance line Breakout
LTC/USDT currently trading at $111
LONG ENTRY level: $108 - 112
STOP LOSS: Below $103
Resistance level 1( Target 1): $117
Resistance level 2 (Target 2): $124
Max Leverage: 4X
ALWAYS KEEP STOP LOSS...
Follow our Tradingview Account for more Technical Analysis Update, | Like, Share and Comment your thoughts.

LTC/USD STRONG BUY - Long Litecoin seems to be waiting for the next bull run after a small correction. Unlike Bitcoin and Ethereum, indicators are not in bearish divergence, and we can reach the next resistance around $145. But be aware because of the Christmas holidays and the end of the year.


Litecoin (LTC) - Possible H&S Top? I closed my position at $117. I am not buying this bounce. We could be building a H&S top here. Please do proper risk management especially after so much positive news for crypto lately and year end. Sentiment can change any minute. Happy Holidays!

LTC LONGThe Content is for informational and entertainment purposes only, you should not construe any such information or other material as legal, tax, investment, financial, or other advice. This is not financial advice nor am I a financial adviser. :)
