LTC TA ExampleExample of TA for the LTCUSD pair on Coinbase for my last few trades. It includes a comparison between active trading and buy+hold strategies as well as the trading range I used over this period.
I'm constantly tweaking indicators to try and find those that align with historical (and current) market movements, of course the Blockchain space comes with a lot of expected volatility .
To reduce risk without also reducing potential upside is always a challenge, although the current bull run easily makes the novice seem the expert. I make frequent use of stop-losses to lock-in profit once new support is established, which has worked well for me for the most part. Or course, sometimes a stop-loss triggers without dipping much farther and then rebounds quickly sometimes, and can have a negative performance impact . For that reason I think it's important to focus on long-term strategy and set your acceptable loss-levels accordingly. I am very bullish long-term on $BTC in particular and blockchain as an asset class, so my acceptable risk is probably higher than it otherwise would be.
Note: I am not an expert trader and am constantly learning. If anyone has advice for me r.e. TA for crypto assets please share with me!
Litecoinusd

LTC/USD short term target 106$Hello, a little TA where short term target for LTC is 106$, if TA is valid it should reach it at the latest early January 2021.

Litecoin following Bitcoin Bull Circus next buy chance $102.81I'll keep it short. Unless Litecoin takes no break and just continues to climb,
Possible buy opportunities for Litecoin are at around $102.81 and $98.62.
Make sure to set your stop loss orders not to lose any money or sit there being forced to HODL.

Litecoin price at Resistanceprice made breakout of bullish pennant and now at the resistance close above 45000 sats will send price higher
also good breakout on weekly coming soon


LITECOIN - Intraday Update - 12/11/20 (Short-term) LITECOIN - Intraday Update - 12/11/20 (Short-term)
Outlook : Expecting LITECOIN to recapture its $93.159 high and beyond. Breaking above $86.970 ; is the next upside objective for the bulls. (Fist a Bullish Evidence)
Analysis : The break above $93.159 signals the second wave consolidation is complete, and the move puts LITECOIN back on track to challenge the next upside hurdle. The bulls are in control while $64.602 - - stays intact as support.
Bottom Line : A third wave rally is in its early stages. Subdividing higher within wave iii of (iii)
Note: Prices can vary between LITECOIN exchanges. Consequently, there may be differences in our chart prices due to different data sets. Our analysis is for information only. We recommend that people avoid trading on unproven exchanges vulnerable to hacking and theft.

Litecoin / Dollar 🔥 on 1 h chart🚀 13.12.2020Hello, dear traders! Just quick overview on Litecoin 🧐
It looks like we left the falling wedge today. That's a good sign for growth. If you would like to entry now, split your buy order into several parts. 80 - 81 - 82! It would be great to catch a best price. Happy trading! 💃🏻
Thank you for attention!😊
Stay in touch with me💋
Always sincere with You🧡
Your Rocket Bomb🚀💣

LTCUSD another short-term pullback before the next rally to $200Hi friends, hope you are well and welcome to the new update on Litecoin.
The price action has bounced from the trend-line support:
In previous article we have seen that the litecoin was moving down to the support of an up-trend line and this trend line is formed since 20 Oct 2020. And we were expecting a bounce from this trendline after this pullback. Now finally the price action has taken another bullish divergence after reaching at this support.
Another successful harmonic move:
In the meanwhile, I also shared another chart with you on 9 Dec, where I told you that the price acton of LTC is completing BAT pattern on small time period 4-hour chart. Now the priceline also has taken bullish divergence from the potential reversal zone of this pattern.
Good supports of moving averages:
Currently on daily chart, the pricelne of Litecoin has strong supports of 50, 100 and 200 simple moving averages. After current pullback, the price action has also used 50 simple moving average support to move up. At the moment the price action has bounced successfully from the 50 SMA and breaking out the 25 simple moving avearege.
A symmetrical triangle and an expected short-term pullback:
On daily chart, the price action has formed another symmetrical triangle. At the moment the price action is at the end of this pattern and likely to move down to re-test the support of this triangle after getting rejected by the resistance. There is also good support of 50 simple moving average below this pattern. Therefore, we can expect a breakout after a pullback to $75.
Long-term support and resistance levels:
On the long-term weekly chart, different support and resistance levels can be seen. At the moment the price action has the support at $60 and recently rejected by $90. After $90 the $100 can be also another psychological resistance. Then the next resistance levels can be found at $110, $140, $170, and then $230. However, the $200 can be another big psychological resistance level.
Conclusion:
Litecoin has very good supports of simple moving averages and the support of the triangle as well. There can be another short-term rally to the downside upto $75 to re-test the support. In long-term, there are no significant resistance levels after $90 and $100. Therefore once the priceline will manage to cross the $100 level, then in a very short time it can reach to breakout $200 resistance as well.

LTC (Litecoin) possible moveLTC / USDT
I expect price will test
trendline support area (+ EMA 50)
betore next leg up
this pattern to be successed 👉 Support area should hold and price shouldn't close below
Good luck

Litecoin price Action (LTC) Possible Outcome Going ForwardWe all make dumb mistakes when we make biased decisions. For me, trading is about removing my personal biases (or what I think the market should do) from my trades. I change my mind about my trades fast and can change to being a bear very easily if price action shows me a different outcome. Removing these biases is what saves me from holding the bag when price action doesn't support my views. Proper stop losses are always in place to make sure that my bias doesn't get in the way. I do not want to trade based on what I think market should or will do. I want to trade based on what price action is telling me.
Current set up is telling me that we need to get to the upper boundary resistance line, breakout of it, re-test it and go from there. I am targeting $120 but I may and will change my mind if price action is telling me otherwise.
Always be loyal to your capital and not your views. Remember one thing when you trade "Your views will not be hurt if you are "wrong". Your capital will be hurt if you are "wrong". Your capital needs you to preserve it and grow it, you can change your views at your ego expense. You can change your capital at your "views" expense. Proper risk management, proper stop losses, elimination of bias - the only thing that will make you successful.
Although this looks bullish AF - keep in mind we are still below the major breakout resistance, chart can morph into another structure so make sure you are not going to let your views hurt your capital. Dont let one day off gains make your next year's decisions.
Happy Sunday and good luck to you traders!
#litecoin #ltc

Come on already break out of the wedge LTC LTC KRAKEN:LTCUSD is very close to breaking out of the falling wedge!
Moon baby!

Litecoin (LTC) to $120December is known for crypto dumps. They say - "Buy dips in bull markets". If it is indeed a bull market, then $120 is coming and you should load up on LTC or whatever makes your bells jingle.
If Tradingview crowd is not buying this dip - I am considering to subscribe to TOP 1000 OnlyFans girls and offer them $100 each to post a pic with "I like boys with Crypto" message in description to pump this clusterf*ck of sh!t coins up. If my pump plan doesn't work, at least I will see boobies. Honestly though, if ya'll dont pile in - I am going for the pretty girls cause pumping on here is quite depressing.

LITECOIN - Intraday Update - 12/09/20 (Short-term) LITECOIN - Intraday Update - 12/09/20 (Short-term)
Outlook : Expecting LITECOIN to recapture its $93.00 high and beyond. Breaking above $86.89 is the next upside objective for the bulls. (Fist a Bullish Evidence)
Analysis : The break above $93.00 signals the second wave consolidation is complete, and the move puts LITECOIN back on track to challenge the next upside hurdle. The bulls are in control while $64.30 - Wave ii - stays intact as support.
Bottom Line : A third wave rally is in its early stages. Subdividing higher within wave iii of (iii)
Note : Prices can vary between LITECOIN exchanges. Consequently, there may be differences in our chart prices due to different data sets. Our analysis is for information only. We recommend that people avoid trading on unproven exchanges vulnerable to hacking and theft.

LTC 12h Sold out, it's time to move downLess than a month has passed since the previous LTC idea was published. There we indicated the profitable longs sale zone.
Since the idea has worked out well , it's time to correct it on a shorter time frame.
Therefore, we continue the series of LTC ideas, and all the previous ones can be viewed below in related ideas.
The first LTCUSDT high last month was on 24 November at $94.
The next attempt by buyers to renew the high was unsuccessful. The price stopped at $93 on 1 December. But the volumes were much higher. This suggests that sellers have taken control of the situation.
In accordance with the above data, we rebuild the trend line and take it as a basis.
Buyers will regain control of the situation if they can break and fix the price above $91.
Everything below is in sellers' control zone. And below $71 , the fall may accelerate, with the first target of $51.50-57.
_____________________
Since 2016 , we have been analyzing and trading the cryptocurrency market.
We transform our knowledge, trading moods and experience into ideas. Each "like under the idea" boosts the level of our happiness by 0.05%. If we help you to be calmer and richer - help us to be happier :)

LTCUSD completing final leg of BAT | Upto 29.5% expectedOn 4-hour chart, the price action of Litecoin is completing the final leg of bullish BAT pattern, soon it will be entered in the potential reversal zone.
Buying And Sell Targets:
The buying and sell targets according to harmonic BAR pattern should be:
Potential reversal or buying zone: $ 70.44 to $ 67.57
Fibonacci projection or sell zone: $ 77.28 to $ 87.57
Stop Loss:
The potential reversal zone area that is up to $67.57 can be used as stop loss in case of complete candlestick closes below this level.
Possible profit and loss ratio:
As per above targets this trade has a profit possibility of 29.5% and as per the above-mentioned stop loss, the loss possibility is 4.1%.
Note: Above idea is for educational purpose only.

Litecoin |A pull back before the next rallyPreviously we have seen that the price action of Litecoin was expected to have breakout from the resistance of triangle. Now the price action has broken out the resistance and spiked beyond $94.
On daily chart, the price action of LTC has found a strong resistance at $91 and formed double top at this level. The priceline has also good supports of exponential moving averages 10 and 21 as well.
On daily chart, the price acton of LTC has also found a good up trend line support. Now the price action is moving down towards this support again. But in order to re-test the support breaking down of 25 SMS is must. The Other SMAs with the time period of 50, 100 and 200 are also moving up to provide the support to price action.
On 4-hour chart, the price action of LTC is also forming a bullish Shark harmonic pattern. The potential reversal zone of this pattern starts form $78.73 and ends at $77.18. If the priceline will not take bullish divergence from this PRZ level then it may re-test the support of up-trend line on daily chart and from there it will start the next bullish rally.
Conclusion:
We have a very good supports of 25 SMA on daily chart and potential reversal zone of bullish Shark at same level. If these levels will be broken down then the priceline may move more down to re-rest the support of the trend line.

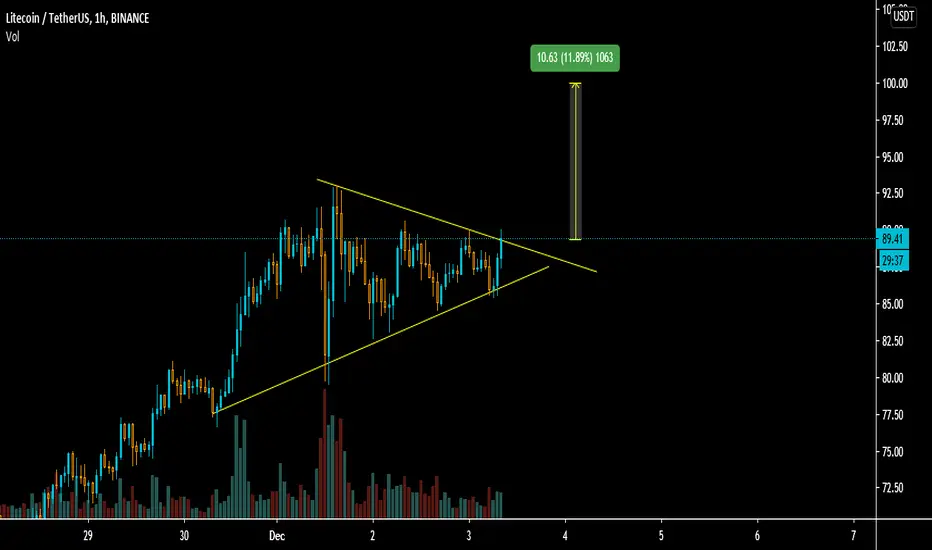
LITECOIN - Intraday Update - 12/03/20 (Short-term) LITECOIN - Intraday Update - 12/03/20 (Short-term)
Bottom Line: Subdividing higher within wave iii of (iii)

LITECOIN - Intraday Update - 12/03/20 (Short-term)LITECOIN - Intraday Update - 12/03/20 (Short-term)
Bottom Line: Subdividing higher within wave iii of (iii)
The bearish alt: count.
Bottom Line: The alternate count, is the Bitcoin may correct in a wave ((2)) minor. A more bearish possibility is that wave (C) is developing as a zigzag and will make a new low under 79.84, before the rally in wave ((3)) begins.

Litecoin LTCUSDT Price in symmetrical triangle price in symmetrical triangle and ready to move adding small long below 89.6
Stop below : 83
Target : 92 , 96 , 100

is Litecoin (LTC) doing a Bump and Run Reversal? or a Bear flag?It seems that Litecoin ( LTC ) is currently on the Run phase of a bump and Run Reversal, and at the same time, it seems that it is also making a bear flag.
If this is true, it might send bitcoin towards $40-$47 area (see red box)
What you guys think?
Leave a comment and a like!
Only for entertainment purposes!

LiteCoin Double Bottom Breakout price break the neckline of double bottom which is previous high with great volume
consolidation at neckline is good place to enter the market when we bounce

LTC LITECOIN 4H Chart - Target 100 /125 / 160 LTCUSDT LTCBTCLTC LITECOIN 4H Chart - Target 100 /125 / 160 LTCUSDT LTCBTC
