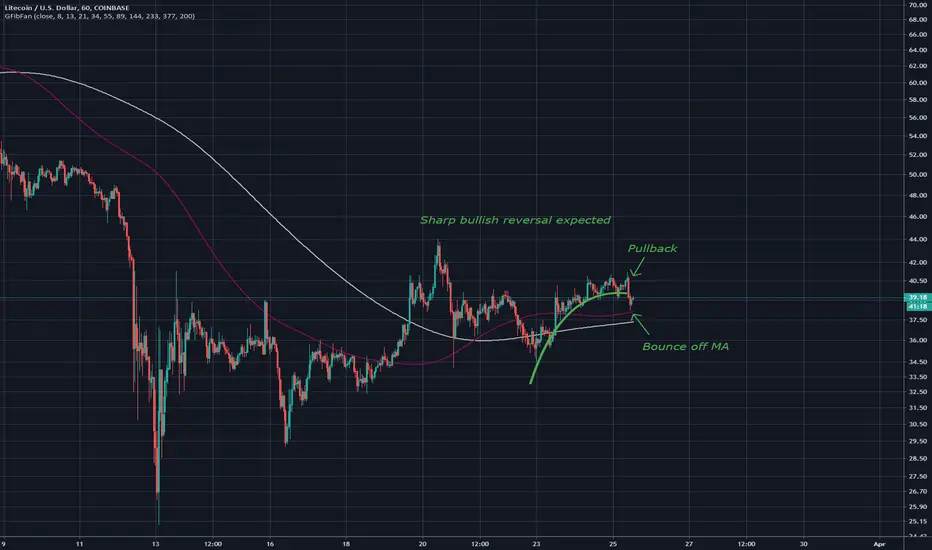
Litecoin intraday ascending scallopAscending scallop, after a small pullback in this pattern formation a strong bullish movement upwards should be seen. Hourly chart. Happy trading!
Litecoinusd
LTC does not care about CORONA VIRUS Marty boots here trading the LTC pump
Crypto does not care about corona or the stock market
Crypto is leading the stock market and gold and silver in teh commodities section

LTCBTC fractalPossible pathing of the next bull run for litecoin, immediate resistance is purple line. Alligator can be seen to be eating bullishly, a bullish rejection will probably occur when the green line touches the red line. Price seems to be mirroring early stages of 2017 bull run. Lets run litecoin.

LTC ANALYSIS: BUY AT LOW 30's!LTC ANALYSIS:
LTC saw an extremely bullish engulfing on the bottom at $25. This was a huge buying opportunity. I doubt we will have a second chance at that price. With that said, LTC is now overextending itself on the buy pressure. I expect a small retrace to fall into the right shoulder gap near the buy zone of $31-34. Recommend to stagger bids inside this zone for a long. The outlook is for LTC to hit the daily resistance block pushing up past T1 of 42.40, and T2 at 45.30. Buy volume doesn’t seem to be matching the sell volume and a drop back towards a neutral zone near 30 is likely to be incoming. Great buy opportunity incoming!
Possible Entries: $31-34

LTCUSD forming bullish Crab | For a big bullish moveHi Folks hope you are well, here I have found another profit potential trading idea and this time on 2 day chart the Lite coin (LTC) is forming bullish Crab pattern, we need some more drop and then soon it will be entered in potential reversal zone to move up.
Let’s dig this pattern deeper to examine how perfect this pattern is formed:
After initial leg (X to A) the A to B leg is retraced between 0.328 to 0.618 Fibonacci and then B to C leg is projected between 0.382 to 0.886 of A to B Fibonacci projection area and last leg (C to D) should be retraced between 1.27 to 161.8 Fibonacci then the priceline will be ready to take bullish or upwards move.
Buying And Sell Targets:
The buying and sell targets according to harmonic Crab pattern should be:
Buy between: $22.75 to $5.83
Sell between: $35.88 to $67.63
So this trade has up to 162% big profit possibility.
Stop Loss:
The potential reversal zone area can be used as stop loss in case of complete candle stick closes below this level.
Note: This idea is education purpose only and not intended to be investment advise, please seek a duly licensed professional and do you own research before any investment.

LTC DivergenceClassic bullish divergence example, only viable if wick is bottom. Supported by a strong golden cross, as said on chart. Litecoin will see some great upsides in the near future. Consistent with my previous angle of symmetrical triangles forming on LTCs chart. I will link this. This is a weekly chart.

LITECOIN / U.S. DOLLAR (LTCUSD) DailyDates in the future with the highest probability for price direction reversals

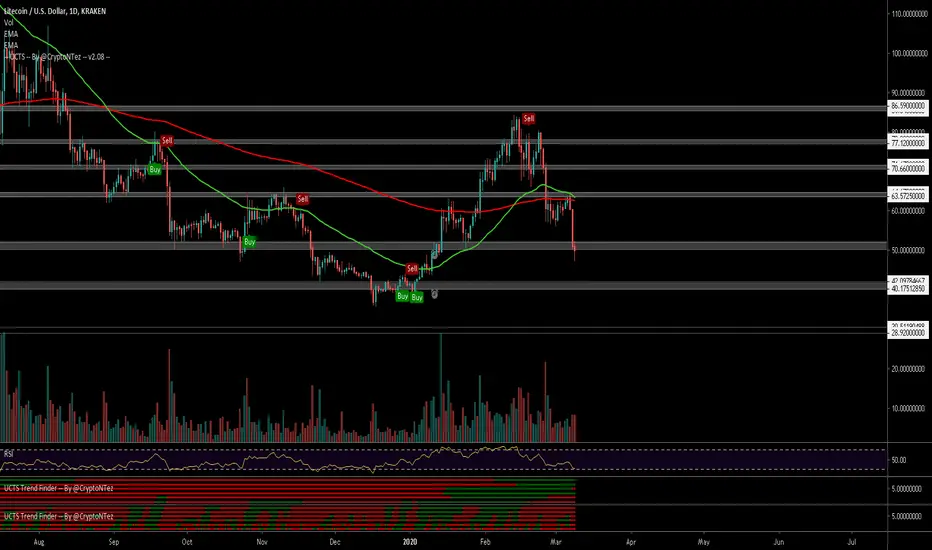
$LTC, Falling below 50$ support level$LTC / #USD
Falling below 50$ support level (over 30% down since latest UCTS Sell signal on the 1D)
If it gets rejected from the current retest (flips S/R), then continuation to the downside should lead to a new leg down w/ target at 40$ support
#LTC
LTCUSD forming bullish Shark | Upto 12% move aheadHi fox hope you are well, here I have found another profit potential trading idea for you and this time on 6 hour chart the Litecoin (LTC) is forming bullish Shark pattern and soon it will be entered in potential reversal zone to move up.
The Pattern:
After initial leg (X to A) the A to B leg is retraced between 0.382 to 0.618 Fibonacci and then B to C leg is projected between 1.13 to 1.618 of A to B Fibonacci projection area and last leg (C to D) should be retraced between 0.886 to 1.13 Fibonacci then the priceline will be ready to take bullish or upwards move.
Buying And Sell Targets:
The buying and sell targets according to harmonic Shark pattern should be:
Buy between: $56.78 to $55.22
Sell between: $58.56 to $62.15
Stop Loss:
The potential reversal zone area which is up to to $55.22 can be used as stop loss in case of complete candle stick closes below this level.

Litecoin another angleGolden cross that has appeared on the weekly chart may produce large gains and result in a parabolic rally, two symmetrical triangles can be observed, both bullish. Will a third form? Maybe.. Included a fractal and possible pathing for a parabolic rally. Litecoiinnnnn.

LITECOIN cYpHeRLong term bearish cypher, easy profits to be made in the short term with a golden cross present on the weekly chart. This golden cross has proven to be successful on BTCUSD so why wouldn't it be on LTC? Best to go long. Included a fractal for the cypher not sure how accurate it will be lets just see how it plays out :P. I still believe ERC-20 Tokens and Ethereum will outperform BTC and LTC in throughout MARCH. Very nice range for trading. Potential for a lot of movement upwards.

Litecoin found a good support, immediate long?Hello there, this is our view on LTCUSD, enjoy!
Analysis:
-On chart:
2 main trendlines, one from the ath which touches the ytd and the local highs, price is not likely to break these lines until btc will make another strong movement. More lines form a small bear flag (continuation pattern), which it seems we're able to break up if enough volume is provided. I also drew a pitchfork that seems to work, so we're probably getting one more time up there (even if middle line will probably resist any legs up). Current situation isn't very bullish because we have a confirmed death cross on standard moving averages 50-200; smaller lenghts have formed new golden crosses though. Exponential moving averages are even more bearish because they didn't only form a death cross on big lenghts, but also many golden crosses on smaller ones were negated in a few candles: this is extremely bearish, but most of them are literally on the price, so they aren't resisting neither supporting very much. Of course a retest of weighted moving average 200 is needed, so this is my hope for a mini rally. Mid bollinger band is still supporting the price; also width is very small, prove that a consistent move could happen very soon. An interesting thing is that ichimoku cloud is extremely large, so it may seem bearish, but in term of bulls it's OK like that, because we could enter it and take a little rest before dumping badly; a bullish move is expected anyway if we entered the cloud.
-Technicals:
Fisher transform as many oscillators it's taking its retest of a bull divergence with price. In fact chaikin, money flow, rsi, stoch (14,3,3) and ultimate are growing from oversold. Stochastic is still bearish on higher smoothies. Macd and awesome also formed a bull divergence with price, even if macd states bearish momentum; awesome is still neutral after the recover. Small F accumulation after the dump, it does make sense like this even if I was expecting a little more; nevermind, it is bullish too.
Strategy:
We're very active on this market nowadays, that's why we are putting 2 different strategies on this trade. This is a good opportunity we believe if you heard, so you might try them all as well.
1. {SCALP}Entry (short): 60.96 - 61.50 - 62.49
Target (short-term): 59.79 - 58.10 - 55.15
Stoploss: 62.70
Risk/reward: 2.74
2.Entry (long): 59.29 - 58.10 - 55.15
Target (short-term): 62.49 - 68.21 - 75.44
Stoploss: 51.60
Risk/reward: 2.19
Disclaimer: this is not a trading advice as it could seem like, we're just enjoying ourselves and spending our time onto this activity. Don't ever trade money you can't afford to lose. Don't do such a trade if you're not self-conscious about what you're doing. If cryptocurrencies are not regulated in your country use them only for speculative interests until they'll be. Feel free to ask us every question you have.
Trade safe, Anlvis.

would be hell of a reversed head and shoulders patterncould go down some more (my hope max. 7.9k) but when bulls stop sleeping and step in heavily I see a lot of upside ..

LTCUSD formed bullish BAT | Upto 42% MoveHi friends hope you are well, here I have found another profit potential trading idea for you and this time I have found a harmonic move by Litecoin. The Priceline of LTC has formed bullish BAT pattern and entered in potential reversal zone and ready for bullish reversal soon.
Let’s have a look on the LTC move:
After initial leg (X to A) the A to B leg is retraced between 0.382 to 0.50 Fibonacci and then B to C leg is projected between 0.382 to 0.886 of A to B Fibonacci projection area and last leg (C to D) is retraced between 0.786 to 0.886 Fibonacci and now the price action is moving in potential reversal zone of this bullish BAT and now we can expect bullish divergence at any time which will lead the priceline between 0.382 to 0.786 Fibonacci projection of A to D leg , but if after this bullish divergence the candles sticks will be closed above the 0.786 Fibonacci projection area of A to D leg then it can also lead to the long term bullish move. We also have a 100 simple moving average in PRZ level that can be a strong support to push the price action up to 42%.
Buying And Sell Targets:
The buying and sell targets according to harmonic BAT pattern should be:
Buy between: $57.85 to $54.63
Sell between: $65.99 to $78.08
Stop Loss:
The potential reversal zone area which is up to $54.63 can be used as stop loss in case of complete candle stick closes below this level.


LTC/USD ANALYSIS (THE FALL CONTINUES)LTC/USD is very likely to continue dropping as we are seeing a bearish correction in place. LTC has crashed under 50MA, and 200MA is next. Short sell targets I expect to see $61, and $59 incoming in the coming weekend/week. I do expect a turn around once LTC does enter the yellow entry box. This is positioned for a long opportunity at 58-60$. RSI daily is rapidly decreasing and stoch flipped bearish again after attempting to cover a neutral ground. This does not look good short term. Long term, There will be a re-attempt of the local high. It will take some time to play out though, giving the take profit long term targets of $69.40, T2 of $75.60, and T3 of $81.40. Again, patience here is key!! Right now LTC is in free-fall and in no position to rush into a long. The short option is down to $59! Following this, look for entries staggered near 59.
Possible Long Entries: $59


LTC/BTCHi friends, I want to show a very strong bullish signal in Daily chart for Litecoin. I think you are familiar with such a definition as the Golden Cross.
Golden Cross - If a 50-day moving average crosses a 200-day moving average, this is a sign of an emerging bullish trend.
Many traders often use the intersection of moving averages (MA) in their practice as a signal to enter a trade. Such an intersection is called the Golden Cross.
However, moving averages have one very bad property - they are late for the price. It happens that the movement is already ending, and moving averages only intersect.
In General, the market looks very good and I expect the movement to continue, especially for those coins that are in the top 30 by capitalization, why these coins, everything is simple for a big player it is possible to invest a relatively large capital in coins with a live market, with a large capitalization, good trading volume, where there are many players. And if you have seen my previous analyse, I said that Litecoin will fly.
I see more potential for growth, especially since the Golden cross is coming soon.

Is wave 4 over yet?First time publishing!
Looking on the daily chart here, I believe we have a pretty clear 1,2,3,4,5 wave setup going on.
My thoughts are we could see one more down move for Litecoin to the .618 fib level ~$65.65 then a wave 5 up. My targets are $100-$105 for wave 5's top.
Observations:
Daily RSI still has room to drop
Daily MACD crossed over and the histogram is building to the red
Wave 4 appears to be in "B" wave of ABC correction at the moment
Welcoming any feedback on these thoughts.
Not trading or financial advice.

Litecoin Descending Scallop!Litecoin has formed a descending scallop on the daily chart, this is quite early in the formation but it looks to be forming it. Currently sitting in a weak regression uptrend, using this as a reference, it will most likely be broken. As said on chart any area here is good for a long entry. Still very cheap in retrospect.

Litecoin on a hard retracementAfter doubling (from my point of entry) in price over the last 6 weeks, I closed off the open trade at a doubling, and as expected, the retracement came. Today it is down 10%, albeit faster than expected. Nonetheless, would be looking for re-entry later.

Litecoin LRStrong linear regression uptrend, 0.90. If a third bounce occurs this will put it in a great place for further price increase as a result of the golden cross on the weekly chart that has formed. 4H chart.
