Litecoinusd

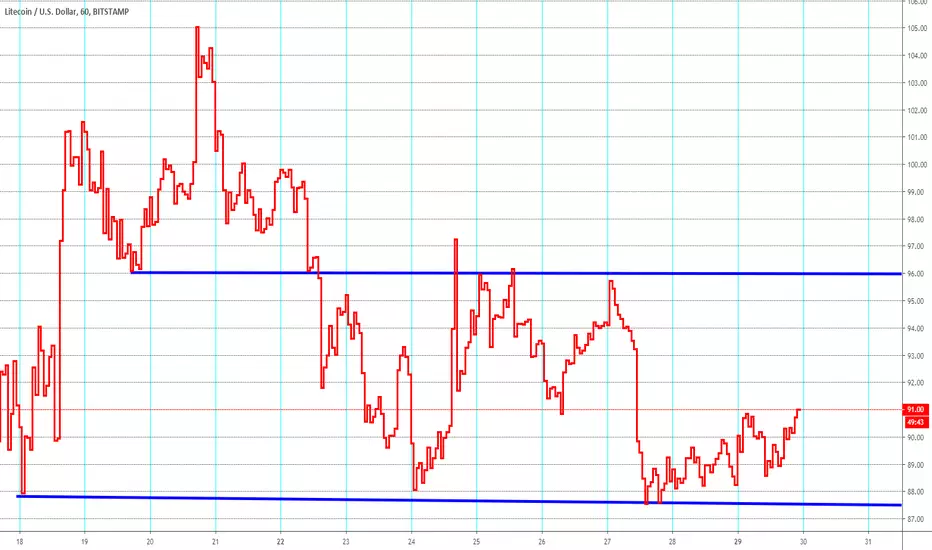
LTUSD Litecoin NEUTRAL in Trading range 1 HR Chart#Litecoin #Bitcoin #Ethereum
Hello to all watching my charts
Litecoin similar to other cryptos is catched in a trading range
between Low Support at
87.50
and High Resistance at
96.00
Only after a breakout in 1 direction above resistance or below support
we are able to analyse a clear status.
At the moment its a Neutral Status
No reason to trade here.
Good trades
If you want to support my charts and my work please like the,,,
Renkotrade
62% Increase On Litecoin ComingAfter a generous pullback I would look for a move up to the top of the green box up there and then a sudden pull back. Doesn't have to, but this is what I am looking for. Volume needs to start increasing with demand to continue bullishly. Currently looking at the ascending triangle and also descending broadening wedge, two bullish patterns to push price up. If Bitcoin starts to slow down, expect this move to happen quickly.
Not financial advise, please trade based on your own rules and setups.

Litecoin Buy Signal MONDAY????Litecoin LTCUSD is consolidating nicely on the daily chart at around 99 there is also previous support at this level witch is good. A breakout of the 106 will be my buy signal and the bulls will run!. Also on the MACD we just got a cross witch indicates a swing change and we dont long over bought on the RSI.

LTC; What might happen next ?Welcome, this is my view on Litecoin at its current market state.
We broke our strong 5 month trend line. But the bounce on the 30 of April proves to be a strong support level as well as being the .618 fib level. (swing low to swing high up trend) Looking at this golden level to be some solid consolidation.
Right now, if LTC can hold the .5 fib level as support, we might be nice for the short term.... If we can break the .382 AND hold as support we might be very looking nice :)
Also i would like to add that a few indicators point out that LTC is oversold and on a possible turn around on the daily chart. The RSI is oversold and hasn't been this low since the start of the bullish trend, the stochastic RSI crossed bullishly getting ready for a momentum move up. Also we found support on the 200 day moving average! Let's hope it will continue as support, and as Bitcoin falls, more money is likely to move into alts. Just my two satoshis !

Daily Review Of Bitcoin Litecoin Ethereum and Ripple Daily review of BTC ETH LTC and XRP
My strategy is swing trading ill be looking to get into trades that last a few days or a week i have a busy life and cant be on the computer or phone constantly to buy or sell.


LTC LITE COIN LOOKS LIKE GOOD BUYLite coin looks like a good buy here we are still low on the RSI on the 12H and the Daily we are having a little bit of consolidation people profit taking after the quick gain today after the 69% pullback. Support is at 76 if this support line fails than cut loses quickly.

Litecoin SHORT But Big Chance of Trendbrake has come in 1 HR #Litecoin #Bitcoin #Ethereum
Hello to all watching my charts
As update to my Chart from few hours ago
Litecoin is really the strongest among all cryptos at the moment.
There is only a small step to go, get over the bridge of 93.20/94.20 USD
Maybe it jumps really above theses resistance zone
and than we are in a long setup again.
Watch out !!
Good trades
If you want to support my work and my charts please like them..
Renkotrade

LTCUSD Litecoin SHORT but Chance of Trendchange Long#Litecoin #Bitcoin # Ethereum
Hello to all watching may charts
After the desaster in crypto currencys of the last days
we do see here a small chance of a new shorttime long trend in
Litecoin which is little bit surpising as Bitcoin itself
f.e. is not such strong here at the moment.
We have seen a higher High, but to confirm
as this crypto is still in my shartchannel capted
i want to see a rebound to the "Long Confirmation" aerea first.
Good trades
If you want to support my work and my charts, pleasew like them...
Renkotrade

Litecoin Halving Update, Could Hit Fib level of $70Next Fib Support is around $70 USD for LTC, We are still approaching halving but this could be the dump before the halving and then ready to ride off after the halving.

CUP AND HANDLE ON LITE COIN AND MANY OTHERS???I have been seeing this pattern again and again on charts.

An important crossroads to #Litecoin #LTCUSDThe first sign of a change in trend appeared 3 weeks ago in the form of a star candle (warning against a change in trend)
The positive point in this situation is the support of the solid Fibonacci retracement currently in place for Litecoin at the above price - $ 93.5
Scenario A-Because Litecoin at this moment touches the support above the next wave of rallies is on the way.
Scenario B-The recent gains were, in fact, a sign of the currency's demise, and the currency will continue to crash.

LTC - Retrace to $90 USDLitecoin has resolved to the downside from it's symmetrical triangle (as i noted in my prior Litecoin article) and looks to be set to retest the 20 ma support on the weekly, around the $90 USD level.
Note that this point acted as must hold support during the 2017 bull market and i believe could very well do so again, at press time Bitcoin and Litecoin appear to be digesting their respective moves.
This is normal market activity, particularly given the rapid rise over the past few months, but bear in mind that for Litecoin the 20 ma on a weekly chart is must hold support (a close below on the weekly could suggest a steeper and more protracted pullback).
As always, stay disciplined

LTCUSD Wait & SeeThe good:
-Weekly trend won’t break without a close below $97.88. Not impossible, but there sure were a lot of buyers when the wick fell off a cliff.
-Still above the 50 MA (my buy/sell line)
-The first two big legs up were profitable and had a 30% pull back between them. This one is sitting at 28%...not irregular by any measure so far.
-Both pull backs stopped at a .5 fib retracement unless we close below $103 this week
The bad:
-The 5 RSI is working on a close below the mid-line unless price turns around in a big way by Sunday
-The daily candle is 15% under the buy/sell line
-The 4h candle is 8% under the buy/sell line
-The 1h candle is back above the buy/sell line but ranging sideways…not a confident rebound
The ugly:
-Bearish divergence between price and momentum on the RSI. That doesn’t scream ‘higher price upon rebound’ to me…but I’m a rule based indicator trader, so I’ll trade what the market gives me.
There’s some fib levels on the right with prices that came from the 2017-18 peak to December trough for everyone who likes price targets instead of indicators.
I’ll go long for a halving pump on the daily chart when I see an upside cross on the 5 RSI and a close above the 50 MA…probably the $120ish range. Until then the momentum appears down even though the weekly chart still has some hope and the 1h chart just leveled out.
And I’ll just leave this here…
cryptodaily.co.uk

LTCUSD Quick Play 1h Long Litecoin BitcoinLitecoin is in a broadening descending channel. Fib retracement of 50% corresponds with resistance of the channel and the RSI > 50.

LTC ready to bounce here! LTC has dropped considerably recently but it has just broke above resistance and could be set up to rise to previous POC
Waiting for a daily close above this level is recommended for confirmation but it is looking good with OBV making a HL while price continued to make a LL
With the halvening coming up and the NFL news today, LTC isn't looking as bad as everyone says

Litecoin SHORT Chance of Trendchange 1 HR Chart#Litecoin ##Bitcoin #Ethereum #Crypto
Hello to all watching my charts.
Today Litecoin tries to find a bottom at one of my support aereas
(Lower black lines)
but the confirmation is not there at the moment.
We do need a higher high and a jump to the BLUE ARROW AEAREA
Thats important, all other movements of Litecoin is simply
a bounce in the short trend for me.
Good trades
If you want to support my work and my charts, please like them ...
Renkotrade

Litecoin SHORT 1 HR Chart#Litecoin #Bitoin #Ethereum #Crypto
Hello to all watching my charts
Litecoin shows us now really weakness the last
1,2 trading days
Broke the long blacktrendline support (my black line)
and is now middterm and shortterm in a shortchannel-
I have not added in the chart the shortest timeframe
cause ist totally enclosed in the blue lines middletimeframe
Short
I have added 2 support aereas from march/june
at 98 / 100 USD where it seems to be the pair find support now.
But dont mix that up with a long chance
It will change to LONG only after a jump to the aerea
where my BLUE ARROW is
so with a jump above the latest high at 108 USD
Good trades
If zou want to support mz charts and mz work please like them
Renkotrade

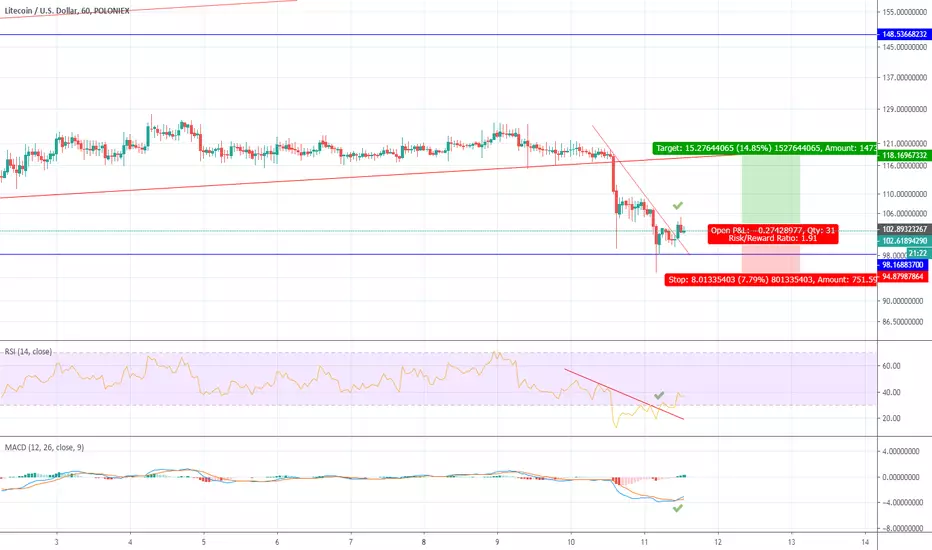
Probable 14% Litecoin ScalpYesterday Litecoin broke its upward channel and tested support at 98 (blue line) which was also a 0.618 retracement level. From here the 1H chart is showing bullish divergence. A simple strategy to use with divergence is to play the trend line breaks of BOTH the price action trend and the RSI with confirmation from MACD. My target would be a back test of the upward channel's bottom trendline at $117.60, if we break above we may be able to resume our upward channel.
Here's why I think this move is a strong possibility:
-Price action trendline broken
-Bullish Divergence on RSI
-Trendline break of RSI
-MACD confirmation
-This bounce happened at support and the 0.618 Fib level
Set stop loss slightly below the lowest wick of the last swing low.
Please feel free to share your ideas or comment!
Litecoin! Sideways? Or Retest of $160?Litecoin has been a little stagnant lately but is respecting its intermediate upward channel. It looks to be trading within a range in the short term which could continue sideways, breaking the upward channel. If we do start to move upward a retest of the $160 level is certainly possible if we don't get rejected by the $148 level. If we do break $160 and the channel continues we could hit $200 by August. That being said we are showing divergence with RSI so a downward move is always possible.
Things that need to line up before upward movement is more likely:
RSI needs to get back above 50 level
Parabolic SAR needs to print buy signal
SMI Ergodic Indicator should print cross
We are close to those requirements right now but will wait for confirmation.

Litecoin - Storing Energy for a Big Move? Litecoin (LTC) has managed to hold the 55 ema level for several days and as you can see from the triangle pattern forming, LTC seems to be storing energy for a move (either to the upside or downside).
On the weekly chart LTC has fallen back to the 9 ema, which has historically acted as the first line for major support, during the 2017 bull run LTC fell to the 9 ema and during more severe pullbacks, the 20 ma, a breach of the 20 ma signified the end of the bull run and a switch to a bear market. Needless to say these weekly levels are must hold points.
Rest assured i do not think a bearish reversal is on the cards, however bear in mind that a fall to the 20 ma on the weekly would entail a retracement back to the $90-$95 USD level.
The more likely outcome is that LTC could potential fall back to the lower trend line, or even slightly below, before a bounce and a continued rally to the next Fib level around the $170 USD mark. This pullback pattern has occurred before (circled area).
Keep an eye on LTC, as the chart is suggesting that a major move is on the cards and my guess would be that a slight dip to the trend line, followed by a move higher is more likely.

LTC/USD: Not a far Fall from SupportAbove, it can be seen that there are three trendlines which I have drawn to represent the extreme increase in the rise of price within the short period. The longer term trendlines which is only relatively longer is represented with the two green lines and the green box represents a large area of support for litecoin (support that held against the drop from 350 USD). Together the orange descending trendline and the green ascending trendline form a "symmetrical" triangle, however, the downward slope is dominating the price action--which is in my opinion bullish. In purple, there is still the rising channel from the previous analysis alongside the diverging channel which has played out.
Currently, it can be noted that there is a descending trendline which can be seen in orange, if the current trendline does not hold, then it is likely that it will fall into or beyond support, around the green box, I would expect accumulation or distribution to occur. It is also highly possible that once litecoin drops in price, then it is highly possible that it activates buy orders and the price springs up aggressively (this would be very bullish and it is denoted by the blue line). The orange line would be a very bearish situation because it would break the orange trendline with weakness and it would break the green trendline afterwards. Another bullish outcome which I didn't add is if price breaks out at the apex of the symmetrical triangle.
The RSI is having some difficulty breaking into the channel, however, it did bounce off of 40, so it is still within the bullish range on the daily.
I will maintain my bearish stance with litecoin, however, there are extremely bullish opportunities presenting itself within the chart.
Previous Analysis:
