EW: Five-Wave Cycle On BTGUSD, More Upside After A PullbackHello Crypto traders!
Cryptocurrencies are in a massive rally and one of them is also BTGUSD (Bitcoin Gold), where we see room for more gains within a five-wave cycle, we just have to be aware of a potential pullback in wave 4, which can be quite big looking at the logarithmic scale chart. Well, what we want to say is that BTGUSD remains bullish while it's trading in that EW channel and any decline should be only a temporary pause within higher degree trend, before we will see a continuation higher for wave 5.
Be humble and trade well!
Disclosure: Please be informed that information we provide is NOT a trading recommendation or investment advice. All of our work is for educational purposes only.
Logscale

Weekly Double bottom off PCZ of logscale Bullish SharkThe weekly closed with a piercing line pattern off the neckline of a weekly double bottom and we are above the 55 week Simple moving Average. I expect this could take us to much higher prices and will be buying here and if it goes lower i will also be buying within the green zone with limited risk.

Bitcoin Log Scale with Fibs on BLX 2WK Log scale idea for BTC on the BLX chart. Fib channels and trend based time fibs with fib retrace extensions set to log scale fibs. RSI showing an interesting inverted head and shoulders patters suggesting a possible break higher from this ascending channel.

LTCUSD - The big picture (log scale)Looks like we're about to retest the support level at 180$ (55 EMA). At the same time we're not far away from the temporary resistance at 240$. If we break through it and find new support we might have another big leg up. Also google trends shows me that the interest for "litecoin" is by far not even close to the ath from 2017. So all in all I'm bullish on this one and I do think 600$ and more are possible targets. However if we can't hold 180$ get ready for a correction. It's my first technical analysis so plz don't take it is a financial advise.

BTCUSD: Monthly Log Chart A logarithmic look at the evolution of BTC price since its very early days
The following key takeaways:
BTC tends to extend only about 1/5 of its prior impulse move measured in terms of % increase;
BTC tends to react ≈38.20% on a logarithmic scale to form a correctional bear market;
The sub $80k area is a pivotal area to look for supply inflows.
This analysis suggests an earlier-than-expected onset of bull trend maturity stage in the upcoming few months, which might correct this lower to the $20k area.

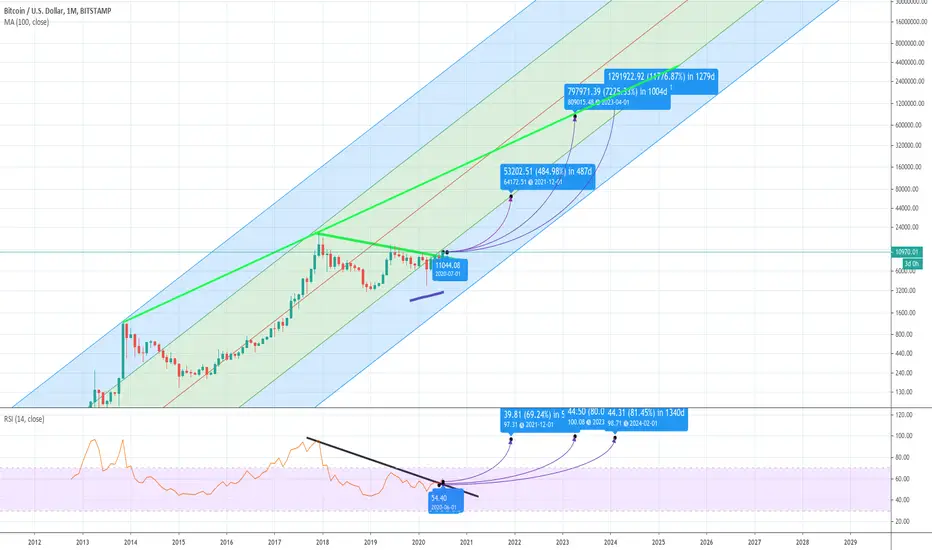
The long term bull caseI have made a lot of comments about the long term bull case for bitcoin. Really that comes in the form of a number of different angles and analysis, which I might suggest a couple more ways of looking at things.
This one goes on the assumption that the price follows historic price action, which it often doesnt. At these prices retail traders are put off, and institution plays a vital role in propping up prices. Fair value of bitcoin is under greater focus the higher the price, and hands get weaker at tops, until new supports are created. In this run we are yet to find a floor for value. Whilst this chart doesnt show a downward price discovery, one will need to happen at some point.
This simply goes on the assumption that IF price continues to match the pattern, and we assume that percentage increase also matches, the price will top at around $320,000usd per btc.
I should note, although I am personally a longterm permabull (year timeframe), I am short term trading trends and always open to short opportunities as well as long term opportunities. This is one bullish outlook, based on certain hand-picked facts. It is not my only outlook, and I could create an equally bearish chart given the time!
Thoughts on anything in this chart are welcomed

$ALGO 4hr pitchfork = strong trend.This is log scale chart. The pitchfork shows a strong respect of the 1.5 deviation. We've seen a couple of flash crashes to the 2.0 deviation on other bigger coinbase alts like $LINK, so those kinds of moves are still on the table. Also if big daddy $BTC decides to run? Alt's will bleed / stay sideways for a while. I'm still very bullish on these Coinbase alts.
BTC breaks out into price discovery -> retail normies fomo in -> Coinbase is the onramp -> Bitcoin is "too expensive" -> Normies buy cheaper alt coins, especially ones like $ALGO that have staking rewards -> Alt season commence.

Possible Rising wedge The bottom corresponds to the breaking point on the Wedge.
IE if the wedge broke on one of the Red lines extending downwards it will hit that price point.
A recovery will most likely not bounce directly off the curve unless it is done in a single candle from break to target.
Hope i explained that well enough, Log charts are harder to calculate until the breakout/ breakdown happens.
Good Luck And Safe Trading.

BTC Log Scale Moon Math w/Fib channel extensions.This is a Log scale chart on BTC/USD from Bitstamp. Utilizing fib channels with 618 extensions, trend based fib time, and regular fib extensions.

Bitcoin targetBy analyzing past cycles on a log scale and doing some math I believe the target for this cycle is between $140000 - $150000.
Of course this is no way a perfect analysis. .


Is BTC In a Bull Run Guyz?Given up on any regular scale trades and sticking with cycles for now and holding assets. Lets see where the next one takes us!

Bitcoin Dreams - Looking At The Log ChartIts hard to conceptualize a $50,000, $100,000 let alone a $500,000 per BTC price in the future, however the log chart really helps with the visualization. Just trying to illustrate the headroom BTC has to run, and how quickly it may do just that. Not 'technical analysis' just exploring the possibilities. This is not trading advise, just archiving my thoughts.
BTC Moves on This Path....?Playing around with the log chart, just trying to get some concept of where the price extremes are and where important lines (like ATH) converge. The last market cycle had bitcoin making its ATH seven weeks before the previous ATH converged with the bottom trend line. If the same thing were to happen this cycle, and the high comes in exactly on the top trend line, then we'd see a high of around $200K on the 13th of November, 2023.
That's still a ways off, but I think I can live with that kind of return in just over three years :)

🔥🔥🔥 log BTC for thinking 🤔🤔Hello, guys! 👋🏻 Today I wanna bring to your attention log chart of Bitcoin 🔥
Everyone of us knows, Bitcoin is an exhaustible resource. ☝🏻
❗❗❗ In total, it's possible to produce 20 million, and more than 18 million have already been extracted. ❗❗❗
The main question!!!👇🏻
⁉What price of BTC would, when miners get the last million ? 🧐
✍🏻I'm waiting for you for discuss in the comments, friends !!😏
Stay with me💋
Your Rocket Bomb🚀💣

S&P 500 BIG SHORTJust another big short remember That name.
In the trading book at the night debt cycles burning bright.
Era of rise of productivity, we have strong opacity.
Beacuse more complexity of economy modes.
We must be on the cheater codes to win this battle nodes.
So let's see my analysis and win cash on the crisis!

Long to the "End of May"... BTC Future price predictionLong to the "End of May"... BTC Future price prediction.
In this Words prediction is cointained, little flight to 10k is provided...
Long-Debt Cycle in the end, The deflation band plays in stand...
Anti-Inflationary actives going down, but supply is down too ...
Falling will be smoother, at 2022 best price to buy will be revealed like dry peanut butter...
So be wise... do think twice :)
Poem by Alex Independent Investor

BTC and MacroEconomics FundamentalsBitcoin are "anti-inflationary" asset . In deflation times ( prediction: mid 2020 - mid 2022) Bitcoin is not good asset to hold.
Better strategy is to buy high amounts at mid 2022 (expected low).


Bitcoin Might Have Reached a Long-Term BottomPlease press the LIKE button if you enjoy the analysis
The support line outlined in the chart above is drawn in the logarithmic scale and has been in place since BTC’s inception. In addition, the 200-week moving average is outlined in black.
The price has validated both the support line and the MA numerous times, the prior three being on:
-August 2015
-December 2018
-January 2019
The current weekly candlestick is below this support line and has touched the MA. However, there are four more days until the weekly candlestick closes, so we cannot yet state that the price has broken down below this line. For example, on August 2015, the price decreased way below this level only to bounce afterward and close the week slightly above the MA.
The weekly RSI can be helpful in determining where the current price level is in regards to previous cycles. It has been oversold on only two occasions, January 2015 and December 2018.
The current decrease that touched the support line has occurred 462 days after the RSI bottom. Interestingly, the price also touched the support line 462 days after the January 2015 bottom and created a very long lower wick.
As for the vertical lines, they represent the halvening dates. The proximity to halvening is another similarity between these two cycles and suggests that this is probably a bottom.
Therefore, the most probable move from here is a gradual price increase that would cause a weekly close above $6,000 and the ascending support line. The rate of increase would be expected to increase after halvening.

XRP: Hold til End of YearIf you consider the entire cryptoasset market at the moment, we're beginning to see a shift in mentality.
There is more optimism in the markets. Though still carrying great skepticism, it should be noted that there are several indicators to our advantage that signal the beginning of another possible bull run.
Considering that there is a significant uptrend in BTC's chart (where we can also refer to the Ichimoku Cloud and infer that all three indicators are pointing upwards in the daily) and its effect on the entire crypto market, coupled with the halving that's set to occur in May, it would not be out of the question that we begin to see a snowball effect over the next 3-4 months. These indicators are pointing to a -very- strong upward momentum and it doesn't look like it will end any time soon.
Even though I previously did a piece on going both long and short on BNB, after looking at the log chart and comparing it to XRP's position and overall fundamentals, it seems as though the ROI that is projected for XRP during the span of this year is -considerably- larger.
In short, if you want to make money, it's likely that both BNB and XRP will go up during these following months.
BUT if you want to make FAT stacks, I suggest going with XRP.
LB out.

BitcoinUSD BLX Log LinesHere is a couple well known log lines applied to a TV chart.
This is not trading/financial advice.

BitcoinUSD Internal Fibonacci Patterns XPrice likes to revisit zones, zones were price stopped and price visited once (TF dependent) establishes an area that attracts price. However if rejected, zone becomes a strong boundary for a probable duration of time. Price rarely leaves an area to never return. Yellow represents a strong attraction for price. Blue Repels.
Previous Analysis
This is not trading/financial advice.
