HelenP. I Gold will rebound up from trend line to $3400 levelHi folks today I'm prepared for you Gold analytics. After looking at this chart, we can see how the price after a prolonged consolidation inside a large wedge pattern, XAUUSD, approached the ascending trend line again - this line has acted as a key support several times in the past. This time is no exception: the price reacted to it with a bullish bounce. We can see a confluence here — trend line support coincides with the lower boundary of the wedge and the local support zone at 3270 - 3250 points. Now the price is trading above this line, showing early signs of recovery. Given the symmetry of this structure and past behavior, I expect gold to continue rising from current levels. The nearest major obstacle lies in the resistance zone around 3400 - 3420, which acted as a turning point before. That’s why my current goal is set at the 3400 level. If bulls hold the trend line, we may see a steady move toward this key resistance. Given the trend line reaction, wedge structure, and current momentum, I remain bullish and expect further growth. If you like my analytics you may support me with your like/comment ❤️
Disclaimer: As part of ThinkMarkets’ Influencer Program, I am sponsored to share and publish their charts in my analysis.
Long!!!!

Gold Potential UpsidesHey Traders, in today's trading session we are monitoring XAUUSD for a buying opportunity around 3,300 zone, Gold is trading in an uptrend and currently is in a correction phase in which it is approaching the trend at 3,300 support and resistance area.
Trade safe, Joe.

EURUSD Breakout and Potential RetraceHey Traders, in today's trading session we are monitoring EURUSD for a buying opportunity around 1.15700 zone, EURUSD was trading in a downtrend and successfully managed to break it out. Currently is in a correction phase in which it is approaching the retrace area at 1.15700 support and resistance area.
Trade safe, Joe.

AUDUSD Potential UpsidesHey Traders, in today's trading session we are monitoring AUDUSD for a buying opportunity around 0.63800 zone, AUDUSD is trading in an uptrend and currently is in a correction phase in which it is approaching the trend at 0.63800 support and resistance area.
Trade safe, Joe.

GBPUSD Breakout and Potential RetraceHey Traders, in today's trading session we are monitoring GBPUSD for a buying opportunity around 1.35900 zone, GBPUSD was trading in a downtrend and successfully managed to break it out. Currently is in a correction phase in which it is approaching the retrace area at 1.35900 support and resistance area.
Trade safe, Joe.

USOIL LONG FROM SUPPORT
USOIL SIGNAL
Trade Direction: long
Entry Level: 64.84
Target Level: 70.03
Stop Loss: 61.37
RISK PROFILE
Risk level: medium
Suggested risk: 1%
Timeframe: 9h
Disclosure: I am part of Trade Nation's Influencer program and receive a monthly fee for using their TradingView charts in my analysis.
✅LIKE AND COMMENT MY IDEAS✅

GOLD: Long Signal Explained
GOLD
- Classic bullish formation
- Our team expects pullback
SUGGESTED TRADE:
Swing Trade
Long GOLD
Entry - 3306.4
Sl - 3294.6
Tp - 3332.6
Our Risk - 1%
Start protection of your profits from lower levels
Disclosure: I am part of Trade Nation's Influencer program and receive a monthly fee for using their TradingView charts in my analysis.
❤️ Please, support our work with like & comment! ❤️

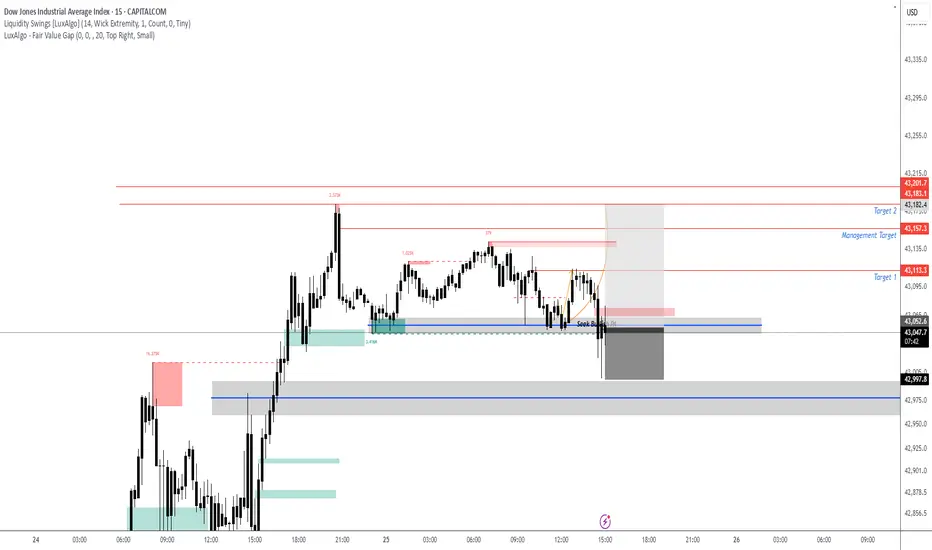
US30 - Entries ActiveAs anticipated got the sweep below then break above our area with a U shape formation. Looking to the upside.
CAD/CHF BULLS ARE GAINING STRENGTH|LONG
Hello, Friends!
We are going long on the CAD/CHF with the target of 0.594 level, because the pair is oversold and will soon hit the support line below. We deduced the oversold condition from the price being near to the lower BB band. However, we should use low risk here because the 1W TF is red and gives us a counter-signal.
Disclosure: I am part of Trade Nation's Influencer program and receive a monthly fee for using their TradingView charts in my analysis.
✅LIKE AND COMMENT MY IDEAS✅

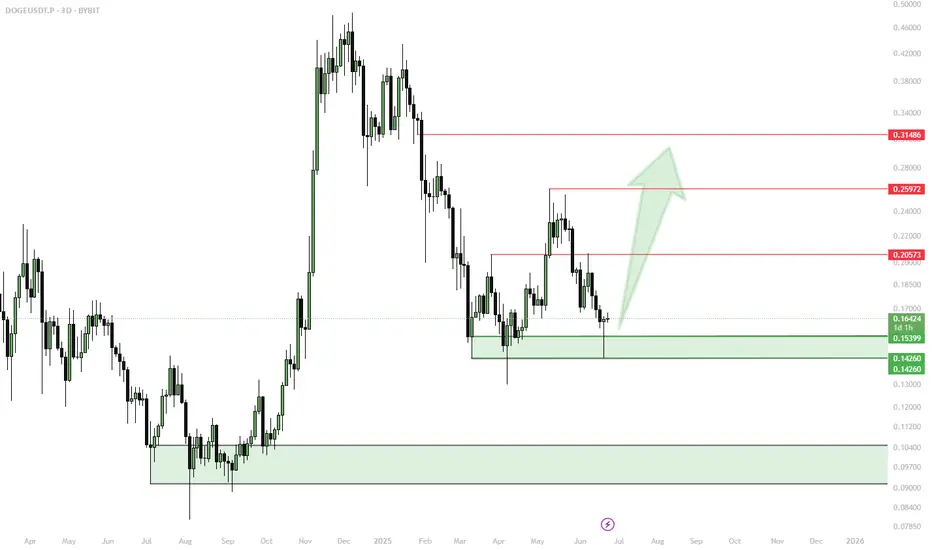
DOGE Forming a Bottom — Risk/Reward Favor Bulls✅ DOGE looks “forgotten” — minimal interest, low volume, no panic selling
✅ Bottoming structure forming; bounce from key support, retest of lows possible
✅ Accumulation only via spot limit orders in green zones; avoid market buys
⚠️ No expectations of breaking ATH, targets capped at $0.31–0.38
1. Bullish Scenario (~55%)
Retest of support zones ($0.143–0.16), spot accumulation
Trigger: Bounce on volume, reclaim of previous quarterly levels
Partial profit: $0.25; main targets: $0.31–0.38
2. Sideways Scenario (~35%)
Consolidation between $0.14–0.18, low volume, slow accumulation
Work the range: accumulate at lows, trim on spikes, patience
3. Bearish Scenario (~10%)
Break below $0.14 with no demand, deeper altcoin market correction
Stop loss on close under $0.14, wait for new supports — no averaging down without buy signals
📝 Order Management & Recommendations:
Place spot limit orders only in $0.143–0.16 and lower green zones
No market FOMO entries
First take-profit: $0.25; main TP: $0.31–0.38
Hard stop/loss under $0.14; no holding through breakdowns
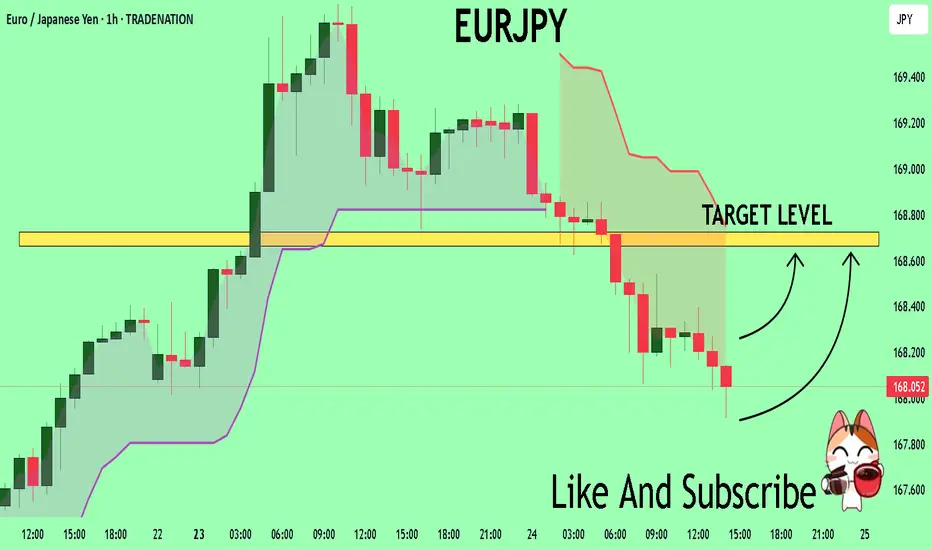
EURJPY Will Explode! BUY!
My dear friends,
My technical analysis for EURJPY is below:
The market is trading on 168.01 pivot level.
Bias - Bullish
Technical Indicators: Both Super Trend & Pivot HL indicate a highly probable Bullish continuation.
Target - 168.66
About Used Indicators:
A pivot point is a technical analysis indicator, or calculations, used to determine the overall trend of the market over different time frames.
Disclosure: I am part of Trade Nation's Influencer program and receive a monthly fee for using their TradingView charts in my analysis.
———————————
WISH YOU ALL LUCK
GOLD My Opinion! BUY!
My dear followers,
I analysed this chart on GOLD and concluded the following:
The market is trading on 3313.7 pivot level.
Bias - Bullish
Technical Indicators: Both Super Trend & Pivot HL indicate a highly probable Bullish continuation.
Target - 3321.8
Safe Stop Loss - 3309.7
About Used Indicators:
A super-trend indicator is plotted on either above or below the closing price to signal a buy or sell. The indicator changes color, based on whether or not you should be buying. If the super-trend indicator moves below the closing price, the indicator turns green, and it signals an entry point or points to buy.
Disclosure: I am part of Trade Nation's Influencer program and receive a monthly fee for using their TradingView charts in my analysis.
———————————
WISH YOU ALL LUCK

US30 - Final Push before PullbackPotentially another push to upper levels of supply potentially 43,150-43,200. Can see this retest before seeing a potential pull back based off larger time frame.

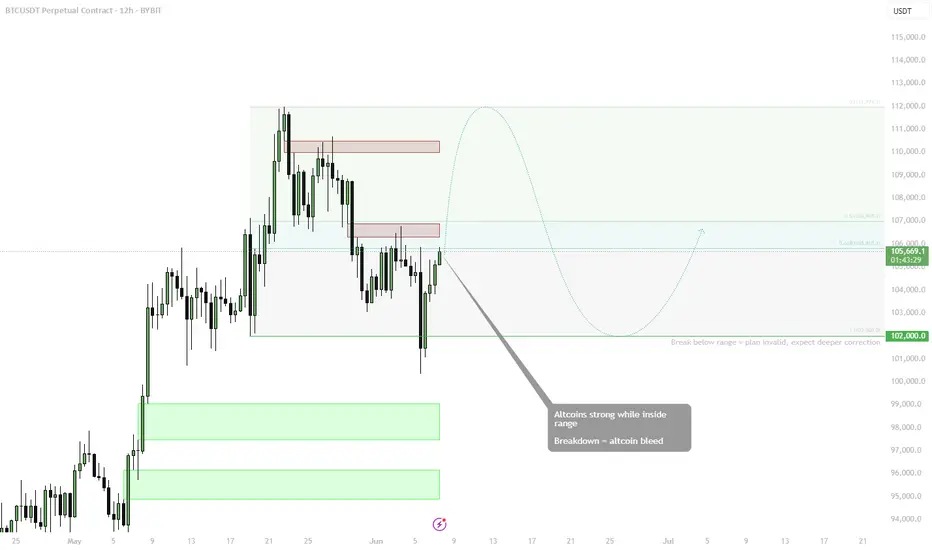
BTC — Altcoin Sentiment Hinges on BTC Holding BINANCE:BTCUSDT is consolidating within a well-defined range between ~$102K and ~$112K, with a bounce off the lower boundary now challenging midrange resistance. As long as BTC trades within the range, altcoins are expected to remain strong.
🟩 Midrange: $106K
• 0.618 fib and prior supply zone
• Key inflection for either a move higher or return to range low
🔻 Range Low Support: $102K
• Break below this = plan invalid
• Expect deeper BTC correction and altcoin bleed in that scenario
📈 Bias:
• Altcoins strong = only valid if BTC holds this structure
• Rotations likely while BTC moves sideways or grinds higher
• Upside target (range high): ~$111.9K
📌 BTC stability = altcoin opportunity. Breakdown from range? Get defensive fast.
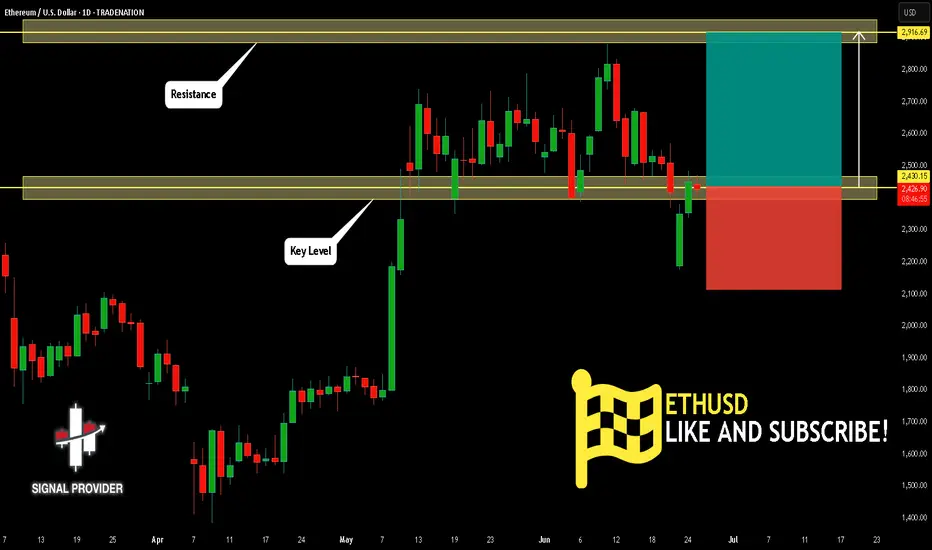
ETHUSD Is Going Up! Long!
Please, check our technical outlook for ETHUSD.
Time Frame: 1D
Current Trend: Bullish
Sentiment: Oversold (based on 7-period RSI)
Forecast: Bullish
The market is approaching a key horizontal level 2,430.15.
Considering the today's price action, probabilities will be high to see a movement to 2,916.69.
P.S
We determine oversold/overbought condition with RSI indicator.
When it drops below 30 - the market is considered to be oversold.
When it bounces above 70 - the market is considered to be overbought.
Disclosure: I am part of Trade Nation's Influencer program and receive a monthly fee for using their TradingView charts in my analysis.
Like and subscribe and comment my ideas if you enjoy them!
USOIL: Bullish Correction Ahead! Buy!
USOIL
- Classic bullish correction formation
- Our team expects growth
SUGGESTED TRADE:
Swing Trade
Buy USOIL
Entry Level - 65.16
Sl - 62.68
Tp - 68.86
Our Risk - 1%
Start protection of your profits from lower levels
Disclosure: I am part of Trade Nation's Influencer program and receive a monthly fee for using their TradingView charts in my analysis.
❤️ Please, support our work with like & comment! ❤️

NZD/CHF SENDS CLEAR BULLISH SIGNALS|LONG
Hello, Friends!
NZD/CHF pair is trading in a local downtrend which we know by looking at the previous 1W candle which is red. On the 1D timeframe the pair is going down too. The pair is oversold because the price is close to the lower band of the BB indicator. So we are looking to buy the pair with the lower BB line acting as support. The next target is 0.496 area.
Disclosure: I am part of Trade Nation's Influencer program and receive a monthly fee for using their TradingView charts in my analysis.
✅LIKE AND COMMENT MY IDEAS✅

ETH Eyes FVG Fill — Buy Dips Toward Confluence Support✅ Multiple confluences: 1h MSS, range lows, FVG, and OB cluster at $2,273–$2,319
✅ High probability of FVG ($2,529) being filled before new lows
⚠️ Downside sweeps are buys, not sells — use zone for bids
Active Setup:
Long Entry: Bids in $2,273–$2,319 zone (on confirmation: SFP/reclaim or strong bounce)
Targets: First TP at FVG ($2,529), next at range high ($2,787)
Stop: Below $2,185 (invalidate on close below sweep low)
🔔 Triggers & Confirmations:
Only enter on strong reversal/bounce in blue box
No FOMO above FVG, wait for clean setup
🚨 Risk Warning:
Avoid chasing into resistance (FVG), wait for dip entries with confirmation

EURUSD - Looking to the upside retest of SupplyLooking to the upside, first lets get that push to lower level of liquidity swing then a push to the upside. Only on bullish confirmation at our highlighted level. I think we have one more retest before catching a potential short (pullback) on the larger time frame. Long term target for EURUSD is 1.200.

Bitcoin can correct to support line of channel and start to growHello traders, I want share with you my opinion about Bitcoin. The price was moving inside a strong upward channel, where it managed to break through the support level and then the resistance level, eventually reaching the seller zone. After that, BTC started to turn around and declined, once again breaking through the 109000 resistance level, this time from above. That movement also marked an exit from the upward channel. Following that, the price made a correction move down to the support level — the same zone that previously acted as a breakout area. From there, BTC showed strength again with a bullish impulse upward, returning to the Seller Zone. However, that rally was short-lived. The market started to decline again, this time forming a downward channel. Now the price is approaching the support line of this channel, which coincides with the support level around 100500 and the buyer zone between 99500 and 100500. I think BTC can decline a bit further to test this support line, and then rebound from this area, starting a new upward move toward the channel resistance line. That’s why I’ve set my TP at 106000 points, just below the resistance line. Given the structure and past reactions from these zones, I remain bullish and expect further growth after this local pullback. Please share this idea with your friends and click Boost 🚀
Disclaimer: As part of ThinkMarkets’ Influencer Program, I am sponsored to share and publish their charts in my analysis.

APX Rebound in Play?📈 “APX Rebound in Play? Eyeing the AUD 1.55 Resistance”
Appen (APX) has shown a significant uptick today, closing at AUD 1.040 (+5.58%) with a sharp volume spike (8.96M shares) that could suggest accumulation. After a long downtrend, price appears to be consolidating above key support near AUD 1.00, forming a potential base for reversal.
🔍 Chart Highlights:
Support Zone: AUD 1.000 – strong historical level holding.
Resistance Targets: → AUD 1.555 → AUD 1.655 → AUD 1.785
R/R Setup: Defined green zone shows potential upside if momentum continues; red zone clearly marks invalidation below support.
🧠 Thesis: If APX maintains momentum and holds above AUD 1.00, we may be witnessing a structural shift with upside potential toward AUD 1.78 in stages. Breakout traders might watch for confirmation via volume and price action at each resistance.
💬 “Could we be looking at an early-stage reversal or just a dead-cat bounce? Watching the 1.00 level closely.”
#ASX #APX #APPEN #MJTRADING #TRADING #SHARE #STOCKMARKET #BUY #CHART #MONEYMANAGEMENT

Buying the Dip or Catching a Knife? My Gold Setup Explained.Entered a long position on XAU/USD from the 1H demand zone following sharp intraday selling into a key support level. With gold hovering near $3,300 and a significant testimony from Fed Chair Powell on deck, the setup aligns with both technical rebound potential and fundamental uncertainty that could fuel upside.
The goal here is to play the liquidity vacuum left after aggressive positioning was cleared, with tight invalidation and asymmetric reward.
Technicals:
• Entry aligned with prior price inefficiency and confluence of multiple demand zones
• 1H structure shows clear deviation below the range with immediate buy-side response
• EMA channel flattening, indicating potential compression ahead of expansion
• First target: $3,352
• Risk-managed with defined stop-loss below $3,260
Execution Note: This is not a “hold forever” trade. It’s an opportunistic reaction to unwind + sentiment imbalance.
Fundamentals
• Gold saw a 25% surge in 2024 due to safe-haven demand and dovish policy, but enters 2025 under pressure from:
▫️ A strong USD
▫️ Higher cost of carry
▫️ Speculators taking profit
• Fed policy remains the core variable:
▫️ A hawkish tone from Powell could weigh on price
▫️ Rate cuts would likely revive bullish momentum
• Central bank demand remains supportive
• Geopolitical tensions (Russia-Ukraine, Israel-Iran) could trigger safe-haven bids again.
Bearish headwinds:
• Waning bullish momentum per RSI divergence
• Reduced rate cut expectations post-election
• Powell’s testimony could revive volatility either way.
This is a short-term tactical long, not a macro bet. With sentiment temporarily overextended and key support defended intraday, this is a high R/R window to exploit Powell-related volatility.
Let’s see how price reacts into $3,350+. Any sustained strength there would open room toward $3,400, while failure would confirm a retest of $3,260s.
Note: Please remember to adjust this trade idea according to your individual trading conditions, including position size, broker-specific price variations, and any relevant external factors. Every trader’s situation is unique, so it’s crucial to tailor your approach to your own risk tolerance and market environment.

GOLD - Price can rise in channel to $3495 resistance lineHi guys, this is my overview for XAUUSD, feel free to check it and write your feedback in comments👊
After price started to trades inside triangle, it made an impulse up, breaking two levels, after which turned around.
Price dropped to $3195 level, breaking resistance level, and made a first gap, after which rose to resistance line.
Then Gold in a short time declined to support line, making a two gaps again and then bounced up from support line.
Gold exited from triangle and continued to move up inside rising channel, where it first made a correction.
In channel, price grew higher than $3400 level, but recently turned around and fell to support line.
Now, I expect that Gold can bounce from this line and rise to $3495 resistance line, breaking resistance level.
If this post is useful to you, you can support me with like/boost and advice in comments❤️
Disclaimer: As part of ThinkMarkets’ Influencer Program, I am sponsored to share and publish their charts in my analysis.
