BTCUSD Sellers In Panic! BUY!
My dear followers,
This is my opinion on the BTCUSD next move:
The asset is approaching an important pivot point 10489
Bias - Bullish
Safe Stop Loss - 10362
Technical Indicators: Supper Trend generates a clear long signal while Pivot Point HL is currently determining the overall Bullish trend of the market.
Goal - 10701
About Used Indicators:
For more efficient signals, super-trend is used in combination with other indicators like Pivot Points.
Disclosure: I am part of Trade Nation's Influencer program and receive a monthly fee for using their TradingView charts in my analysis.
———————————
WISH YOU ALL LUCK
Long!!!!

USOIL: Bullish Forecast & Bullish Scenario
The price of USOIL will most likely increase soon enough, due to the demand beginning to exceed supply which we can see by looking at the chart of the pair.
Disclosure: I am part of Trade Nation's Influencer program and receive a monthly fee for using their TradingView charts in my analysis.
❤️ Please, support our work with like & comment! ❤️

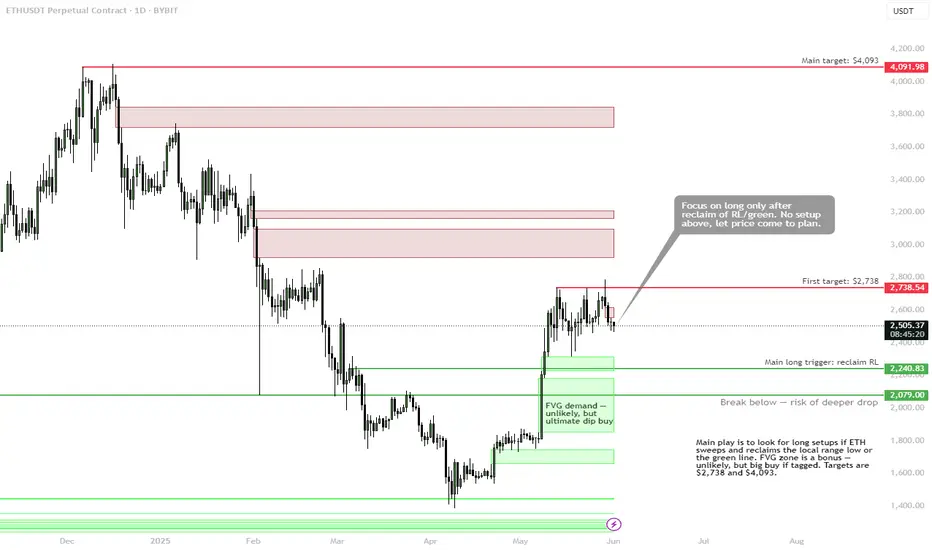
ETH (plan in progress) — Setup Only Valid on ReclaimCRYPTOCAP:ETH is consolidating beneath key resistance at $2,738, failing to show bullish continuation. The current zone offers no valid long setup until structure confirms. Eyes remain on range low sweeps and reclaim triggers.
Plan:
✅ Main Long Trigger: Reclaim of $2,240–2,250 range low
• Must see price sweep and reclaim local lows or green SR
• No setup above current levels — wait for plan to trigger
• First target: $2,738
• Main target: $4,093
🟩 FVG Demand Zone (Ultimate Dip Buy): $2,080–1,800
Unlikely to tag, but if reached — high conviction buy zone.
🚫 Break Below $2,079 → increased risk of deeper drop
• Exit bias if structure breaks down below green zone
Summary:
Let the price come to the plan — no need to chase. Focus is on range low reclaim or FVG tag as entry catalysts. Don’t long mid-range without confirmation.
📌 Discipline is an edge — great entries come to those who wait.
ETH | (reversal setup) — Waiting for Sweep & Reclaim to Trigger BINANCE:ETHUSDT is approaching a key liquidity pocket around $2,440, where multiple wicks have stacked. Price is likely to sweep this zone before any sustained move higher. The current plan favors waiting for the trap → then reacting.
Setup:
🟩 Trigger Zone: $2,440–2,400
• Expecting a sweep of $2,440
• Long setup only valid if price sweeps + reclaims on lower timeframe
• Break below $2,400 = invalidation, wait for new structure
🚫 No entry on first touch — avoid longs without a strong reclaim
🎯 Target Zone: $2,738+
First resistance comes from the H4 supply and the previous range high.
Plan:
• Monitor for liquidity grab and reclaim
• If structure holds — good R:R swing setup
• If not — stand aside, reassess at deeper levels
📌 Smart money needs liquidity. Let it sweep first — then strike.

USDJPY Will Grow! Long!
Here is our detailed technical review for USDJPY.
Time Frame: 8h
Current Trend: Bullish
Sentiment: Oversold (based on 7-period RSI)
Forecast: Bullish
The market is trading around a solid horizontal structure 144.062.
The above observations make me that the market will inevitably achieve 145.457 level.
P.S
We determine oversold/overbought condition with RSI indicator.
When it drops below 30 - the market is considered to be oversold.
When it bounces above 70 - the market is considered to be overbought.
Disclosure: I am part of Trade Nation's Influencer program and receive a monthly fee for using their TradingView charts in my analysis.
Like and subscribe and comment my ideas if you enjoy them!

EURUSD Possible AnalysisEURUSD has been overall bullish with retracemets here and there. It has recently made a deep retracement that could be mistaken for a shift in market structure, while in reality it's just liquidity accumulation. Price recently shifted structure back to bullish on 4h timeframe where it preceded to break more structure before retracing to sweep liquidity below a low and tap a fvg in the process. It preceded to shift structure on the 1h time frame, breaking with a huge bullish candle symbolizing increase in bullish momentum. It is currently retracing towards an orderblock that was responsible for the break and could possibly retest it and fill the imbalance above it before it continues its bullish move up to take out the latest weak high.

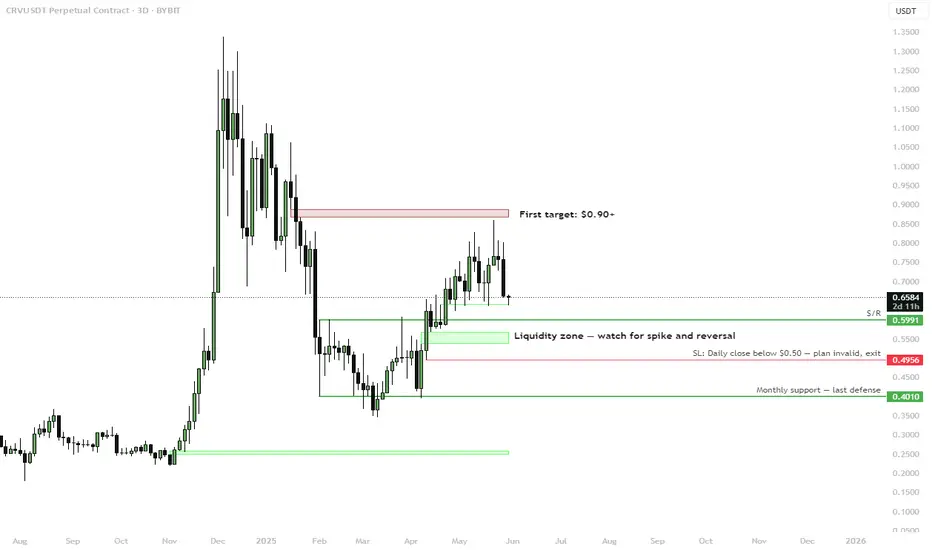
CRV (swing setup) — Watching Liquidity Zone ReactionBINANCE:CRVUSDT is pulling back into a key liquidity zone around $0.60–$0.55. This area acted as prior resistance and is now being retested as support. A spike into this zone with a bullish reaction could offer a strong swing entry.
Setup:
🟩 Liquidity Zone: $0.60–$0.55
Look for liquidity sweep and reversal signal within this zone. Key confluence with S/R flip and HTF demand.
🚫 Invalidation:
• Daily close below $0.50 = setup invalid
• Final defense at $0.4010 (monthly support)
🎯 First Target: $0.90+
Clear resistance above, likely to act as first take-profit zone if reversal plays out.
Plan:
• Monitor lower timeframes for entry trigger inside liquidity zone
• Favor patience and confirmation — this is a high-R setup if structure holds
📌 Classic SFP setup at support — risk defined, upside open.
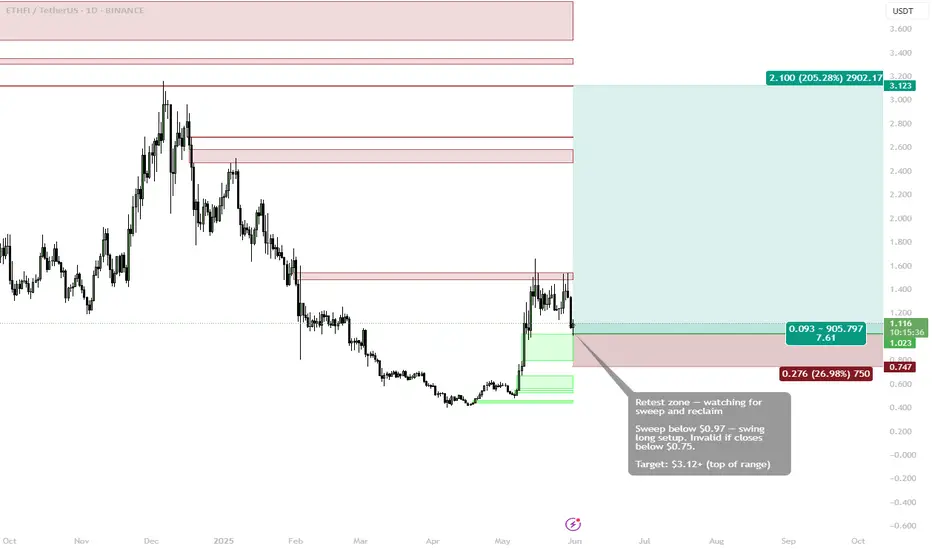
ETHFI (swing setup) — Retest in Progress Eyes on Sweep & ReclaimBINANCE:ETHFIUSDT is retesting a key breakout zone after a strong rally. Current structure suggests a possible swing long setup forming, contingent on a liquidity sweep below $0.97 and a clean reclaim.
Entry Criteria:
🟩 Retest Zone: $0.97–1.02
Looking for a sweep below $0.97 followed by a reclaim and bullish confirmation for entry.
❗ Invalidation: Close below $0.75 cancels the setup — indicates structural breakdown.
🎯 Target: $3.12+
Aiming for the top of the previous range — a 200%+ move if the reclaim holds.
📌 Big moves come from big levels — timing the reclaim is key.
BTCUSD: Bullish Continuation & Long Trade
BTCUSD
- Classic bullish setup
- Our team expects bullish continuation
SUGGESTED TRADE:
Swing Trade
Long BTCUSD
Entry Point - 10465
Stop Loss - 10321
Take Profit - 10794
Our Risk - 1%
Start protection of your profits from lower levels
Disclosure: I am part of Trade Nation's Influencer program and receive a monthly fee for using their TradingView charts in my analysis.
❤️ Please, support our work with like & comment! ❤️

USDCAD: Long Signal Explained
USDCAD
- Classic bullish formation
- Our team expects growth
SUGGESTED TRADE:
Swing Trade
Buy USDCAD
Entry Level - 1.3742
Sl - 1.3706
Tp - 1.3809
Our Risk - 1%
Start protection of your profits from lower levels
Disclosure: I am part of Trade Nation's Influencer program and receive a monthly fee for using their TradingView charts in my analysis.
❤️ Please, support our work with like & comment! ❤️

SILVER: Will Start Growing! Here is Why:
Our strategy, polished by years of trial and error has helped us identify what seems to be a great trading opportunity and we are here to share it with you as the time is ripe for us to buy SILVER.
Disclosure: I am part of Trade Nation's Influencer program and receive a monthly fee for using their TradingView charts in my analysis.
❤️ Please, support our work with like & comment! ❤️

NATGAS: Forecast & Technical Analysis
The recent price action on the NATGAS pair was keeping me on the fence, however, my bias is slowly but surely changing into the bullish one and I think we will see the price go up.
Disclosure: I am part of Trade Nation's Influencer program and receive a monthly fee for using their TradingView charts in my analysis.
❤️ Please, support our work with like & comment! ❤️

USOIL Expected Growth! BUY!
My dear subscribers,
My technical analysis for USOIL is below:
The price is coiling around a solid key level - 60.68
Bias - Bullish
Technical Indicators: Pivot Points Low anticipates a potential price reversal.
Super trend shows a clear buy, giving a perfect indicators' convergence.
Goal - 61.41
My Stop Loss - 60.25
About Used Indicators:
By the very nature of the supertrend indicator, it offers firm support and resistance levels for traders to enter and exit trades. Additionally, it also provides signals for setting stop losses
Disclosure: I am part of Trade Nation's Influencer program and receive a monthly fee for using their TradingView charts in my analysis.
———————————
WISH YOU ALL LUCK

BTC HTD Demand zones for longBTH HTF Demand Zone are marked,
when price hit these levels you can take long if you want,
trading is risky, Do-your-own-research, Follow risk management

USDCHF Will Go Up From Support! Long!
Please, check our technical outlook for USDCHF.
Time Frame: 2h
Current Trend: Bullish
Sentiment: Oversold (based on 7-period RSI)
Forecast: Bullish
The market is approaching a key horizontal level 0.822.
Considering the today's price action, probabilities will be high to see a movement to 0.826.
P.S
Please, note that an oversold/overbought condition can last for a long time, and therefore being oversold/overbought doesn't mean a price rally will come soon, or at all.
Disclosure: I am part of Trade Nation's Influencer program and receive a monthly fee for using their TradingView charts in my analysis.
Like and subscribe and comment my ideas if you enjoy them!

BITCOIN BULLS WILL DOMINATE THE MARKET|LONG
BITCOIN SIGNAL
Trade Direction: long
Entry Level: 104,686.94
Target Level: 111,091.02
Stop Loss: 100,407.14
RISK PROFILE
Risk level: medium
Suggested risk: 1%
Timeframe: 9h
Disclosure: I am part of Trade Nation's Influencer program and receive a monthly fee for using their TradingView charts in my analysis.
✅LIKE AND COMMENT MY IDEAS✅

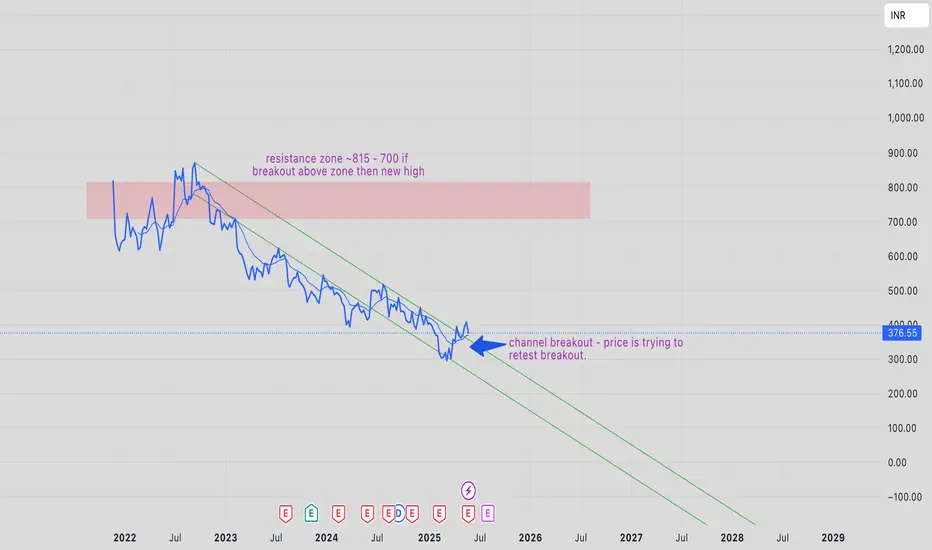
High chance of complete reversal of TARSONS-EQ.TARSONS-EQ was trading in down channel. recently price has given a breakout of that channel and is currently retesting the breakout zone.
the targets are be easily identified using fib tool. the immediate target is ~500 - 515 with high chance of complete reversal and a new high in next 1-2 years
as always trade as per your risk capacity.
CRV (HTF trigger zone) — Eyes on Sweep and MSBLSE:CRV has swept into a major bullish OB cluster, entering a high time frame sweep zone where potential reversals often occur. This area aligns with previous equal lows (EQL) and liquidity pockets, creating the conditions for a HTF long setup — but only with confirmation.
Setup:
🟩 Sweep Zone: $0.64–0.68
This is the trigger area. Watch for a clean sweep and a bullish MSB on M15 or H1. If the sweep includes the EQL below, even better — deeper liquidity grab improves the setup quality.
❗ Entry only on confirmation:
• Strong candle close above
• MSB on intraday chart
• Clear reversal pattern
📌 No knife-catching — let the pattern form and confirm.
🎯 Targeting eventual reclaim of mid-range and possible revisit of $0.75–0.80 if bounce holds.

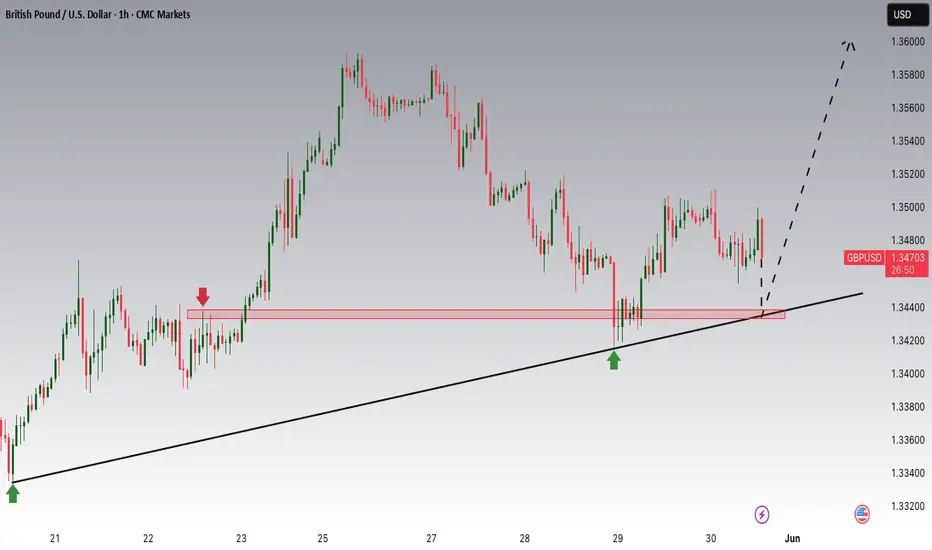
GBPUSD is Nearing an Important Support!!Hey Traders, in today's trading session we are monitoring GBPUSD for a buying opportunity around 1.34400 zone, GBPUSD is trading in an uptrend and currently is in a correction phase in which it is approaching the trend at 1.34400 support and resistance area.
Trade safe, Joe.
Gold Strong Pullbacks But Long Term Image Still Bullish!!!Hey Traders, in today's trading session we are monitoring XAUUSD for a buying opportunity around 3,200 zone, Gold is trading in an uptrend and currently is in a correction phase in which it is approaching the trend at 3,200 support and resistance area.
Trade safe, Joe.

AUDCAD On The Rise! BUY!
My dear followers,
I analysed this chart on AUDCAD and concluded the following:
The market is trading on 0.8864 pivot level.
Bias - Bullish
Technical Indicators: Both Super Trend & Pivot HL indicate a highly probable Bullish continuation.
Target - 0.8903
Safe Stop Loss - 0.8843
About Used Indicators:
A super-trend indicator is plotted on either above or below the closing price to signal a buy or sell. The indicator changes color, based on whether or not you should be buying. If the super-trend indicator moves below the closing price, the indicator turns green, and it signals an entry point or points to buy.
Disclosure: I am part of Trade Nation's Influencer program and receive a monthly fee for using their TradingView charts in my analysis.
———————————
WISH YOU ALL LUCK

AUDNZD: Long Signal with Entry/SL/TP
AUDNZD
- Classic bullish formation
- Our team expects pullback
SUGGESTED TRADE:
Swing Trade
Long AUDNZD
Entry - 1.0769
Sl - 1.0744
Tp - 1.0819
Our Risk - 1%
Start protection of your profits from lower levels
Disclosure: I am part of Trade Nation's Influencer program and receive a monthly fee for using their TradingView charts in my analysis.
❤️ Please, support our work with like & comment! ❤️

GBPCHF: Bullish Continuation is Expected! Here is Why:
It is essential that we apply multitimeframe technical analysis and there is no better example of why that is the case than the current GBPCHF chart which, if analyzed properly, clearly points in the upward direction.
Disclosure: I am part of Trade Nation's Influencer program and receive a monthly fee for using their TradingView charts in my analysis.
❤️ Please, support our work with like & comment! ❤️
