AUDUSD Will Explode! BUY!
My dear followers,
I analysed this chart on AUDUSD and concluded the following:
The market is trading on 0.6420 pivot level.
Bias - Bullish
Technical Indicators: Both Super Trend & Pivot HL indicate a highly probable Bullish continuation.
Target - 0.6455
About Used Indicators:
A super-trend indicator is plotted on either above or below the closing price to signal a buy or sell. The indicator changes color, based on whether or not you should be buying. If the super-trend indicator moves below the closing price, the indicator turns green, and it signals an entry point or points to buy.
Disclosure: I am part of Trade Nation's Influencer program and receive a monthly fee for using their TradingView charts in my analysis.
———————————
WISH YOU ALL LUCK
Long!!!!

NZDUSD Trading Opportunity! BUY!
My dear friends,
NZDUSD looks like it will make a good move, and here are the details:
The market is trading on 0.5954 pivot level.
Bias - Bullish
Technical Indicators: Supper Trend generates a clear long signal while Pivot Point HL is currently determining the overall Bullish trend of the market.
Goal - 0.5969
About Used Indicators:
Pivot points are a great way to identify areas of support and resistance, but they work best when combined with other kinds of technical analysis
Disclosure: I am part of Trade Nation's Influencer program and receive a monthly fee for using their TradingView charts in my analysis.
———————————
WISH YOU ALL LUCK

GOLD What Next? BUY!
My dear friends,
GOLD looks like it will make a good move, and here are the details:
The market is trading on 3293.8 pivot level.
Bias - Bullish
Technical Indicators: Supper Trend generates a clear long signal while Pivot Point HL is currently determining the overall Bullish trend of the market.
Goal - 3307.5
Recommended Stop Loss - 3287.2
About Used Indicators:
Pivot points are a great way to identify areas of support and resistance, but they work best when combined with other kinds of technical analysis
Disclosure: I am part of Trade Nation's Influencer program and receive a monthly fee for using their TradingView charts in my analysis.
———————————
WISH YOU ALL LUCK

GOLD Will Go Up! Long!
Take a look at our analysis for GOLD.
Time Frame: 15m
Current Trend: Bullish
Sentiment: Oversold (based on 7-period RSI)
Forecast: Bullish
The market is on a crucial zone of demand 3,295.78.
The oversold market condition in a combination with key structure gives us a relatively strong bullish signal with goal 3,310.58 level.
P.S
We determine oversold/overbought condition with RSI indicator.
When it drops below 30 - the market is considered to be oversold.
When it bounces above 70 - the market is considered to be overbought.
Disclosure: I am part of Trade Nation's Influencer program and receive a monthly fee for using their TradingView charts in my analysis.
Like and subscribe and comment my ideas if you enjoy them!

GBPJPY Is Very Bullish! Buy!
Take a look at our analysis for GBPJPY.
Time Frame: 4h
Current Trend: Bullish
Sentiment: Oversold (based on 7-period RSI)
Forecast: Bullish
The market is testing a major horizontal structure 193.933.
Taking into consideration the structure & trend analysis, I believe that the market will reach 195.006 level soon.
P.S
The term oversold refers to a condition where an asset has traded lower in price and has the potential for a price bounce.
Overbought refers to market scenarios where the instrument is traded considerably higher than its fair value. Overvaluation is caused by market sentiments when there is positive news.
Disclosure: I am part of Trade Nation's Influencer program and receive a monthly fee for using their TradingView charts in my analysis.
Like and subscribe and comment my ideas if you enjoy them!

HelenP. I Bitcoin can start to grow from support zone in rangeHi folks today I'm prepared for you Bitcoin analytics. Observing this chart, we can see how the price rebounded from the support zone, which coincided with support level 2, and fell to the trend line. After this moment, BTC started to grow near this line and soon broke support 2. Then it made a correction below the trend line, but soon turned back and continued to grow. Later, Bitcoin reached support 1, which coincided with the support zone too and then some time traded in this area. Price traded between the support area and the trend line, and later finally broke support 1 and entered into a consolidation. In this pattern, BTC rose to the top part of the range and then made a correction to the trend line at once. Soon, Bitcoin broke this line and continued to fall, and at the moment it traded near support 1, which is the bottom part of the consolidation as well. So, I expect that BTCUSDT will correct to the support area and then start to grow. For this case, I set my goal at 109000 points. If you like my analytics you may support me with your like/comment ❤️

NZD/CHF LONG FROM SUPPORT
Hello, Friends!
The BB lower band is nearby so NZD-CHF is in the oversold territory. Thus, despite the downtrend on the 1W timeframe I think that we will see a bullish reaction from the support line below and a move up towards the target at around 0.495.
Disclosure: I am part of Trade Nation's Influencer program and receive a monthly fee for using their TradingView charts in my analysis.
✅LIKE AND COMMENT MY IDEAS✅

USD/JPY BEST PLACE TO BUY FROM|LONG
USD/JPY SIGNAL
Trade Direction: long
Entry Level: 143.655
Target Level: 145.800
Stop Loss: 142.221
RISK PROFILE
Risk level: medium
Suggested risk: 1%
Timeframe: 3h
Disclosure: I am part of Trade Nation's Influencer program and receive a monthly fee for using their TradingView charts in my analysis.
✅LIKE AND COMMENT MY IDEAS✅

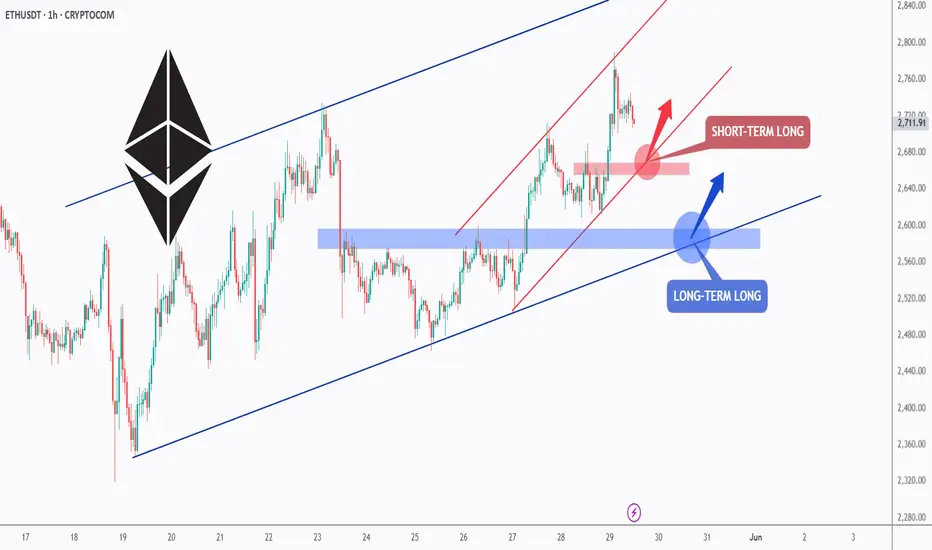
ETH - Long Anyway, Short-term and Long-term!Hello TradingView Family / Fellow Traders. This is Richard, also known as theSignalyst.
📈ETH has been overall bullish trading within the rising blue channel from a long-term perspective and within the rising red channel from a short-term perspective.
Moreover, the red and blue zones are strong support and structure!
🏹 Thus, the highlighted blue and red circles are strong areas to look for buy setups as it is the intersection of the lower zone(s) and trendline(s).
📚 As per my trading style:
As #ETH approaches one of the circles, I will be looking for bullish reversal setups (like a double bottom pattern, trendline break , and so on...)
📚 Always follow your trading plan regarding entry, risk management, and trade management.
Good luck!
All Strategies Are Good; If Managed Properly!
~Rich
USDCHF Technical Analysis! BUY!
My dear subscribers,
My technical analysis for USDCHF is below:
The price is coiling around a solid key level - 0.8202
Bias - Bullish
Technical Indicators: Pivot Points Low anticipates a potential price reversal.
Super trend shows a clear buy, giving a perfect indicators' convergence.
Goal - 0.8285
My Stop Loss - 0.8166
About Used Indicators:
By the very nature of the supertrend indicator, it offers firm support and resistance levels for traders to enter and exit trades. Additionally, it also provides signals for setting stop losses
Disclosure: I am part of Trade Nation's Influencer program and receive a monthly fee for using their TradingView charts in my analysis.
———————————
WISH YOU ALL LUCK

4hr break and retestgoing long here, price action is nice and simple
i am aiming for a 50 percent retracement to or close to the gerneral price action where it has previously broke out
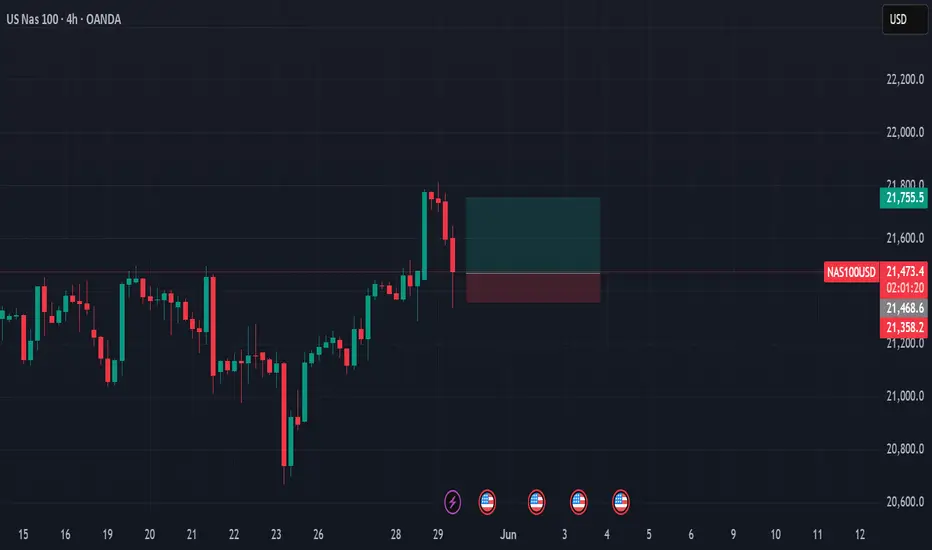
Ethereum is Approaching a Key Support!Hey Traders, in today's trading session we are monitoring ETH/USDT for a buying opportunity around 2,650 zone, Ethereum is trading in an uptrend and currently is in a correction phase in which it is approaching the trend at 2,650 support and resistance area.
Trade safe, Joe.

BTC - Let's Do It Again!!Hello TradingView Family / Fellow Traders. This is Richard, also known as theSignalyst.
📈 As per our last analysis (attached on the chart), BTC rejected the lower orange trendline and moved higher as expected! ✅
🔄 BTC is now retesting the lower trendline again, so we’ll be looking for new trend-following buy setups as long as the red structure at $105,000 holds!
📚 Always follow your trading plan regarding entry, risk management, and trade management.
Good luck!
All Strategies Are Good; If Managed Properly!
~Rich

Bitcoin will fall to support line of channel and then rebound upHello traders, I want share with you my opinion about Bitcoin. Bitcoin spent a considerable period trading within a horizontal range, bounded by the buyer zone around 92000 - 93000 points and the upper boundary just below 103000 points. Throughout this phase, the price respected both limits, bouncing between support and resistance, forming a stable consolidation base. Eventually, BTC broke out of this range with a strong bullish impulse, entering a clearly defined upward channel. Since then, price action has been guided by the structure of this rising channel, consistently forming higher highs and lows. Multiple clean retests of the support line confirm the integrity of the trend, and recent movement shows BTC pulling back from mid-channel after a short-term correction. Now the price is approaching the support area between 102000 - 103000, which aligns with the channel’s lower boundary. Given the pattern’s consistency and strength in previous rebounds, I think BTC can correct to the support line and continue to grow. For this case, I set my TP at 113000 points, near the resistance of the upward channel. Please share this idea with your friends and click Boost 🚀

GOLD Is Going Up! Buy!
Take a look at our analysis for GOLD.
Time Frame: 1h
Current Trend: Bullish
Sentiment: Oversold (based on 7-period RSI)
Forecast: Bullish
The market is testing a major horizontal structure 3,301.19.
Taking into consideration the structure & trend analysis, I believe that the market will reach 3,325.39 level soon.
P.S
We determine oversold/overbought condition with RSI indicator.
When it drops below 30 - the market is considered to be oversold.
When it bounces above 70 - the market is considered to be overbought.
Disclosure: I am part of Trade Nation's Influencer program and receive a monthly fee for using their TradingView charts in my analysis.
Like and subscribe and comment my ideas if you enjoy them!

GOLD: Bullish Continuation & Long Signal
GOLD
- Classic bullish pattern
- Our team expects retracement
SUGGESTED TRADE:
Swing Trade
Buy GOLD
Entry - 3282.5
Stop - 3274.1
Take - 3298.4
Our Risk - 1%
Start protection of your profits from lower levels
Disclosure: I am part of Trade Nation's Influencer program and receive a monthly fee for using their TradingView charts in my analysis.
❤️ Please, support our work with like & comment! ❤️

EURUSD My Opinion! BUY!
My dear friends,
Please, find my technical outlook for EURUSD below:
The price is coiling around a solid key level - 1.1282
Bias - Bullish
Technical Indicators: Pivot Points Lowanticipates a potential price reversal.
Super trend shows a clear buy, giving a perfect indicators' convergence.
Goal - 1.1325
About Used Indicators:
The pivot point itself is simply the average of the high, low and closing prices from the previous trading day.
Disclosure: I am part of Trade Nation's Influencer program and receive a monthly fee for using their TradingView charts in my analysis.
———————————
WISH YOU ALL LUCK

Bitcoin is Nearing a Key Support Level!!!Hey Traders, in today's trading session we are monitoring BTCUSDT for a buying opportunity around 107,000 zone, Bitcoin is trading in an uptrend and currently is in a correction phase in which it is approaching the trend at 107,000 support and resistance area.
Trade safe, Joe.

EURNZD Set To Grow! BUY!
My dear subscribers,
EURNZD looks like it will make a good move, and here are the details:
The market is trading on 1.8983 pivot level.
Bias - Bullish
Technical Indicators: Both Super Trend & Pivot HL indicate a highly probable Bullish continuation.
Target - 1.9022
About Used Indicators:
The average true range (ATR) plays an important role in 'Supertrend' as the indicator uses ATR to calculate its value. The ATR indicator signals the degree of price volatility.
Disclosure: I am part of Trade Nation's Influencer program and receive a monthly fee for using their TradingView charts in my analysis.
———————————
WISH YOU ALL LUCK

GOLD Will Explode! BUY!
My dear subscribers,
GOL looks like it will make a good move, and here are the details:
The market is trading on 3313.4 pivot level.
Bias - Bullish
My Stop Loss - 3309.3
Technical Indicators: Both Super Trend & Pivot HL indicate a highly probable Bullish continuation.
Target - 3321.4
About Used Indicators:
The average true range (ATR) plays an important role in 'Supertrend' as the indicator uses ATR to calculate its value. The ATR indicator signals the degree of price volatility.
Disclosure: I am part of Trade Nation's Influencer program and receive a monthly fee for using their TradingView charts in my analysis.
———————————
WISH YOU ALL LUCK

GBPAUD Is Bullish! Buy!
Please, check our technical outlook for GBPAUD.
Time Frame: 1D
Current Trend: Bullish
Sentiment: Oversold (based on 7-period RSI)
Forecast: Bullish
The price is testing a key support 2.096.
Current market trend & oversold RSI makes me think that buyers will push the price. I will anticipate a bullish movement at least to 2.155 level.
P.S
Please, note that an oversold/overbought condition can last for a long time, and therefore being oversold/overbought doesn't mean a price rally will come soon, or at all.
Disclosure: I am part of Trade Nation's Influencer program and receive a monthly fee for using their TradingView charts in my analysis.
Like and subscribe and comment my ideas if you enjoy them!

GBPNZD Is Very Bullish! Long!
Here is our detailed technical review for GBPNZD.
Time Frame: 1D
Current Trend: Bullish
Sentiment: Oversold (based on 7-period RSI)
Forecast: Bullish
The market is trading around a solid horizontal structure 2.262.
The above observations make me that the market will inevitably achieve 2.298 level.
P.S
The term oversold refers to a condition where an asset has traded lower in price and has the potential for a price bounce.
Overbought refers to market scenarios where the instrument is traded considerably higher than its fair value. Overvaluation is caused by market sentiments when there is positive news.
Disclosure: I am part of Trade Nation's Influencer program and receive a monthly fee for using their TradingView charts in my analysis.
Like and subscribe and comment my ideas if you enjoy them!

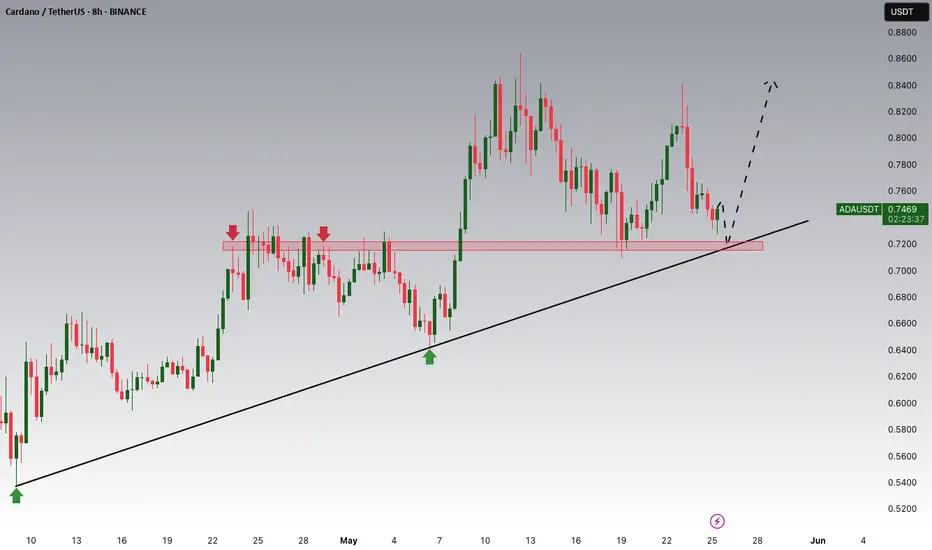
Cardano Potential UpsidesHey Traders, in today's trading session we are monitoring ADA/USDT for a buying opportunity around 0.7200 zone, Cardano is trading in an uptrend and currently is in a correction phase in which it is approaching the trend at 0.72000 support and resistance area.
Trade safe, Joe.