NZDJPY Potential UpsidesHey Traders, in today's trading session we are monitoring NZDJPY for a buying opportunity around 87.350 zone, NZDJPY is trading in an uptrend and currently is in a correction phase in which it is approaching the trend at 87.350 support and resistance area.
Trade safe, Joe.
Long!!!!

HelenP. I Gold may bounce from trend line to resistance levelHi folks today I'm prepared for you Gold analytics. After observing this chart, I see that the price tried to grow to the resistance level first, but failed and dropped to the support level, which coincided with the buyer support zone. After this correction movement, XAU rebounded up and then dropped below the support level, breaking it. But soon, price turned around and made impulse up, breaking the 3265 level, after which it continued to move up to the resistance level. When Gold reached this level, it entered to resistance zone, where it turned around at once and made a strong movement down to the trend line, breaking two levels. Also then it started to trades inside a triangle, and soon turned around from the trend line and made a strong impulse up. Price broke the 3265 support level one more time, rose a little more, and then made a correction. After this, price continued to move up and soon reached the 3395 resistance level, after which it turned around and fell to the trend line, which is the support line of the triangle as well. Recently, it started to grow, so I expect that XAUUS will correct to the trend line and then continue to move up to the resistance level. That's why the 3395 resistance level is my current goal. If you like my analytics you may support me with your like/comment ❤️
Disclaimer: As part of ThinkMarkets’ Influencer Program, I am sponsored to share and publish their charts in my analysis.

Bitcoin will rise from support level and exit from wedgeHello traders, I want share with you my opinion about Bitcoin. This chart shows how the price rebounded from the current support level and then turned around and rebounded up. Price broke the 109000 level, coinciding with a support area, and then traded near this level for some time. Later price turned around and started to decline inside a downward channel, where it soon broke the 109000 level, reached the resistance line, and continued to fall next. Bitcoin fell to the support line of the channel, which coincided with the 103000 support level and buyer zone, after which it rebounded up. Then BTC exited from channel and later entered to upward wedge, where it at once made a correction movement from the resistance line to the support line, breaking the 103000 level. But soon, price made an impulse up, breaking the support level one more time. Next, it rose to the current support level, broke it too, and now trades inside the support area. In my mind, BTC can rebound from the support level and rise to the resistance line of the wedge. Then it can break this line, thereby exiting from the wedge and continuing to move up; therefore, I set my TP at 112000 points. Please share this idea with your friends and click Boost 🚀

GBPAUD: Bullish Forecast & Outlook
The price of GBPAUD will most likely increase soon enough, due to the demand beginning to exceed supply which we can see by looking at the chart of the pair.
Disclosure: I am part of Trade Nation's Influencer program and receive a monthly fee for using their TradingView charts in my analysis.
❤️ Please, support our work with like & comment! ❤️

TESLA Technical Analysis! BUY!
My dear subscribers,
My technical analysis for TESLA is below:
The price is coiling around a solid key level - 295.19
Bias - Bullish
Technical Indicators: Pivot Points Low anticipates a potential price reversal.
Super trend shows a clear buy, giving a perfect indicators' convergence.
Goal - 323.17
About Used Indicators:
By the very nature of the supertrend indicator, it offers firm support and resistance levels for traders to enter and exit trades. Additionally, it also provides signals for setting stop losses
Disclosure: I am part of Trade Nation's Influencer program and receive a monthly fee for using their TradingView charts in my analysis.
———————————
WISH YOU ALL LUCK

GBPAUD: Bullish Continuation & Long Trade
GBPAUD
- Classic bullish setup
- Our team expects bullish continuation
SUGGESTED TRADE:
Swing Trade
Long GBPAUD
Entry Point - 2.0740
Stop Loss - 2.0699
Take Profit - 2.0833
Our Risk - 1%
Start protection of your profits from lower levels
Disclosure: I am part of Trade Nation's Influencer program and receive a monthly fee for using their TradingView charts in my analysis.
❤️ Please, support our work with like & comment! ❤️

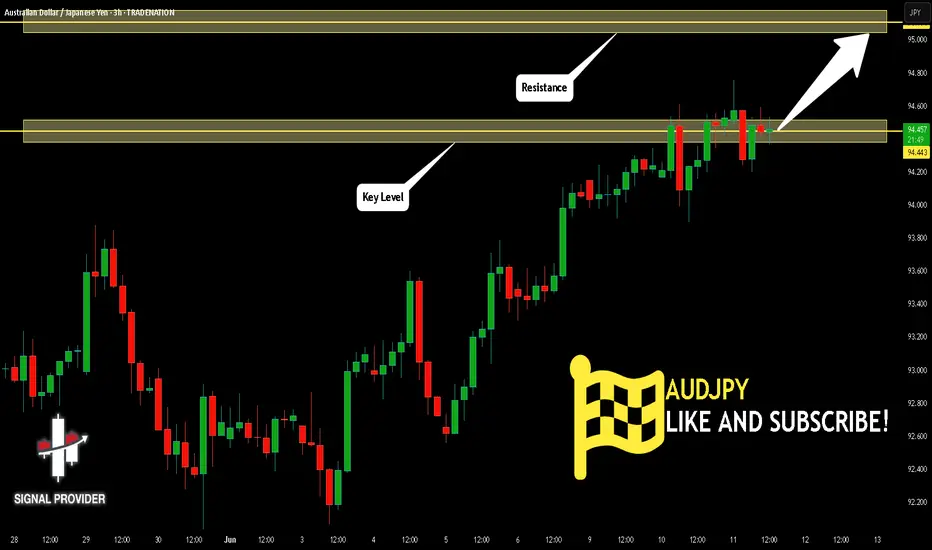
AUDJPY Is Bullish! Long!
Here is our detailed technical review for AUDJPY.
Time Frame: 3h
Current Trend: Bullish
Sentiment: Oversold (based on 7-period RSI)
Forecast: Bullish
The market is trading around a solid horizontal structure 94.443.
The above observations make me that the market will inevitably achieve 95.104 level.
P.S
We determine oversold/overbought condition with RSI indicator.
When it drops below 30 - the market is considered to be oversold.
When it bounces above 70 - the market is considered to be overbought.
Disclosure: I am part of Trade Nation's Influencer program and receive a monthly fee for using their TradingView charts in my analysis.
Like and subscribe and comment my ideas if you enjoy them!
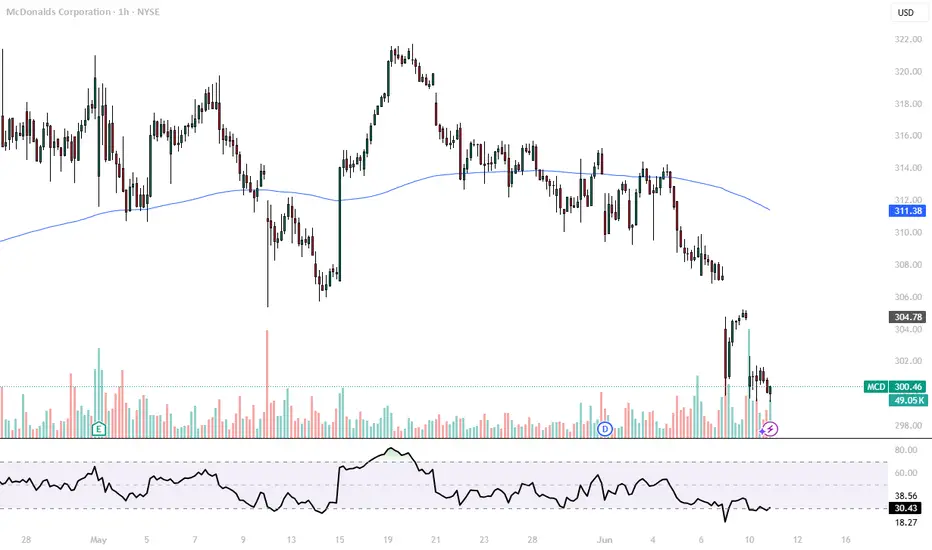
McDonald 1H Long PositionMy self-built strategy has sent me a signal for a long position. I bought a tranche of NYSE:MCD long and will be targeting the upper gaps as my profit targets. The first station will be around $306, and the second target lies between $318 and $319. Currently, the 1H chart is forming a nice divergence and had a huge volume spike, and my strategy indicates a high probability setup for this chart.
Given the current market volatility, I’ll be keeping a close eye on my open position to be able to react quickly if needed.
ETH - Finally Support!Hello TradingView Family / Fellow Traders. This is Richard, also known as theSignalyst.
📈ETH has been overall bullish trading within the flat rising channels marked in blue.
Moreover, the green zone is a strong support zone!
🏹 Thus, the highlighted blue circle is a strong area to look for buy setups as it is the intersection of support and lower blue trendlines acting as non-horizontal support.
📚 As per my trading style:
As #ETH approaches the blue circle zone, I will be looking for bullish reversal setups (like a double bottom pattern, trendline break , and so on...)
📚 Always follow your trading plan regarding entry, risk management, and trade management.
Good luck!
All Strategies Are Good; If Managed Properly!
~Rich

Get ready for the Breakout on GOLD!"you know how looong i been waiting for dis?!" *Gambit Voice*
Been waiting for this set up to happen and its slowly showing that its ready to break out and go for new Highs. just trying to be patient and ready for it.

Live trade 06/10/2025Here is what one of my strategy traded today. I have 5 trading strategies in NQ and ES.
Today's trade was made based on the NQ DVD strategy where I look at the cumulative daily volume, an indicator that I developed. The Cumulative daily volume is calculated based on the direction of each candle and it resets on daily basis. For more info, please see my channel.
For this specific trade, the both TP and SL are calculated based on a coefficient of ATR. If none of them are met, then I close the trade by 16PM EST.

GBPCAD Massive Long! BUY!
My dear subscribers,
GBPCAD looks like it will make a good move, and here are the details:
The market is trading on 1.8497 pivot level.
Bias - Bullish
My Stop Loss - 1.8456
Technical Indicators: Both Super Trend & Pivot HL indicate a highly probable Bullish continuation.
Target - 1.8577
About Used Indicators:
The average true range (ATR) plays an important role in 'Supertrend' as the indicator uses ATR to calculate its value. The ATR indicator signals the degree of price volatility.
Disclosure: I am part of Trade Nation's Influencer program and receive a monthly fee for using their TradingView charts in my analysis.
———————————
WISH YOU ALL LUCK

NZDUSD Potential UpsidesHey Traders, in today's trading session we are monitoring NZDUSD for a buying opportunity around 0.60350 zone, NZDUSD is trading in an uptrend and currently is in a correction phase in which it is approaching the trend at 0.60350 support and resistance area.
Trade safe, Joe.

EURO - Price will strart to grow and exit from wedge patternHi guys, this is my overview for EURUSD, feel free to check it and write your feedback in comments👊
Price entered to wedge pattern and at once dropped below $1.1455 level, breaking it and then some time traded below.
It continued to decline and in a short time reached $1.1220 level and broke it, after which fell to support line.
Then price started to grow and soon broke $1.1220 level one more time, after which made a retest and continued to grow.
Euro rose to $1.1420 points and then corrected to support level, after which turned around and rose to resistance level.
Recently price reached resistance level, but then it bounced and started to decline, and now it continues to fall.
I think that Euro can decline a little more and then bounce up to $1.1550, exiting from wedge.
If this post is useful to you, you can support me with like/boost and advice in comments❤️
Disclaimer: As part of ThinkMarkets’ Influencer Program, I am sponsored to share and publish their charts in my analysis.

GBP/CAD BULLISH BIAS RIGHT NOW| LONG
Hello, Friends!
GBP/CAD pair is trading in a local uptrend which know by looking at the previous 1W candle which is green. On the 1H timeframe the pair is going down. The pair is oversold because the price is close to the lower band of the BB indicator. So we are looking to buy the pair with the lower BB line acting as support. The next target is 1.853 area.
Disclosure: I am part of Trade Nation's Influencer program and receive a monthly fee for using their TradingView charts in my analysis.
✅LIKE AND COMMENT MY IDEAS✅

BITCOIN BULLS ARE GAINING STRENGTH|LONG
BITCOIN SIGNAL
Trade Direction: long
Entry Level: 103,835.09
Target Level: 109,309.96
Stop Loss: 100,185.18
RISK PROFILE
Risk level: medium
Suggested risk: 1%
Timeframe: 9h
Disclosure: I am part of Trade Nation's Influencer program and receive a monthly fee for using their TradingView charts in my analysis.
✅LIKE AND COMMENT MY IDEAS✅

USDJPY Is Going Up! Long!
Here is our detailed technical review for USDJPY.
Time Frame: 2h
Current Trend: Bullish
Sentiment: Oversold (based on 7-period RSI)
Forecast: Bullish
The market is approaching a significant support area 144.671.
The underlined horizontal cluster clearly indicates a highly probable bullish movement with target 145.501 level.
P.S
The term oversold refers to a condition where an asset has traded lower in price and has the potential for a price bounce.
Overbought refers to market scenarios where the instrument is traded considerably higher than its fair value. Overvaluation is caused by market sentiments when there is positive news.
Disclosure: I am part of Trade Nation's Influencer program and receive a monthly fee for using their TradingView charts in my analysis.
Like and subscribe and comment my ideas if you enjoy them!

sand buy spot "🌟 Welcome to Golden Candle! 🌟
We're a team of 📈 passionate traders 📉 who love sharing our 🔍 technical analysis insights 🔎 with the TradingView community. 🌎
Our goal is to provide 💡 valuable perspectives 💡 on market trends and patterns, but 🚫 please note that our analyses are not intended as buy or sell recommendations. 🚫
Instead, they reflect our own 💭 personal attitudes and thoughts. 💭
Follow along and 📚 learn 📚 from our analyses! 📊💡"

Bitcoin - Showing strength as it breaks key resistance levels!Bitcoin (BTC) recently demonstrated impressive strength by bouncing off a well-known confluence zone consisting of the golden pocket and a 4-hour fair value gap (FVG) around the $100,000 level. This technical area has historically acted as a reliable support and once again proved its significance, offering a solid foundation for the current rally.
Following this bounce, BTC surged to $108,000, decisively breaking above the 4-hour FVG near $107,000. With this breakout, the previously resistant zone is now expected to flip into support, adding further confidence to the bullish outlook. This type of price action is often seen in strong uptrends, where key resistance levels are reclaimed and converted into support, providing a base for further upside.
Importantly, BTC has also managed to push through the golden pocket resistance, a critical Fibonacci retracement area closely watched by traders. This breakout, in conjunction with the 4H FVG clearance, clears the path for a potential continuation toward Bitcoin’s all-time high.
Momentum is clearly building. Buying pressure is strong, and retracements have been shallow, indicating a market dominated by demand. While this is a bullish sign, a brief pullback or bounce off the newly formed support (the 4H FVG zone) would be healthy. Such a move would allow BTC to consolidate and build strength before potentially pushing toward new highs.
Overall, the technical landscape looks increasingly favorable for BTC. As long as it holds above the reclaimed support zones, the path to retesting, and possibly surpassing, the all-time high appears wide open.
Thanks for your support.
- Make sure to follow me so you don't miss out on the next analysis!
- Drop a like and leave a comment!


AUDJPY Potential UpsidesHey Traders, in today's trading session we are monitoring AUDJPY for a buying opportunity around 94.000 zone, AUDJPY is trading in an uptrend and currently is in a correction phase in which it is approaching the trend at 94.000 support and resistance area.
Trade safe, Joe.

EURNZD: Long Signal Explained
EURNZD
- Classic bullish formation
- Our team expects growth
SUGGESTED TRADE:
Swing Trade
Buy EURNZD
Entry Level - 1.8863
Sl - 1.8820
Tp - 1.8953
Our Risk - 1%
Start protection of your profits from lower levels
Disclosure: I am part of Trade Nation's Influencer program and receive a monthly fee for using their TradingView charts in my analysis.
❤️ Please, support our work with like & comment! ❤️

EURUSD Expected Growth! BUY!
My dear followers,
I analysed this chart on EURUSD and concluded the following:
The market is trading on 1.1395 pivot level.
Bias - Bullish
Technical Indicators: Both Super Trend & Pivot HL indicate a highly probable Bullish continuation.
Target - 1.1419
About Used Indicators:
A super-trend indicator is plotted on either above or below the closing price to signal a buy or sell. The indicator changes color, based on whether or not you should be buying. If the super-trend indicator moves below the closing price, the indicator turns green, and it signals an entry point or points to buy.
Disclosure: I am part of Trade Nation's Influencer program and receive a monthly fee for using their TradingView charts in my analysis.
———————————
WISH YOU ALL LUCK

EURAUD: Expecting Bullish Continuation! Here is Why
The charts are full of distraction, disturbance and are a graveyard of fear and greed which shall not cloud our judgement on the current state of affairs in the EURAUD pair price action which suggests a high likelihood of a coming move up.
Disclosure: I am part of Trade Nation's Influencer program and receive a monthly fee for using their TradingView charts in my analysis.
❤️ Please, support our work with like & comment! ❤️
