EIGEN Eyes Key Demand — Watching $1 for a Potential BounceScenario 1 (Reversal from Demand):
Wait for lower timeframe (M15/H1) reversal signal in $0.98–$1.16 zone
If confirmed, consider long entries with tight risk below $0.98
First target: $1.40–$1.55 (local supply); next: $2.15
Scenario 2 (Breakdown):
If price loses $0.98 with no reaction, step aside — next strong support much lower
No interest in longs if green zone fails
Long!!!!

BTCUSD Massive Long! BUY!
My dear subscribers,
BTCUSD looks like it will make a good move, and here are the details:
The market is trading on 99659 pivot level.
Bias - Bullish
My Stop Loss - 97824
Technical Indicators: Both Super Trend & Pivot HL indicate a highly probable Bullish continuation.
Target - 10315
About Used Indicators:
The average true range (ATR) plays an important role in 'Supertrend' as the indicator uses ATR to calculate its value. The ATR indicator signals the degree of price volatility.
Disclosure: I am part of Trade Nation's Influencer program and receive a monthly fee for using their TradingView charts in my analysis.
———————————
WISH YOU ALL LUCK

GOLD My Opinion! BUY!
My dear followers,
I analysed this chart on GOLD and concluded the following:
The market is trading on 3313.7 pivot level.
Bias - Bullish
Technical Indicators: Both Super Trend & Pivot HL indicate a highly probable Bullish continuation.
Target - 3321.8
Safe Stop Loss - 3309.7
About Used Indicators:
A super-trend indicator is plotted on either above or below the closing price to signal a buy or sell. The indicator changes color, based on whether or not you should be buying. If the super-trend indicator moves below the closing price, the indicator turns green, and it signals an entry point or points to buy.
Disclosure: I am part of Trade Nation's Influencer program and receive a monthly fee for using their TradingView charts in my analysis.
———————————
WISH YOU ALL LUCK

Buying the Dip or Catching a Knife? My Gold Setup Explained.Entered a long position on XAU/USD from the 1H demand zone following sharp intraday selling into a key support level. With gold hovering near $3,300 and a significant testimony from Fed Chair Powell on deck, the setup aligns with both technical rebound potential and fundamental uncertainty that could fuel upside.
The goal here is to play the liquidity vacuum left after aggressive positioning was cleared, with tight invalidation and asymmetric reward.
Technicals:
• Entry aligned with prior price inefficiency and confluence of multiple demand zones
• 1H structure shows clear deviation below the range with immediate buy-side response
• EMA channel flattening, indicating potential compression ahead of expansion
• First target: $3,352
• Risk-managed with defined stop-loss below $3,260
Execution Note: This is not a “hold forever” trade. It’s an opportunistic reaction to unwind + sentiment imbalance.
Fundamentals
• Gold saw a 25% surge in 2024 due to safe-haven demand and dovish policy, but enters 2025 under pressure from:
▫️ A strong USD
▫️ Higher cost of carry
▫️ Speculators taking profit
• Fed policy remains the core variable:
▫️ A hawkish tone from Powell could weigh on price
▫️ Rate cuts would likely revive bullish momentum
• Central bank demand remains supportive
• Geopolitical tensions (Russia-Ukraine, Israel-Iran) could trigger safe-haven bids again.
Bearish headwinds:
• Waning bullish momentum per RSI divergence
• Reduced rate cut expectations post-election
• Powell’s testimony could revive volatility either way.
This is a short-term tactical long, not a macro bet. With sentiment temporarily overextended and key support defended intraday, this is a high R/R window to exploit Powell-related volatility.
Let’s see how price reacts into $3,350+. Any sustained strength there would open room toward $3,400, while failure would confirm a retest of $3,260s.
Note: Please remember to adjust this trade idea according to your individual trading conditions, including position size, broker-specific price variations, and any relevant external factors. Every trader’s situation is unique, so it’s crucial to tailor your approach to your own risk tolerance and market environment.

US30 - ShortLooking for the Short on US30 final pull back before we see extension to the upside 45,000.

NC HAMMER CRYPTOOn my videos posted on another platform that starts with a Y. You can see once it breaks the wedge it typically has a bullish outcome. Good luck and have fun with it.

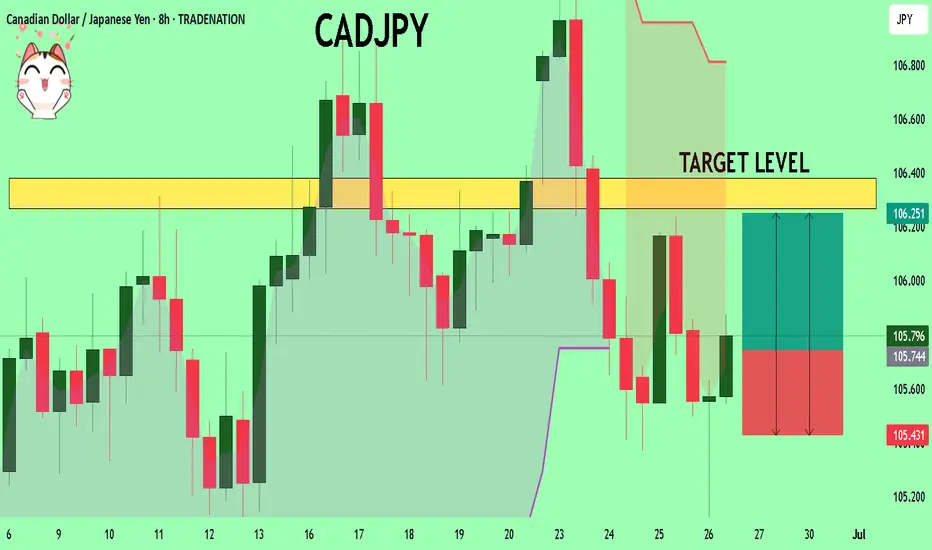
CADJPY What Next? BUY!
My dear friends,
Please, find my technical outlook for CADJPY below:
The instrument tests an important psychological level 105.74
Bias - Bullish
Technical Indicators: Supper Trend gives a precise Bullish signal, while Pivot Point HL predicts price changes and potential reversals in the market.
Target - 106.26
Recommended Stop Loss - 105.43
About Used Indicators:
Super-trend indicator is more useful in trending markets where there are clear uptrends and downtrends in price.
Disclosure: I am part of Trade Nation's Influencer program and receive a monthly fee for using their TradingView charts in my analysis.
———————————
WISH YOU ALL LUCK
ETHFI Key Reclaim Watch — Only Long Above $1.09 Confirmation✅ Price currently below major 1D S/R — no bullish bias yet
✅ Only looking for a long entry after confirmed reclaim of $1.09
✅ Structure remains bearish until then
Primary Scenario (Bullish):
Enter long only after confirmed reclaim/close above $1.09
Targets: Move to upper range ($2.76) on strength
Bearish/Flat Scenario:
If price fails to reclaim $1.09, no position — stay sidelined
🔔 Triggers & Confirmations:
Only long above $1.09 with confirmation (candle close, volume spike, or strong reclaim)
No trade below $1.09
🚨 Risk Warning:
Structure remains bearish below $1.09 — avoid bottom picking or forced trades

APU Spot Entry — Following Smart Money, Eyeing Meme Rotation✅ Entry based on smart money signal, positive meme sentiment
✅ Strong support at 0.0001548–0.0001553
✅ Upside targets: 0.00052, 0.00112, main at 0.00122
Active Plan:
Hold spot as long as 0.0001548 holds and meme rotation remains strong
Watch for reaction at support to add or manage risk
Monitor meme sector for continued momentum
Profit Targets:
Partial profit: 0.00052 / 0.00112
Main target: 0.00122
🚨 Risk Warning:
Close spot if support at 0.0001548 fails or meme trend weakens
Avoid averaging down below key support

SILVER Will Go Up! Buy!
Take a look at our analysis for SILVER.
Time Frame: 9h
Current Trend: Bullish
Sentiment: Oversold (based on 7-period RSI)
Forecast: Bullish
The market is on a crucial zone of demand 3,655.5.
The oversold market condition in a combination with key structure gives us a relatively strong bullish signal with goal 3,780.6 level.
P.S
We determine oversold/overbought condition with RSI indicator.
When it drops below 30 - the market is considered to be oversold.
When it bounces above 70 - the market is considered to be overbought.
Disclosure: I am part of Trade Nation's Influencer program and receive a monthly fee for using their TradingView charts in my analysis.
Like and subscribe and comment my ideas if you enjoy them!

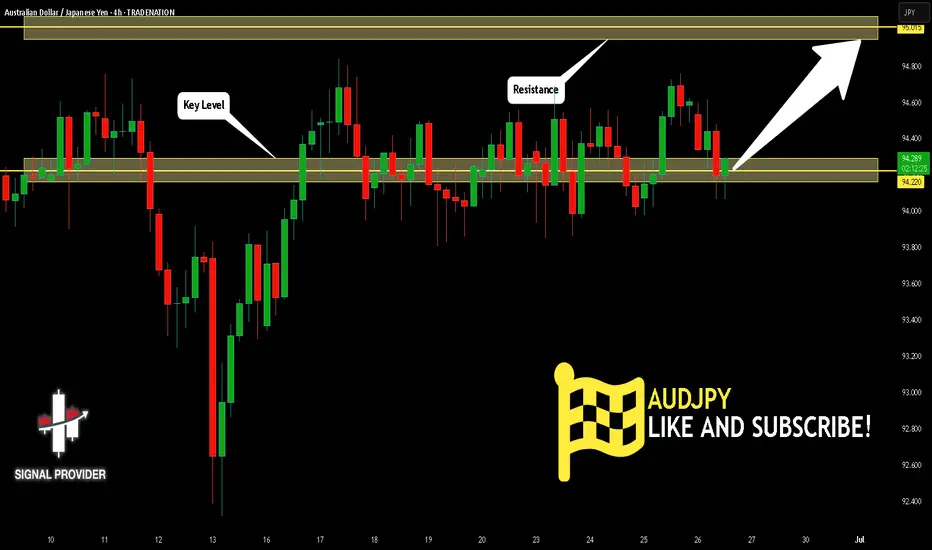
AUDJPY Is Bullish! Long!
Here is our detailed technical review for AUDJPY.
Time Frame: 4h
Current Trend: Bullish
Sentiment: Oversold (based on 7-period RSI)
Forecast: Bullish
The market is trading around a solid horizontal structure 94.220.
The above observations make me that the market will inevitably achieve 95.015 level.
P.S
Please, note that an oversold/overbought condition can last for a long time, and therefore being oversold/overbought doesn't mean a price rally will come soon, or at all.
Disclosure: I am part of Trade Nation's Influencer program and receive a monthly fee for using their TradingView charts in my analysis.
Like and subscribe and comment my ideas if you enjoy them!
SPX6900 Bidding 4H S/R + FVG Zone — Looking for New Highs✅ 4H S/R + FVG provides strong support and bid opportunity
✅ 200EMA adds further confluence to the setup
✅ Invalidation = 1h closes/consolidates below $1.14
Active Setup:
Long Entry: In $1.08–$1.14 zone (confirmation: reclaim or bullish trigger in area)
Target: $1.72 (new highs/ATH)
Manual Invalidation: Cut if 1h candles close and consolidate below $1.14
🔔 Triggers & Confirmations:
Only bid on strong reaction or reversal in FVG/S/R zone
Exit if 1h PA settles below $1.14 (red pattern bars area)
🚨 Risk Warning:
Aggressive longs — keep risk tight, cut quickly if invalidated

SUI Is Ready To Run!Good Morning Trading Fam,
I'm putting out a quick trade setup here on SUI, a coin I am honestly a long-term hodl'er of. I believe this coin has an exciting future ahead of it with tremendous potential to change the blockchain landscape for the better.
But this post is for those of you interested in trading it.
We have a perfect setup here. Descending bullish triangle, which we are nearing the end of. Strong long-time support underneath us. And my proprietary indicator has given us a buy signal at the point of confluence of both of the above. I have set three targets for you. Obviously, the higher the target, the higher the risk. Trade accordingly and let me know in the comments how you did. It makes me happy to know my followers are successful in their trades.
Best,
Stew

GBPCHF Will Go Higher From Support! Buy!
The market is on a crucial zone of demand 1.097.
The oversold market condition in a combination with key structure gives us a relatively strong bullish signal with goal 1.100 level.
P.S
Please, note that an oversold/overbought condition can last for a long time, and therefore being oversold/overbought doesn't mean a price rally will come soon, or at all.
Disclosure: I am part of Trade Nation's Influencer program and receive a monthly fee for using their TradingView charts in my analysis.
Like and subscribe and comment my ideas if you enjoy them!

CRV Range Reclaim — Eyes on $0.70 After Classic Deviation Setup🎯 BINANCE:CRVUSDT Trading Plan:
Active Range Setup:
Long Trigger: Deviation and reclaim below $0.5585
Target: $0.70 (mid/upper range)
Stops: Below most recent deviation
Alternative:
If $0.47–$0.50 is swept, look for LTF reversal signals for a new long entry
No Macro Shift:
Stay in range-trading mode until daily/weekly close above $0.76
🔔 Triggers & Confirmations:
Play the range: long on deviations and reclaims, take profit at range high or $0.70
Reassess for higher timeframes only after $0.70–$0.72 or $0.47–$0.50 is hit
🚨 Risk Warning:
Don’t chase mid-range — entries are only at extremes or after deviations

GBPUSD Breakout and Potential RetraceHey Traders, in today's trading session we are monitoring GBPUSD for a buying opportunity around 1.35900 zone, GBPUSD was trading in a downtrend and successfully managed to break it out. Currently is in a correction phase in which it is approaching the retrace area at 1.35900 support and resistance area.
Trade safe, Joe.

AUDUSD Sellers In Panic! BUY!
My dear followers,
This is my opinion on the AUDUSD next move:
The asset is approaching an important pivot point 0.6427
Bias - Bullish
Technical Indicators: Supper Trend generates a clear long signal while Pivot Point HL is currently determining the overall Bullish trend of the market.
Goal - 0.6462
About Used Indicators:
For more efficient signals, super-trend is used in combination with other indicators like Pivot Points.
Disclosure: I am part of Trade Nation's Influencer program and receive a monthly fee for using their TradingView charts in my analysis.
———————————
WISH YOU ALL LUCK

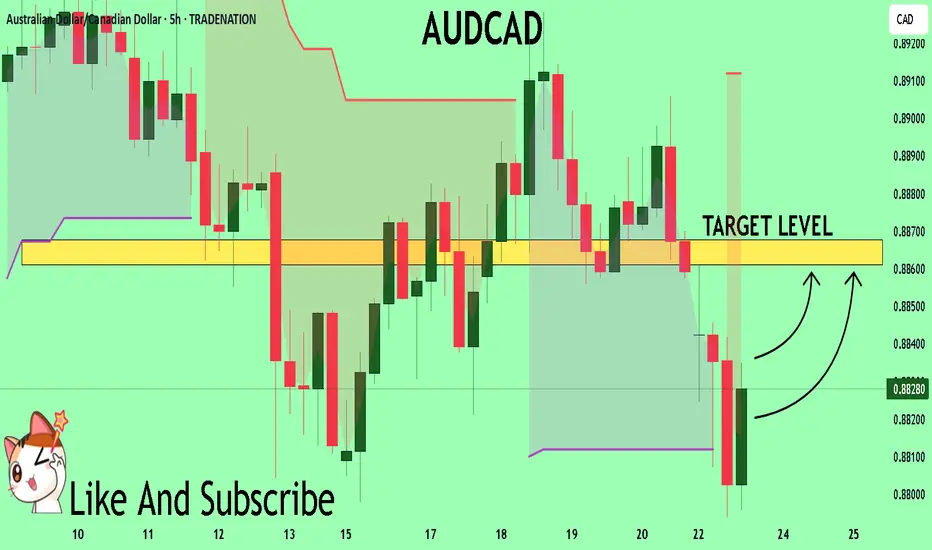
AUDCAD The Target Is UP! BUY!
My dear subscribers,
AUDCAD looks like it will make a good move, and here are the details:
The market is trading on 0.8830 pivot level.
Bias - Bullish
Technical Indicators: Both Super Trend & Pivot HL indicate a highly probable Bullish continuation.
Target - 0.8861
About Used Indicators:
The average true range (ATR) plays an important role in 'Supertrend' as the indicator uses ATR to calculate its value. The ATR indicator signals the degree of price volatility.
Disclosure: I am part of Trade Nation's Influencer program and receive a monthly fee for using their TradingView charts in my analysis.
———————————
WISH YOU ALL LUCK
USDCHF: Bullish Continuation & Long Trade
USDCHF
- Classic bullish formation
- Our team expects growth
SUGGESTED TRADE:
Swing Trade
Buy USDCHF
Entry Level - 0.8046
Sl - 0.8013
Tp - 0.8118
Our Risk - 1%
Start protection of your profits from lower levels
Disclosure: I am part of Trade Nation's Influencer program and receive a monthly fee for using their TradingView charts in my analysis.
❤️ Please, support our work with like & comment! ❤️

Bitcoin can correct to support line of channel and start to growHello traders, I want share with you my opinion about Bitcoin. The price was moving inside a strong upward channel, where it managed to break through the support level and then the resistance level, eventually reaching the seller zone. After that, BTC started to turn around and declined, once again breaking through the 109000 resistance level, this time from above. That movement also marked an exit from the upward channel. Following that, the price made a correction move down to the support level — the same zone that previously acted as a breakout area. From there, BTC showed strength again with a bullish impulse upward, returning to the Seller Zone. However, that rally was short-lived. The market started to decline again, this time forming a downward channel. Now the price is approaching the support line of this channel, which coincides with the support level around 100500 and the buyer zone between 99500 and 100500. I think BTC can decline a bit further to test this support line, and then rebound from this area, starting a new upward move toward the channel resistance line. That’s why I’ve set my TP at 106000 points, just below the resistance line. Given the structure and past reactions from these zones, I remain bullish and expect further growth after this local pullback. Please share this idea with your friends and click Boost 🚀
Disclaimer: As part of ThinkMarkets’ Influencer Program, I am sponsored to share and publish their charts in my analysis.

GOLD - Price can rise in channel to $3495 resistance lineHi guys, this is my overview for XAUUSD, feel free to check it and write your feedback in comments👊
After price started to trades inside triangle, it made an impulse up, breaking two levels, after which turned around.
Price dropped to $3195 level, breaking resistance level, and made a first gap, after which rose to resistance line.
Then Gold in a short time declined to support line, making a two gaps again and then bounced up from support line.
Gold exited from triangle and continued to move up inside rising channel, where it first made a correction.
In channel, price grew higher than $3400 level, but recently turned around and fell to support line.
Now, I expect that Gold can bounce from this line and rise to $3495 resistance line, breaking resistance level.
If this post is useful to you, you can support me with like/boost and advice in comments❤️
Disclaimer: As part of ThinkMarkets’ Influencer Program, I am sponsored to share and publish their charts in my analysis.

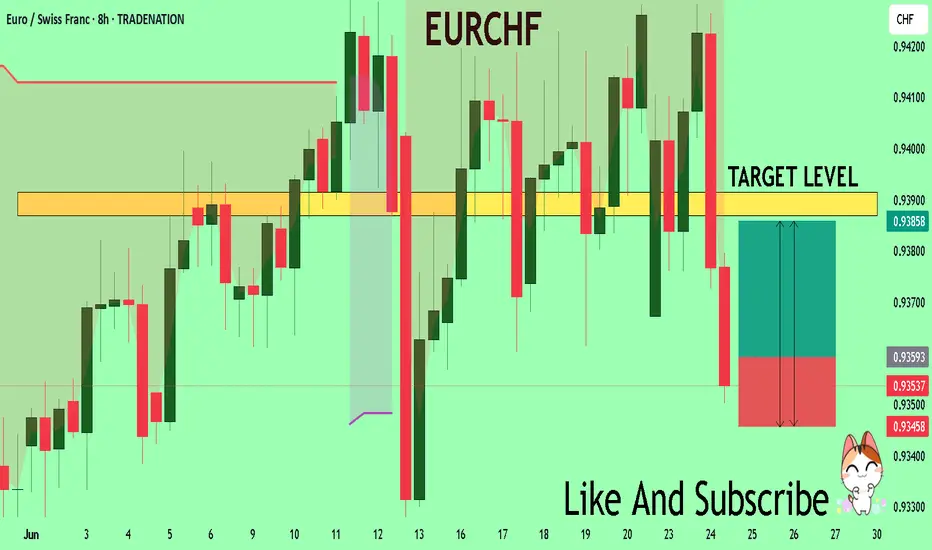
EURCHF Set To Grow! BUY!
My dear subscribers,
This is my opinion on the EURCHF next move:
The instrument tests an important psychological level 0.9359
Bias - Bullish
Technical Indicators: Supper Trend gives a precise Bullish signal, while Pivot Point HL predicts price changes and potential reversals in the market.
Target - 0.9386
My Stop Loss - 0.9345
About Used Indicators:
On the subsequent day, trading above the pivot point is thought to indicate ongoing bullish sentiment, while trading below the pivot point indicates bearish sentiment.
Disclosure: I am part of Trade Nation's Influencer program and receive a monthly fee for using their TradingView charts in my analysis.
———————————
WISH YOU ALL LUCK
EURGBP: Bullish Continuation is Highly Probable! Here is Why:
It is essential that we apply multitimeframe technical analysis and there is no better example of why that is the case than the current EURGBP chart which, if analyzed properly, clearly points in the upward direction.
Disclosure: I am part of Trade Nation's Influencer program and receive a monthly fee for using their TradingView charts in my analysis.
❤️ Please, support our work with like & comment! ❤️
