EURUSD Massive Long! BUY!
My dear friends,
Please, find my technical outlook for EURUSD below:
The price is coiling around a solid key level - 1.1186
Bias - Bullish
Technical Indicators: Pivot Points Low anticipates a potential price reversal.
Super trend shows a clear buy, giving a perfect indicators' convergence.
Goal - 1.1294
Safe Stop Loss - 1.1123
About Used Indicators:
The pivot point itself is simply the average of the high, low and closing prices from the previous trading day.
Disclosure: I am part of Trade Nation's Influencer program and receive a monthly fee for using their TradingView charts in my analysis.
———————————
WISH YOU ALL LUCK
Long!!!!

NZDJPY: Bulls Will Push Higher
The price of NZDJPY will most likely increase soon enough, due to the demand beginning to exceed supply which we can see by looking at the chart of the pair.
Disclosure: I am part of Trade Nation's Influencer program and receive a monthly fee for using their TradingView charts in my analysis.
❤️Please, support our work with like & comment!❤️

AUDCAD: Will Keep Growing! Here is Why:
Our strategy, polished by years of trial and error has helped us identify what seems to be a great trading opportunity and we are here to share it with you as the time is ripe for us to buy AUDCAD.
Disclosure: I am part of Trade Nation's Influencer program and receive a monthly fee for using their TradingView charts in my analysis.
❤️ Please, support our work with like & comment! ❤️

CADCHF Technical Analysis! BUY!
My dear friends,
Please, find my technical outlook for CADCHF below:
The price is coiling around a solid key level - 0.5977.
Bias - Bullish
Technical Indicators: Pivot Points Low anticipates a potential price reversal.
Super trend shows a clear buy, giving a perfect indicators' convergence.
Goal - 0.6000
About Used Indicators:
The pivot point itself is simply the average of the high, low and closing prices from the previous trading day.
Disclosure: I am part of Trade Nation's Influencer program and receive a monthly fee for using their TradingView charts in my analysis.
———————————
WISH YOU ALL LUCK

USDCAD Is Bullish! Long!
Here is our detailed technical review for USDCAD.
Time Frame: 1h
Current Trend: Bullish
Sentiment: Oversold (based on 7-period RSI)
Forecast: Bullish
The market is trading around a solid horizontal structure 1.398.
The above observations make me that the market will inevitably achieve 1.401 level.
P.S
We determine oversold/overbought condition with RSI indicator.
When it drops below 30 - the market is considered to be oversold.
When it bounces above 70 - the market is considered to be overbought.
Disclosure: I am part of Trade Nation's Influencer program and receive a monthly fee for using their TradingView charts in my analysis.
Like and subscribe and comment my ideas if you enjoy them!

AUDUSD Is Very Bullish! Buy!
Take a look at our analysis for AUDUSD.
Time Frame: 1D
Current Trend: Bullish
Sentiment: Oversold (based on 7-period RSI)
Forecast: Bullish
The market is testing a major horizontal structure 0.641.
Taking into consideration the structure & trend analysis, I believe that the market will reach 0.655 level soon.
P.S
Overbought describes a period of time where there has been a significant and consistent upward move in price over a period of time without much pullback.
Disclosure: I am part of Trade Nation's Influencer program and receive a monthly fee for using their TradingView charts in my analysis.
Like and subscribe and comment my ideas if you enjoy them!

GOLD BULLS ARE STRONG HERE|LONG
GOLD SIGNAL
Trade Direction: long
Entry Level: 3,174.39
Target Level: 3,383.26
Stop Loss: 3,035.14
RISK PROFILE
Risk level: medium
Suggested risk: 1%
Timeframe: 1D
Disclosure: I am part of Trade Nation's Influencer program and receive a monthly fee for using their TradingView charts in my analysis.
✅LIKE AND COMMENT MY IDEAS✅

EUR/CHF BULLS WILL DOMINATE THE MARKET|LONG
Hello, Friends!
EUR/CHF pair is in the downtrend because previous week’s candle is red, while the price is obviously falling on the 1H timeframe. And after the retest of the support line below I believe we will see a move up towards the target above at 0.942 because the pair oversold due to its proximity to the lower BB band and a bullish correction is likely.
Disclosure: I am part of Trade Nation's Influencer program and receive a monthly fee for using their TradingView charts in my analysis.
✅LIKE AND COMMENT MY IDEAS✅

Nasdaq100/Us100 Possible Explosive Up Move About To Happen
Hello everyone! In this idea I have posted a picture of my current setup. I have taken a long positions once the 1 hour candles broke out of and closed beyond this range (Box) My SL is just the other side of this box and I am targeting the ATH on this position.
If another 1 hour box starts to form higher up I will simple add another position and move Stop losses accordingly.
although we have moved back within the range, the buy pressure is squeezing the candles to the top side of this range. This is why I am execting an explosive move. Once sellers are exhuasted it will propell itself to the next key level.
Let me know what you think.
I am not a financial adviser. Trade at your own risk.

AVAX Potential UpsidesAVAX/USDT is currently trading within a broader uptrend and is in a corrective phase. The price is approaching the 24.60 level, a key support and resistance area that aligns with the prevailing trend structure. This zone may offer insight into potential market reaction and the strength of the ongoing trend.

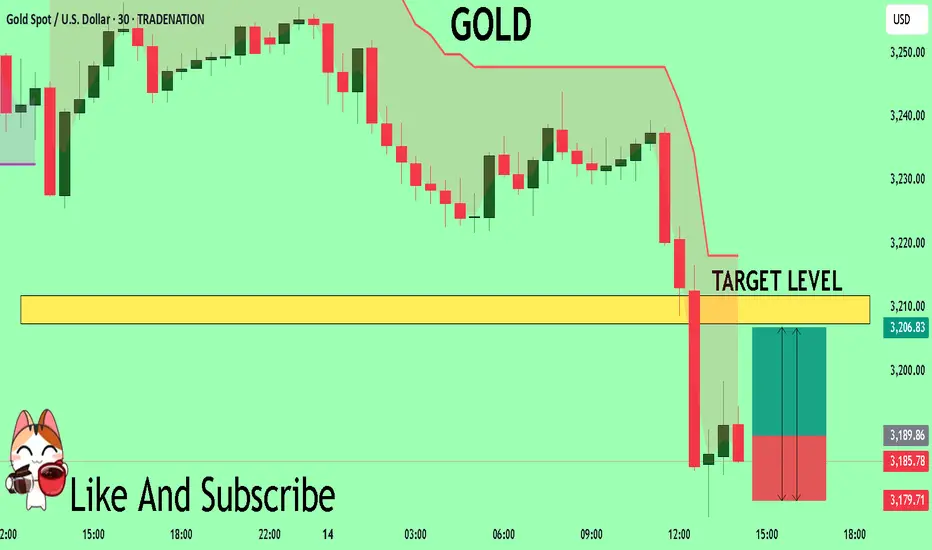
GOLD Will Explode! BUY!
My dear followers,
This is my opinion on the GOLD next move:
The asset is approaching an important pivot point 3189.8
Bias - Bullish
Safe Stop Loss - 3179.7
Technical Indicators: Supper Trend generates a clear long signal while Pivot Point HL is currently determining the overall Bullish trend of the market.
Goal - 3207.3
About Used Indicators:
For more efficient signals, super-trend is used in combination with other indicators like Pivot Points.
Disclosure: I am part of Trade Nation's Influencer program and receive a monthly fee for using their TradingView charts in my analysis.
———————————
WISH YOU ALL LUCK
HelenP. I Gold can decline to trend line and then start to growHi folks today I'm prepared for you Gold analytics. If we look at the chart, we can see how the price after several failed attempts holds in a support zone. The structure of this correction has formed beneath the previously broken trend line, and the price is now approaching it from above. What’s important is that buyers previously stepped in around this level, forming a bounce that allowed the market to reach toward the resistance zone near 3350. This area still remains unbroken, making it a magnet for future bullish targets. Currently, price action shows signs of local weakness, but the broader context favors a potential rebound. The confluence between the horizontal support zone and the descending trend line adds extra technical weight to this level. If price can stabilize here, I expect a retest of 3205, and a potential breakout above it could open the way toward my goal at 3260. This scenario assumes continued respect of the trend line as dynamic support. A clean bounce from it would signal renewed bullish interest, especially if backed by momentum on lower timeframes. If you like my analytics you may support me with your like/comment ❤️

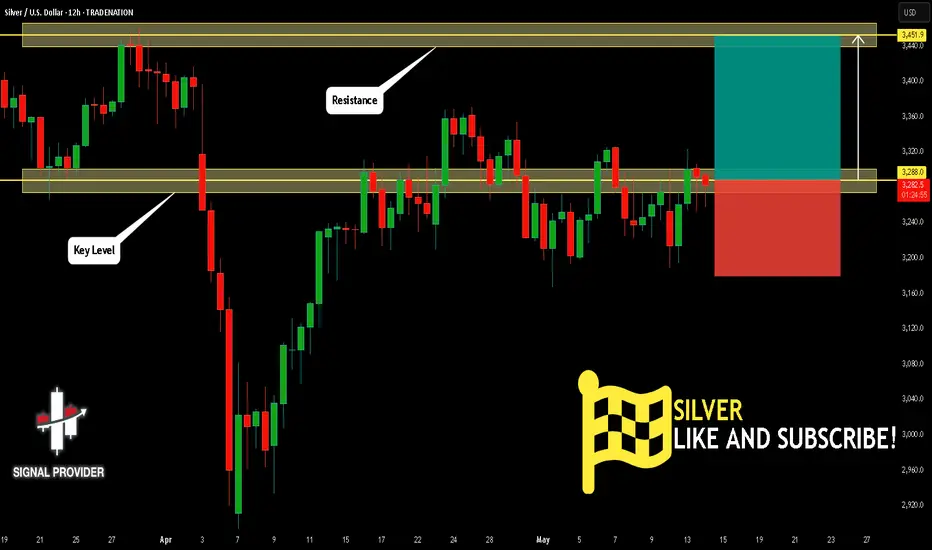
SILVER Is Going Up! Long!
Please, check our technical outlook for SILVER.
Time Frame: 12h
Current Trend: Bullish
Sentiment: Oversold (based on 7-period RSI)
Forecast: Bullish
The market is approaching a key horizontal level 3,288.0.
Considering the today's price action, probabilities will be high to see a movement to 3,451.9.
P.S
Please, note that an oversold/overbought condition can last for a long time, and therefore being oversold/overbought doesn't mean a price rally will come soon, or at all.
Disclosure: I am part of Trade Nation's Influencer program and receive a monthly fee for using their TradingView charts in my analysis.
Like and subscribe and comment my ideas if you enjoy them!
EUR/AUD BUYERS WILL DOMINATE THE MARKET|LONG
EUR/AUD SIGNAL
Trade Direction: long
Entry Level: 1.729
Target Level: 1.801
Stop Loss: 1.681
RISK PROFILE
Risk level: medium
Suggested risk: 1%
Timeframe: 1D
Disclosure: I am part of Trade Nation's Influencer program and receive a monthly fee for using their TradingView charts in my analysis.
✅LIKE AND COMMENT MY IDEAS✅

EUR/GBP BEST PLACE TO BUY FROM|LONG
Hello, Friends!
We are now examining the EUR/GBP pair and we can see that the pair is going down locally while also being in a downtrend on the 1W TF. But there is also a powerful signal from the BB lower band being nearby indicating that the pair is oversold so we can go long from the support line below and a target at 0.854 level.
Disclosure: I am part of Trade Nation's Influencer program and receive a monthly fee for using their TradingView charts in my analysis.
✅LIKE AND COMMENT MY IDEAS✅

We need SWEEPS on Gold for a Bigger movePatiently waiting for gold to give us impulsive activity to indicate for a much bigger move. Need it to break outside of the current value first before I'm interested in a solid direction.

GOLD My Opinion! BUY!
My dear friends,
GOLD looks like it will make a good move, and here are the details:
The market is trading on 3211.4 pivot level.
Bias - Bullish
Technical Indicators: Supper Trend generates a clear long signal while Pivot Point HL is currently determining the overall Bullish trend of the market.
Goal - 3239.5
Recommended Stop Loss -3197.1
About Used Indicators:
Pivot points are a great way to identify areas of support and resistance, but they work best when combined with other kinds of technical analysis
Disclosure: I am part of Trade Nation's Influencer program and receive a monthly fee for using their TradingView charts in my analysis.
———————————
WISH YOU ALL LUCK

EURUSD Trading Opportunity! BUY!
My dear friends,
Please, find my technical outlook for EURUSD below:
The instrument tests an important psychological level 1.1140
Bias - Bullish
Technical Indicators: Supper Trend gives a precise Bullish signal, while Pivot Point HL predicts price changes and potential reversals in the market.
Target - 1.1281
Recommended Stop Loss - 1.1066
About Used Indicators:
Super-trend indicator is more useful in trending markets where there are clear uptrends and downtrends in price.
Disclosure: I am part of Trade Nation's Influencer program and receive a monthly fee for using their TradingView charts in my analysis.
———————————
WISH YOU ALL LUCK

GBPNZD: Bullish Forecast & Outlook
The recent price action on the GBPNZDpair was keeping me on the fence, however, my bias is slowly but surely changing into the bullish one and I think we will see the price go up.
Disclosure: I am part of Trade Nation's Influencer program and receive a monthly fee for using their TradingView charts in my analysis.
❤️ Please, support our work with like & comment! ❤️

BTC - New Short-Term Long!Hello TradingView Family / Fellow Traders. This is Richard, also known as theSignalyst.
📈BTC has been overall bullish trading within the rising channel marked in blue.
Moreover, the green zone is a strong demand and structure.
🏹 Thus, the highlighted blue circle is a strong area to look for buy setups as it is the intersection of structure and lower blue trendline acting non-horizontal support.
📚 As per my trading style:
As #BTC retests the blue circle zone, I will be looking for bullish reversal setups (like a double bottom pattern, trendline break , and so on...)
📚 Always follow your trading plan regarding entry, risk management, and trade management.
Good luck!
All Strategies Are Good; If Managed Properly!
~Rich

GOLD Will Go Up! Buy!
Here is our detailed technical review for GOLD.
Time Frame: 12h
Current Trend: Bullish
Sentiment: Oversold (based on 7-period RSI)
Forecast: Bullish
The market is trading around a solid horizontal structure 3,242.49.
The above observations make me that the market will inevitably achieve 3,415.14 level.
P.S
Please, note that an oversold/overbought condition can last for a long time, and therefore being oversold/overbought doesn't mean a price rally will come soon, or at all.
Disclosure: I am part of Trade Nation's Influencer program and receive a monthly fee for using their TradingView charts in my analysis.
Like and subscribe and comment my ideas if you enjoy them!

AUDCAD Is Very Bullish! Buy!
Here is our detailed technical review for AUDCAD.
Time Frame: 1D
Current Trend: Bullish
Sentiment: Oversold (based on 7-period RSI)
Forecast: Bullish
The market is approaching a significant support area 0.898.
The underlined horizontal cluster clearly indicates a highly probable bullish movement with target 0.913 level.
P.S
Overbought describes a period of time where there has been a significant and consistent upward move in price over a period of time without much pullback.
Disclosure: I am part of Trade Nation's Influencer program and receive a monthly fee for using their TradingView charts in my analysis.
Like and subscribe and comment my ideas if you enjoy them!

BNB/USDT Potential UpsidesHey Traders, in today's trading session we are monitoring BNBUSDT for a buying opportunity around 630 zone, BNBUSDT is trading in an uptrend and currently is in a correction phase in which it is approaching the trend at 630 support and resistance area.
Trade safe, Joe.
