HelenP. I Bitcoin will continue to grow inside upward channelHi folks today I'm prepared for you Bitcoin analytics. The price has recently shown another confident bullish impulse, pushing higher within a clean ascending channel. The key moment was the breakout above the resistance zone, which had previously acted as a ceiling for the price. This breakout marked the continuation of a higher-high, higher-low sequence that confirms the strength of the ongoing trend. Then the market returned to retest this former resistance, now acting as support, and immediately bounced, reinforcing buyer control and validating the area as a foundation for the next move. Now BTC is holding firm in the upper half of the channel, maintaining its position above the trend line with little sign of weakness. This combination of sustained bullish structure, well-respected technical levels, and steady volume behavior suggests that the market is still preparing for higher levels. With the current structure and momentum, I expect BTCUSDT will continue its upward path within the channel. My goal is 108700 points, which aligns almost with the resistance line of the upward channel. If you like my analytics you may support me with your like/comment ❤️
Long!!!!

LINK Daily breakout?One of the most important crypto projects is undoubtedly Chainlink. Having been in a downtrend like must altcoins ever since President Trumps inauguration , LINK looks to finally be ready to exit the bearish trend channel for the first time this calendar year using the newly flipped 1D 200 EMA as a launchpad or is this a local top and the trend continues?
For the bulls a double bottom at $10.15 followed by a higher lows and now a higher high is a strong argument for a flip to bullish structure, however a breakout is needed to confirm this bullish flip in structure and with BTC + most majors at local resistance levels and looking in need of a cool off, this may be too much to ask of LINK at this time.
The bears would say this is business as usual and a rejection off the upper limit maintains the bearish trend, a loss of the 1D 200 EMA would definitely increase the likeliness this outcome.

USDJPY / 1 DAY / BULLHello Guys;
My USDJPY target level is 147,500.
My target may come a bit late because this trade is a swing trade.
I would appreciate it very much if you do not miss your likes within the framework of Respect for Labor Thank you very much in advance

EURUSD: Long Trading Opportunity
EURUSD
- Classic bullish setup
- Our team expects bullish continuation
SUGGESTED TRADE:
Swing Trade
Long EURUSD
Entry Point - 1.1125
Stop Loss - 1.1037
Take Profit - 1.1307
Our Risk - 1%
Start protection of your profits from lower levels
Disclosure: I am part of Trade Nation's Influencer program and receive a monthly fee for using their TradingView charts in my analysis.
❤️ Please, support our work with like & comment! ❤️

EURNZD: Bullish Continuation is Highly Probable! Here is Why:
It is essential that we apply multitimeframe technical analysis and there is no better example of why that is the case than the current EURNZD chart which, if analyzed properly, clearly points in the upward direction.
Disclosure: I am part of Trade Nation's Influencer program and receive a monthly fee for using their TradingView charts in my analysis.
❤️ Please, support our work with like & comment! ❤️

AUDUSD The Target Is UP! BUY!
My dear followers,
I analysed this chart on AUDUSD and concluded the following:
The market is trading on 0.6385 pivot level.
Bias - Bullish
Technical Indicators: Both Super Trend & Pivot HL indicate a highly probable Bullish continuation.
Target - 0.6401
About Used Indicators:
A super-trend indicator is plotted on either above or below the closing price to signal a buy or sell. The indicator changes color, based on whether or not you should be buying. If the super-trend indicator moves below the closing price, the indicator turns green, and it signals an entry point or points to buy.
Disclosure: I am part of Trade Nation's Influencer program and receive a monthly fee for using their TradingView charts in my analysis.
———————————
WISH YOU ALL LUCK

GOLD BULLS ARE GAINING STRENGTH|LONG
GOLD SIGNAL
Trade Direction: long
Entry Level: 3,211.87
Target Level: 3,375.85
Stop Loss: 3,102.01
RISK PROFILE
Risk level: medium
Suggested risk: 1%
Timeframe: 12h
Disclosure: I am part of Trade Nation's Influencer program and receive a monthly fee for using their TradingView charts in my analysis.
✅LIKE AND COMMENT MY IDEAS✅

12/05/25 Weekly OutlookLast weeks high: $104,972.46
Last weeks low: $93,385.49
Midpoint: $99,178.97
Bitcoin climbs over 12% from weekly low to weekly high, an incredible achievement despite a mixed performance in Tradfi. A pattern we've seen since the $74,500 double bottom following Liberation day goes; A strong rally for a week, consolidation in a tight trading range for a week, then repeat. Should this pattern continue we should see consolidation between weekly high and $102,075 (0.75 line).
CPI & PPI take place this week on Tuesday and Thursday respectively, inflation is still a big talking point but baring a crazy print I would be surprised if these events move BTC. In the last few hours at time of writing The US has reduced tariffs on China to 30% for 90 days, China has reduced tariffs on the US down to 10%. To me this signifies the worst of the trade war narrative is behind us.
This week I will be tracking altcoins with strong fundamentals as BTC.D rolls over from its highest point since January '21, ETH has already had a strong breakout from the downtrend and with BTC at ATH levels with strong resistance this should be the time to see altcoin strength and play catch-up.
Good luck this week!

OptionsMastery: A potential trend change on NVDA? 🔉Sound on!🔉
📣Make sure to watch fullscreen!📣
Thank you as always for watching my videos. I hope that you learned something very educational! Please feel free to like, share, and comment on this post. Remember only risk what you are willing to lose. Trading is very risky but it can change your life!

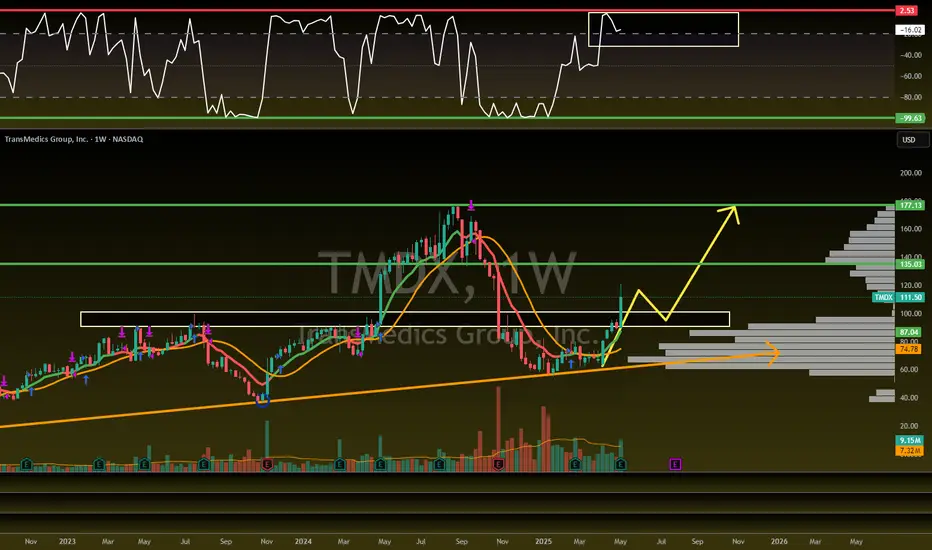
$TMDX Trade Setup: 80%+ Upside!NASDAQ:TMDX Trade Setup
Looking for a retest of the $90-100 breakout area to flip previous resistance into support.
Followed by a move to these targets...
🎯$135🎯$177
- Volume shelf launch with GAP
- Bullish WCB forming
- Green H5 Indicator
- Great earnings recently
Not financial advice
HelenP. I Euro may break resistance level and rise to trend lineHi folks today I'm prepared for you Euro analytics. If we look at the chart, we can see how the price a long period of slow decline, finally showing early signs of potential reversal. The price has been moving inside a falling wedge pattern, consistently testing lower highs and lower lows. But now, after touching the lower boundary of the structure and reacting near the 1.1200 zone, buyers have stepped in with notable strength. This level aligns not only with the wedge’s base but also with a previous support zone, which adds weight to the current move. The first reaction was sharp, the price rebounded confidently, and started forming higher local lows. That suggests the bearish momentum is weakening, while the structure itself points toward a possible breakout. If the Euro continues to build this upward momentum, it could break through the 1.1285 - 1.1300 resistance zone, which has already acted as a ceiling multiple times. That zone now becomes the key pivot for the next phase of the movement. Given the wedge structure, price behavior near support, and the current momentum, I expect EURUSD may reach the trend line, breaking the resistance level, and continue to grow to the trend line. That's why I set my goal at 1.1320 points, which coincides with the trend line. If you like my analytics you may support me with your like/comment ❤️

HelenP. I Gold will rebound from trend line to resistance zoneHi folks today I'm prepared for you Gold analytics. After an aggressive rally from the support zone, the price has been consolidating just below the resistance area. What’s important now is how price behaves around the trend line, which has acted as dynamic support since early April. The most recent pullback landed exactly on this line, where buyers quickly reacted, forming a higher low. This move suggests that the bullish structure remains intact and buyers are defending their positions. The market is currently hovering near 3325, but with momentum slowly building and no major bearish breakdowns, it’s reasonable to anticipate another push higher. The resistance zone between 3405 and 3435 is the next key area, and it aligns with the top of the recent impulse move. If XAUUSD holds above the trend line and breaks through the 3405 level, we could see a continuation toward 3435, my current goal. Overall, the market shows a steady uptrend, supported by rising lows and a strong reaction at the trend line. Until this structure is broken, I remain bullish. If you like my analytics you may support me with your like/comment ❤️

EURUSD On The Rise! BUY!
My dear friends,
EURUSD looks like it will make a good move, and here are the details:
The market is trading on 1.1245 pivot level.
Bias - Bullish
Technical Indicators: Supper Trend generates a clear long signal while Pivot Point HL is currently determining the overall Bullish trend of the market.
Goal - 1.1307
About Used Indicators:
Pivot points are a great way to identify areas of support and resistance, but they work best when combined with other kinds of technical analysis
Disclosure: I am part of Trade Nation's Influencer program and receive a monthly fee for using their TradingView charts in my analysis.
———————————
WISH YOU ALL LUCK

DXY Will Go Higher! Long!
Please, check our technical outlook for DXY.
Time Frame: 9h
Current Trend: Bullish
Sentiment: Oversold (based on 7-period RSI)
Forecast: Bullish
The market is approaching a key horizontal level 100.428.
Considering the today's price action, probabilities will be high to see a movement to 102.304.
P.S
Please, note that an oversold/overbought condition can last for a long time, and therefore being oversold/overbought doesn't mean a price rally will come soon, or at all.
Disclosure: I am part of Trade Nation's Influencer program and receive a monthly fee for using their TradingView charts in my analysis.
Like and subscribe and comment my ideas if you enjoy them!

#MEME #MEMEUSDT #MEMECOIN #LONG #SWING #Eddy#MEME #MEMEUSDT #MEMECOIN #LONG #SWING #Eddy
MEMEUSDT.P SWING Long Setup
Important areas of the upper time frame for swing are identified and named.
This setup is based on a combination of different styles, including the volume style with the ict style.
Based on your strategy and style, get the necessary confirmations for this Swing Setup to enter the trade.
Don't forget risk and capital management.
The entry point, take profit point, and stop loss point are indicated on the chart along with their amounts.
The responsibility for the transaction is yours and I have no responsibility for not observing your risk and capital management.
By scratching the price and time bar, you can see the big picture of targets.
Buy Position "LONG" Spot & Future Details :
Entry : 0.002662
Stop : 0.002616 (( 1.73% ))
Target 1 : 50% Spot
Target 2 : 100% Spot
Target 3 : 500% Spot
Target 4 : 1000% Spot
Target 5 : 1500% Spot
Target 6 : 2000% Spot
Be successful and profitable.

EURUSD: Growth & Bullish Forecast
The analysis of the EURUSD chart clearly shows us that the pair is finally about to go up due to the rising pressure from the buyers.
Disclosure: I am part of Trade Nation's Influencer program and receive a monthly fee for using their TradingView charts in my analysis.
❤️ Please, support our work with like & comment! ❤️

Gold will continue to grow and exit from pennantHello traders, I want share with you my opinion about Gold. After looking at this chart, we can see how the price of Gold has been developing inside an upward pennant, formed after a powerful impulse from the buyer zone. This earlier move created a strong bullish foundation, supported by consistent reactions from the support area, which has since become a key defensive level. After the breakout from the upper boundary of the previous ascending channel, the price entered a phase of consolidation. However, rather than fading, the price action has remained tightly squeezed between the support line and the resistance trendline, creating the structure of a classic pennant. This pattern usually signals continuation, especially when supported by strong preceding momentum, which is exactly what we’re seeing here. Currently, the price is hovering around the support line of the pennant and has already shown signs of bouncing back up. If this rebound continues, the next logical move is a breakout through the resistance line of the pennant, with the 3450 level as a target. It aligns perfectly with the upper boundary and represents a strong technical TP1. Please share this idea with your friends and click Boost 🚀

BITCOIN Will Move Higher! Buy!
Take a look at our analysis for BITCOIN.
Time Frame: 4h
Current Trend: Bullish
Sentiment: Oversold (based on 7-period RSI)
Forecast: Bullish
The market is on a crucial zone of demand 103,231.18.
The oversold market condition in a combination with key structure gives us a relatively strong bullish signal with goal 107,552.18 level.
P.S
We determine oversold/overbought condition with RSI indicator.
When it drops below 30 - the market is considered to be oversold.
When it bounces above 70 - the market is considered to be overbought.
Disclosure: I am part of Trade Nation's Influencer program and receive a monthly fee for using their TradingView charts in my analysis.
Like and subscribe and comment my ideas if you enjoy them!

USDJPY Will Move Higher! Buy!
Please, check our technical outlook for USDJPY.
Time Frame: 4h
Current Trend: Bullish
Sentiment: Oversold (based on 7-period RSI)
Forecast: Bullish
The market is approaching a key horizontal level 142.756.
Considering the today's price action, probabilities will be high to see a movement to 144.697.
P.S
We determine oversold/overbought condition with RSI indicator.
When it drops below 30 - the market is considered to be oversold.
When it bounces above 70 - the market is considered to be overbought.
Disclosure: I am part of Trade Nation's Influencer program and receive a monthly fee for using their TradingView charts in my analysis.
Like and subscribe and comment my ideas if you enjoy them!

USDCAD Massive Long! BUY!
My dear subscribers,
This is my opinion on the USDCAD next move:
The instrument tests an important psychological level 1.3792
Bias - Bullish
Technical Indicators: Supper Trend gives a precise Bullish signal, while Pivot Point HL predicts price changes and potential reversals in the market.
Target - 1.3833
My Stop Loss - 1.3777
About Used Indicators:
On the subsequent day, trading above the pivot point is thought to indicate ongoing bullish sentiment, while trading below the pivot point indicates bearish sentiment.
Disclosure: I am part of Trade Nation's Influencer program and receive a monthly fee for using their TradingView charts in my analysis.
———————————
WISH YOU ALL LUCK

EURNZD Sellers In Panic! BUY!
My dear friends,
EURNZD looks like it will make a good move, and here are the details:
The market is trading on 1.8991 pivot level.
Bias - Bullish
Technical Indicators: Supper Trend generates a clear long signal while Pivot Point HL is currently determining the overall Bullish trend of the market.
Goal - 1.9076
Recommended Stop Loss - 1.8942
About Used Indicators:
Pivot points are a great way to identify areas of support and resistance, but they work best when combined with other kinds of technical analysis
Disclosure: I am part of Trade Nation's Influencer program and receive a monthly fee for using their TradingView charts in my analysis.
———————————
WISH YOU ALL LUCK

OptionsMastery: MARA Inverse H&S!🔉Sound on!🔉
📣Make sure to watch fullscreen!📣
Thank you as always for watching my videos. I hope that you learned something very educational! Please feel free to like, share, and comment on this post. Remember only risk what you are willing to lose. Trading is very risky but it can change your life!

Watching ETHBTC for a Double Bottom (Hidden Bullish Divergence)Introduction
We are in the initial stages of seeing if ETH can set a "higher low" double bottom on the monthly chart. The first low was set September 2019 so this has been a multi year pattern. It might be playing out over several crpyot cycles to completion.
Simple Price Analysis
For a valid double bottom we want the lows within 10% of each other. The first low is about 8% below this second low so we are definitely within tolerance. We can also see that price is currently bouncing off top of the previous monthly bottoming structure until price moved to between the 0.618 level and created a double top (which I covered extensively in the linked idea.
In the chart below we can see a similar pattern with bitcoin after the C19 crash. The low wasn't textbook, the first low being 18% lower than the second low. Thats fine. The most important think is that price set a higher low.
Targeting off the fib draw is still the same. Looking for the 1.618 level. So I am watching to see eth hit a 27x against bitcoin from here
Indicators
Normal Divergence (Trend Reversal)
Bearish: Higher highs on price action but lower highs on the indicator
Bullish: Lower lows on price action but higher lows on the indicator
Hidden (Trend Continuation)
Bearish: Lower high on the price action and higher highs on the indicator
Bullish: Higher low on the price action and a lower low on the indicator
If you look at the primer we are looking for the main trend to continue. And that is up.
Battle Plan
In my linked idea I made it clear I was staying out of eth until I saw bullish divergence. Not just eth, but everything in the eth ecosystem. Now EHTBC provisionally bullish its time to look at the ETH ecosystem again. While ETHBTC looked bearish I didn't even bother to analyze tokens against eth, only BTC.
Now I am going to be analyzing coins bullishness against eth. If I don't think it will outperform eth I don't buy it. And generally, I hope to be buying bull backs. Here is a great opportunity for a SUI buy when compared against eth on the 4h chart.
Wish me luck.
Linked Idea
