EURUSD Will Explode! BUY!
My dear friends,
Please, find my technical outlook for EURUSD below:
The instrument tests an important psychological level 1.1278
Bias - Bullish
Technical Indicators: Supper Trend gives a precise Bullish signal, while Pivot Point HL predicts price changes and potential reversals in the market.
Target - 1.1344
Recommended Stop Loss - 1.1236
About Used Indicators:
Super-trend indicator is more useful in trending markets where there are clear uptrends and downtrends in price.
Disclosure: I am part of Trade Nation's Influencer program and receive a monthly fee for using their TradingView charts in my analysis.
———————————
WISH YOU ALL LUCK
Long!!!!

CADJPY: Bullish Continuation is Expected! Here is Why:
Looking at the chart of CADJPY right now we are seeing some interesting price action on the lower timeframes. Thus a local move up seems to be quite likely.
Disclosure: I am part of Trade Nation's Influencer program and receive a monthly fee for using their TradingView charts in my analysis.
❤️ Please, support our work with like & comment! ❤️

GOLD: Long Trade with Entry/SL/TP
GOLD
- Classic bullish formation
- Our team expects growth
SUGGESTED TRADE:
Swing Trade
Buy GOLD
Entry Level - 3338.10
Sl - 3330.1
Tp - 3353.0
Our Risk - 1%
Start protection of your profits from lower levels
Disclosure: I am part of Trade Nation's Influencer program and receive a monthly fee for using their TradingView charts in my analysis.
❤️ Please, support our work with like & comment! ❤️

GOLD - Price can bounce up to $3475 points, exiting from pennantHi guys, this is my overview for XAUUSD, feel free to check it and write your feedback in comments👊
A few moments ago price traded inside flat, where it two times broke $3045 levels and then made impulse up.
Price exited from flat and continued to grow inside a pennant pattern, where it later reached $3320 level.
Then Gold broke this level and rose to resistance line of a pennant, and then made a correction to support level, and then broke it.
After this, the price declined to the support line of the pennant, after which it turned around and bounced up.
Gold broke $3320 level and rose to resisance line of pennant, but recently it made correction to this level.
So, now I expect that price can bounce up from this level to $3475, thereby exiting from pennant pattern.
If this post is useful to you, you can support me with like/boost and advice in comments❤️

TONUSDT Built a Fresh Up Trend!!!Hey Traders, in today's trading session we are monitoring TONUSDT for a buying opportunity around 3.20 zone, TONUSDT is trading in an uptrend and currently is in a correction phase in which it is approaching the trend at 3.20 support and resistance area.
Trade safe, Joe.

EURUSD: Bullish Continuation
Remember that we can not, and should not impose our will on the market but rather listen to its whims and make profit by following it. And thus shall be done today on the EURUSD pair which is likely to be pushed up by the bulls so we will buy!
Disclosure: I am part of Trade Nation's Influencer program and receive a monthly fee for using their TradingView charts in my analysis.
❤️ Please, support our work with like & comment! ❤️

GOLD The Target Is UP! BUY!
My dear followers,
I analysed this chart on GOLD and concluded the following:
The market is trading on 3358.8 pivot level.
Bias - Bullish
Technical Indicators: Both Super Trend & Pivot HL indicate a highly probable Bullish continuation.
Target - 3377.5
Safe Stop Loss - 3352.1
About Used Indicators:
A super-trend indicator is plotted on either above or below the closing price to signal a buy or sell. The indicator changes color, based on whether or not you should be buying. If the super-trend indicator moves below the closing price, the indicator turns green, and it signals an entry point or points to buy.
Disclosure: I am part of Trade Nation's Influencer program and receive a monthly fee for using their TradingView charts in my analysis.
———————————
WISH YOU ALL LUCK

Euro may correct to support area and then start to move upHello traders, I want share with you my opinion about Euro. Looking at this chart, we can see how price has been confidently trending within an upward channel, supported by strong impulses and consistent demand from the lower boundary. The price initially rebounded from the buyer zone, which later became the launchpad for a major upward move. After breaking the resistance line of the channel, the Euro made a clean breakout and confirmed its strength with a retest from above, a clear sign of bullish continuation. This upward momentum carried price directly into the support area, which has since served as a key zone for consolidations. The market then shifted into a horizontal range, trading within well-defined boundaries, with repeated rejections near the top and steady rebounds from the bottom support. What’s crucial now is that the Euro is again testing the lower border of this range while holding above the current support level at 1.1270. Given this structure, a strong preceding trend, clean reaction at the bottom of the range, and ongoing consolidation without deeper breakdowns, I expect the price to rebound from this zone and continue higher. My TP1 is set at 1.1575, the upper boundary of the current range, which remains a logical magnet for price in the short term. Please share this idea with your friends and click Boost 🚀

Bitcoin may correct a little and then continue to grow in wedgeHello traders, I want share with you my opinion about Bitcoin. The price has been moving confidently inside an upward wedge structure, which often signals a continuation in strong bullish trends but also warns of potential exhaustion if momentum fades. In this case, the wedge is forming after a clear impulse move and is supported by a solid base at the buyer zone. Multiple impulses from this level and consistent support at the current support zone have pushed the price higher, with bullish momentum now clearly in control. After a breakout from the previous resistance zone and a clean retest of the support area, the price started a strong rally. This move aligns well with the wedge formation, where both trend lines are narrowing upward, indicating that buyers are pushing steadily higher while sellers are becoming more aggressive, a setup that often leads to an explosive breakout if the resistance is breached. Now BTC trades above 93700, consolidating slightly below the wedge resistance line. Based on the wedge geometry and the strong impulse structure that preceded it, I expect the price to continue growing and test the 100000 level, which aligns perfectly with the upper wedge boundary and serves as my TP 1. Please share this idea with your friends and click Boost 🚀

GOLD BEST PLACE TO BUY FROM|LONG
GOLD SIGNAL
Trade Direction: long
Entry Level: 3,341.45
Target Level: 3,414.79
Stop Loss: 3,292.55
RISK PROFILE
Risk level: medium
Suggested risk: 1%
Timeframe: 2h
Disclosure: I am part of Trade Nation's Influencer program and receive a monthly fee for using their TradingView charts in my analysis.
✅LIKE AND COMMENT MY IDEAS✅

BTC – Liquidity Sweep, Fair Value Gap Reactions & Potential LongMarket context and structure
This BTCUSDT 1-hour chart from BYBIT illustrates a methodical transition from a phase of consolidation to bullish expansion, guided by smart money principles. Price initially consolidates beneath a well-defined resistance level, with an Imbalance Fair Value Gap (IFVG) forming inside the range. This IFVG signals an inefficient zone where institutional players may be positioned. The eventual breakout above this range indicates a structural shift and the beginning of a directional move, setting the stage for further bullish development.
Break of structure and liquidity sweep
Following the breakout, BTC sweeps the buy-side liquidity resting above a prior swing high. This liquidity grab is a common maneuver in smart money trading, designed to trigger stop orders and breakout entries to facilitate larger institutional fills. The aggressive price movement results in the creation of several Fair Value Gaps (FVGs), which are regions where price moved with such momentum that no overlap between candles occurred. These FVGs are crucial areas of interest where future re-entries or continuations might originate.
Fair value gaps and demand zones
The chart highlights multiple FVGs formed during the bullish impulse. The uppermost FVG, located just below the most recent liquidity sweep, acts as a shallow retracement zone and has already been partially mitigated. A mid-range FVG extends further down, providing a secondary support layer within the current price structure. The largest and deepest FVG lies closer to the breakout origin and represents a significant unfilled demand zone. These FVGs help to outline institutional footprints, revealing where unfulfilled orders may still reside and where price might return to rebalance.
Re-entry strategy and projection
An ideal re-entry area is labeled “Entry at IFVG,” situated near the recently swept liquidity. The projection suggests that price may retrace slightly into this IFVG, consolidate, and then continue its upward trajectory. This anticipated movement reflects a bullish continuation pattern rooted in the idea of reaccumulation, where price revisits areas of imbalance before pushing higher. The visual path drawn on the chart captures this idea, showing a measured retracement followed by a continuation of the trend.
Interpretation and tactical bias
The overall structure and price behavior support a smart money-based bullish outlook. The clean break of structure, the successful sweep of liquidity, and the presence of multiple fair value gaps provide a foundation for continued upside potential. Price respecting these imbalance zones on pullbacks reinforces demand and highlights ongoing institutional involvement. This setup encourages a patient, context-aware approach to trading, focusing on inefficiencies, order flow, and the narrative of price rather than arbitrary indicators.

EUR/JPY LONG FROM SUPPORT
Hello, Friends!
EUR/JPY is making a bearish pullback on the 3H TF and is nearing the support line below while we are generally bullish biased on the pair due to our previous 1W candle analysis, thus making a trend-following long a good option for us with the target being the 163.264 level.
Disclosure: I am part of Trade Nation's Influencer program and receive a monthly fee for using their TradingView charts in my analysis.
✅LIKE AND COMMENT MY IDEAS✅

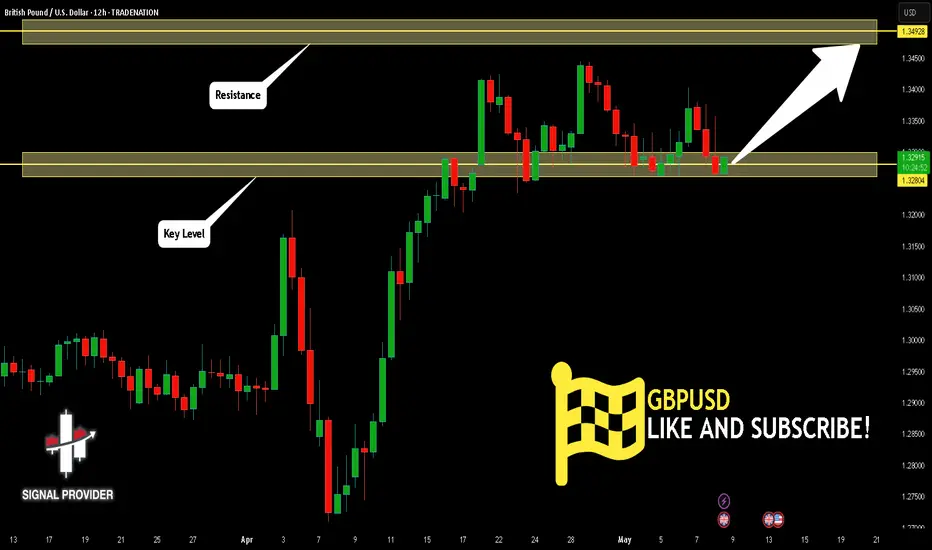
GBPUSD Is Bullish! Long!
Take a look at our analysis for GBPUSD.
Time Frame: 12h
Current Trend: Bullish
Sentiment: Oversold (based on 7-period RSI)
Forecast: Bullish
The market is testing a major horizontal structure 1.328.
Taking into consideration the structure & trend analysis, I believe that the market will reach 1.349 level soon.
P.S
Overbought describes a period of time where there has been a significant and consistent upward move in price over a period of time without much pullback.
Disclosure: I am part of Trade Nation's Influencer program and receive a monthly fee for using their TradingView charts in my analysis.
Like and subscribe and comment my ideas if you enjoy them!
NZDJPY Expected Growth! BUY!
My dear friends,
Please, find my technical outlook for NZDJPY below:
The price is coiling around a solid key level - 85.539
Bias - Bullish
Technical Indicators: Pivot Points Low anticipates a potential price reversal.
Super trend shows a clear buy, giving a perfect indicators' convergence.
Goal - 85.760
About Used Indicators:
The pivot point itself is simply the average of the high, low and closing prices from the previous trading day.
Disclosure: I am part of Trade Nation's Influencer program and receive a monthly fee for using their TradingView charts in my analysis.
———————————
WISH YOU ALL LUCK

EURJPY Technical Analysis! BUY!
My dear friends,
Please, find my technical outlook for EURJPY below:
The price is coiling around a solid key level - 162.05
Bias - Bullish
Technical Indicators: Pivot Points High anticipates a potential price reversal.
Super trend shows a clear buy, giving a perfect indicators' convergence.
Goal - 162.84
Safe Stop Loss - 161.61
About Used Indicators:
The pivot point itself is simply the average of the high, low and closing prices from the previous trading day.
Disclosure: I am part of Trade Nation's Influencer program and receive a monthly fee for using their TradingView charts in my analysis.
———————————
WISH YOU ALL LUCK

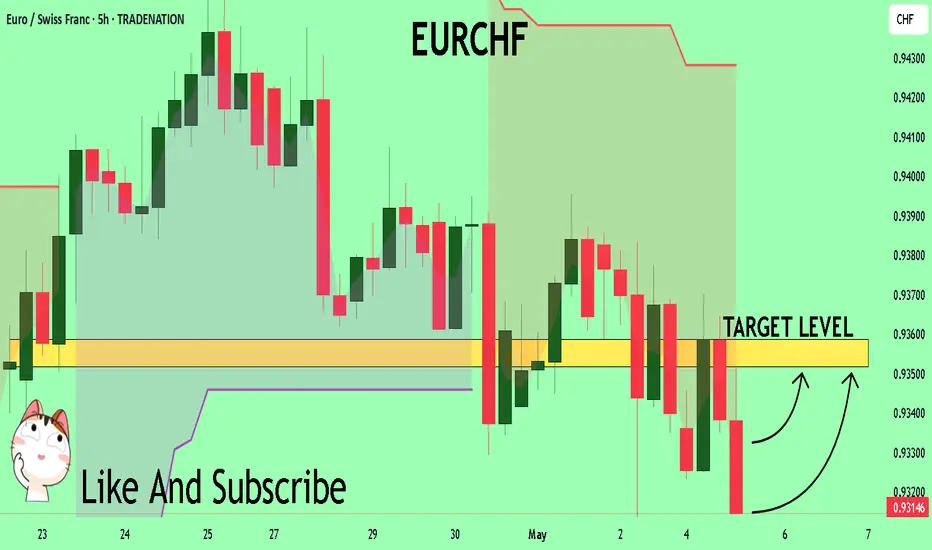
EURCHF Trading Opportunity! BUY!
My dear followers,
I analysed this chart on EURCHF and concluded the following:
The market is trading on 0.9315 pivot level.
Bias - Bullish
Technical Indicators: Both Super Trend & Pivot HL indicate a highly probable Bullish continuation.
Target - 0.9351
About Used Indicators:
A super-trend indicator is plotted on either above or below the closing price to signal a buy or sell. The indicator changes color, based on whether or not you should be buying. If the super-trend indicator moves below the closing price, the indicator turns green, and it signals an entry point or points to buy.
Disclosure: I am part of Trade Nation's Influencer program and receive a monthly fee for using their TradingView charts in my analysis.
———————————
WISH YOU ALL LUCK
Euro will exit from pennant and grow to resistance levelHello traders, I want share with you my opinion about Euro. Looking at this chart, we can see how the price, after a strong upward impulse, the price entered into a consolidation phase, forming a classic upward pennant pattern. Throughout this structure, the price repeatedly respected both the support line and resistance line, tightening inside the pennant while still holding above the support level at 1.1300. This zone, between 1.1280 and 1.1300, marked as the buyer zone, has acted as a strong floor multiple times. Every touch to this area sparked bullish reactions, and most recently, we can see the rice once again starting to grow after dipping into this zone. On the upper side, the resistance level at 1.1430 coincides with the breakout target of the pennant, and also lies just below the seller zone, making it a logical TP 1 area for bulls. The current price action suggests that after a minor pull-back, the price may test the lower pennant edge and then rebound, potentially initiating an impulsive breakout toward 1.1430. Given this structure and the strong base forming around 1.1300, I expect Euro will grow upward toward my TP 1 at the 1.1430 level, thereby exiting from the pennant. Please share this idea with your friends and click Boost 🚀

GBP/CHF BULLS ARE GAINING STRENGTH|LONG
GBP/CHF SIGNAL
Trade Direction: long
Entry Level: 1.098
Target Level: 1.103
Stop Loss: 1.095
RISK PROFILE
Risk level: medium
Suggested risk: 1%
Timeframe: 1h
Disclosure: I am part of Trade Nation's Influencer program and receive a monthly fee for using their TradingView charts in my analysis.
✅LIKE AND COMMENT MY IDEAS✅

GOLD BULLISH BIAS RIGHT NOW| LONG
GOLD SIGNAL
Trade Direction: long
Entry Level: 3,217.01
Target Level: 3,287.27
Stop Loss: 3,170.16
RISK PROFILE
Risk level: medium
Suggested risk: 1%
Timeframe: 3h
Disclosure: I am part of Trade Nation's Influencer program and receive a monthly fee for using their TradingView charts in my analysis.
✅LIKE AND COMMENT MY IDEAS✅

SILVER Is Going Up! Buy!
Here is our detailed technical review for SILVER.
Time Frame: 9h
Current Trend: Bullish
Sentiment: Oversold (based on 7-period RSI)
Forecast: Bullish
The market is approaching a significant support area 3,288.3.
The underlined horizontal cluster clearly indicates a highly probable bullish movement with target 3,391.4 level.
P.S
The term oversold refers to a condition where an asset has traded lower in price and has the potential for a price bounce.
Overbought refers to market scenarios where the instrument is traded considerably higher than its fair value. Overvaluation is caused by market sentiments when there is positive news.
Disclosure: I am part of Trade Nation's Influencer program and receive a monthly fee for using their TradingView charts in my analysis.
Like and subscribe and comment my ideas if you enjoy them!

GOLD: Bullish Continuation & Long Trade
GOLD
- Classic bullish formation
- Our team expects pullback
SUGGESTED TRADE:
Swing Trade
Long GOLD
Entry - 3387.7
Sl - 3380.3
Tp - 3403.8
Our Risk - 1%
Start protection of your profits from lower levels
Disclosure: I am part of Trade Nation's Influencer program and receive a monthly fee for using their TradingView charts in my analysis.
❤️ Please, support our work with like & comment! ❤️

GOLD - Bullish Structure with Potential Continuation PlayThe current 1-hour chart of Gold (XAU/USD) demonstrates a clean bullish structure supported by an ascending channel and multiple unmitigated Fair Value Gaps (FVGs) acting as potential demand zones. This setup highlights the strength of the ongoing uptrend and offers insights into a high-probability continuation entry should price retrace.
Market Context and Trend Structure:
Following a prolonged downtrend visible in the earlier part of the chart, Gold reversed decisively with a bullish break of structure. Since then, price has been consistently printing higher highs and higher lows while respecting an ascending parallel channel. This channel, marked by two trendlines, encapsulates the short-term bullish momentum.
The current move is strong and impulsive, suggesting that institutional order flow is behind this leg. Candles are elongated with minimal wicks on the upside, reinforcing the idea of aggressive buying pressure.
Key Demand Zones and FVG Analysis:
Three major Fair Value Gaps (FVGs) have formed along the recent bullish leg, each potentially acting as a zone of reaccumulation. These FVGs are marked in green and correspond to areas where price left inefficiency after strong upward moves without immediate retracements.
* The most recent FVG, located just beneath current price, aligns with a minor structure support zone and overlaps partially with the lower boundary of the ascending channel. This area stands out as a prime candidate for a bullish continuation entry, particularly if price retraces and shows signs of holding.
* The middle FVG, slightly lower in the structure, represents a deeper mitigation level and could serve as a secondary entry in case the initial zone fails to hold.
* The lowest FVG is a broader inefficiency zone that formed near the base of the bullish reversal. If price returns this far, it would likely signify a temporary shift in momentum or deeper liquidity hunt before another leg upward.
Channel Structure and Momentum:
The ascending channel has been respected throughout the rally, offering visual confirmation of trend strength and the rhythm of pullbacks. The current price is near the upper boundary of the channel, and a short-term retracement is a logical expectation before continuation.
A pullback into the FVG + lower channel region would represent a convergence of structure, imbalance, and trendline support. These overlapping technical elements enhance the probability of a bounce from this zone.
Projected Path:
The chart also suggests a conservative bullish continuation projection, aiming toward the zone marked around 3449.12. This level appears to be a measured move extension and a safer target in relation to the overall structure. However, the note on the chart implies that the all-time high (ATH) could also be in play if momentum continues and market conditions remain supportive.
The key here is the behavior around the nearest FVG. If price retraces and holds this area—potentially forming a bullish engulfing or confirmation on lower timeframes—it may offer an ideal continuation entry with minimal drawdown.
Conclusion:
This Gold 1-hour chart reflects a strong bullish structure with clear institutional footprints left in the form of unmitigated FVGs. The alignment of ascending channel support and bullish imbalances creates a favorable setup for continuation traders. Watching the immediate FVG zone will be critical, as it may define the next impulsive leg toward higher targets. If that zone fails, deeper FVGs below offer secondary opportunities while maintaining the bullish bias as long as structural higher lows remain intact.

Investment Opportunity LONG GBP/AUD
The current market setup offers an interesting LONG opportunity on the GBP/AUD pair, with an entry point at 2.0586. The optimized strategy includes a Take Profit (TP) of 3% and a Stop Loss (SL) of 1%, ensuring an adequate risk/reward ratio for the management of the trade.
Technical Analysis
The GBP/AUD pair presents several bullish signals: ✅ Well-established key support in the 2.0586 area. ✅ 50-period moving average supporting the positive trend. ✅ RSI in the bullish zone, suggesting favorable momentum for a continuation of the uptrend.
Fundamental Rationale
The strategy is supported by macroeconomic and fundamental factors: 📊 The Bank of England maintains a favorable approach to the British pound. 📉 The Australian dollar shows signs of weakness related to global economic uncertainty. 🌍 UK macro data stronger than Australian, confirming the relative strength of the pound.
Trading Strategy
🔹 LONG Entry: 2.0586 🔹 Take Profit (TP): +3% from entry level, exploiting the growth potential. 🔹 Stop Loss (SL): -1%, protecting the position from excessive volatility. 🔹 Dynamic Management: Continuous monitoring for possible adjustments based on market conditions.
Conclusion
The updated strategy optimizes risk and potential reward, offering a solid setup to capitalize on the growth of GBP/AUD. As always, it is advisable to accompany the trade with effective risk management and careful monitoring of market conditions.
