BITCOIN Is Bullish! Buy!
Please, check our technical outlook for BITCOIN.
Time Frame: 2h
Current Trend: Bullish
Sentiment: Oversold (based on 7-period RSI)
Forecast: Bullish
The price is testing a key support 96,975.97.
Current market trend & oversold RSI makes me think that buyers will push the price. I will anticipate a bullish movement at least to 99,781.42 level.
P.S
Overbought describes a period of time where there has been a significant and consistent upward move in price over a period of time without much pullback.
Disclosure: I am part of Trade Nation's Influencer program and receive a monthly fee for using their TradingView charts in my analysis.
Like and subscribe and comment my ideas if you enjoy them!
Long!!!!

GBPJPY Is Going Up! Long!
Take a look at our analysis for GBPJPY.
Time Frame: 1D
Current Trend: Bullish
Sentiment: Oversold (based on 7-period RSI)
Forecast: Bullish
The market is testing a major horizontal structure 192.359.
Taking into consideration the structure & trend analysis, I believe that the market will reach 195.116 level soon.
P.S
The term oversold refers to a condition where an asset has traded lower in price and has the potential for a price bounce.
Overbought refers to market scenarios where the instrument is traded considerably higher than its fair value. Overvaluation is caused by market sentiments when there is positive news.
Disclosure: I am part of Trade Nation's Influencer program and receive a monthly fee for using their TradingView charts in my analysis.
Like and subscribe and comment my ideas if you enjoy them!

HelenP. I Euro may correct to trend line and then rebound upHi folks today I'm prepared for you Gold analytics. After a sharp, impulsive rise, price entered a broad consolidation phase between 1.1575 and 1.1270 levels, creating a horizontal channel where price oscillated for several sessions. This type of structure often serves as a re-accumulation zone during a trending market. What's particularly notable is the recent touch of the lower boundary of the range, which coincided with a retest of both the ascending trend line and the support zone around 1.1270 points. This confluence of technical factors makes the current area critical for further price development. Following the bounce from the support zone, the pair is showing early signs of recovery. The trend line has held firmly, and buyers stepped in with a reaction candle confirming demand interest. While EUR is not yet out of the consolidation, the structure suggests strength and potential continuation. Given the alignment of the upward trend line, support zone validation, and stabilization after the drop, I expect that EURUSD may climb almost toward the upper boundary of the consolidation. That's why my current goal lies at 1.1500. If you like my analytics you may support me with your like/comment ❤️

GOLD - Price can grow to $3370 resistance levelHi guys, this is my overview for XAUUSD, feel free to check it and write your feedback in comments👊
Recently, price entered to pennant, where it at once bounced from support line and started to grow, but soon corrected.
After this movement, Gold made upward impulse, and broke $3205 level, after which it made retest and continued to move up mext.
Soon, it reached $3370 level, broke it and then rose to resistance line of pennant, after which started to fall.
In a short time, price declined below $3370 level, breaking it again, and then some time traded below.
Later, Gold continued to fall and declined to support level, which coincided with support line of pennant.
Now, I think that price can bounce up from support level to $3370 level, exiting from pennant pattern.
If this post is useful to you, you can support me with like/boost and advice in comments❤️

BTC - The Perfect Retest!Hello TradingView Family / Fellow Traders! This is Richard, also known as theSignalyst.
The picture says it all!
🔄Is history about to repeat itself?
If so, we are currently in Phase 2. 📈
What’s next? A dip toward the $87,000 - $88,000 zone would be the perfect retest to look for trend-following longs and expect the start of Phase 3.
📚 Reminder:
Always stick to your trading plan — entry, risk management, and trade management are key.
Good luck, and happy trading!
All Strategies Are Good, If Managed Properly!
~Rich

EURUSD Massive Long! BUY!
My dear subscribers,
EURUSD looks like it will make a good move, and here are the details:
The market is trading on 1.1317 pivot level.
Bias - Bullish
My Stop Loss - 1.1282
Technical Indicators: Both Super Trend & Pivot HL indicate a highly probable Bullish continuation.
Target - 1.1379
About Used Indicators:
The average true range (ATR) plays an important role in 'Supertrend' as the indicator uses ATR to calculate its value. The ATR indicator signals the degree of price volatility.
Disclosure: I am part of Trade Nation's Influencer program and receive a monthly fee for using their TradingView charts in my analysis.
———————————
WISH YOU ALL LUCK

Euro can continue to move up inside upward channelHello traders, I want share with you my opinion about Euro. Looking at this chart, we can observe how the price has been moving confidently within the boundaries of a well-formed upward channel. After an extended period of consolidation inside the buyer zone, the market began forming higher lows and eventually broke out with strong bullish momentum. That breakout was followed by a smooth trend-building phase, where each correction found support at higher levels, a clear signal of growing buyer interest. As the price moved higher, it respected both the support line and the support level at 1.0910, reinforcing the structure of the channel. When the market reached the support area, it consolidated for a while before launching another impulse up, confirming the breakout and creating a new higher support zone. Now, the market has pulled back into the support zone, which aligns with the 1.1285 current support level and the lower boundary of the channel. Given the strength of the overall trend, the clear structure of the upward channel, and the reaction from a key support zone, I expect the pair to continue moving higher toward TP1 at 1.1600 points. Please share this idea with your friends and click Boost 🚀

BITCOIN - Price can exit from wedge and rose to $102K pointsHi guys, this is my overview for BTCUSDT, feel free to check it and write your feedback in comments👊
Some days ago, the price declined to $81600 level, after which it bounced and rose to $88500 points and then started to fall.
Also price entered to wedge pattern, where it fell to support line, breaking support level, but soon turned around and bounced up.
Price broke $81600 level again and continued to grow next, but later it corrected to support line.
Then, BTC rose from this line to $93000 level, broke it, and reached resistance line of wedge, after which corrected.
After correction, BTC fell to $93000 level and then rose back to resistance line of wedge, where it trades close.
In my mind, price can correct to support line and then bounce up to $102000 points, exiting from a wedge.
If this post is useful to you, you can support me with like/boost and advice in comments❤️

EURO - Price can drop to support level and then start to move upHi guys, this is my overview for EURUSD, feel free to check it and write your feedback in comments👊
Recently, price started to decline inside falling channel, where it reached support line firslty and then bounced up.
Price grew to the resistance line of the channel, which coincided with $1.0950 level, and then in a short time fell back to support line.
Next, Euro made an upward impulse, thereby exiting from channel, and also soon broke $1.0950 level.
After this, price rose a little and then made correction, after which coincided to move up inside pennant.
In the pennant pattern, the price broke $1.1320 level and later reached the resistance line, after which corrected.
Now, I think that the Euro can exit from pennant, fall to the support level, and then bounce up to $1.1510
If this post is useful to you, you can support me with like/boost and advice in comments❤️

EURAUD: Bullish Continuation & Long Signal
EURAUD
- Classic bullish formation
- Our team expects growth
SUGGESTED TRADE:
Swing Trade
Buy EURAUD
Entry Level - 1.7627
Sl - 1.7554
Tp - 1.7775
Our Risk - 1%
Start protection of your profits from lower levels
Disclosure: I am part of Trade Nation's Influencer program and receive a monthly fee for using their TradingView charts in my analysis.
❤️ Please, support our work with like & comment! ❤️

GBPAUD: Will Keep Growing! Here is Why:
The recent price action on the GBPAUD pair was keeping me on the fence, however, my bias is slowly but surely changing into the bullish one and I think we will see the price go up.
Disclosure: I am part of Trade Nation's Influencer program and receive a monthly fee for using their TradingView charts in my analysis.
❤️ Please, support our work with like & comment! ❤️

GBPCAD Will Explode! BUY!
My dear subscribers,
My technical analysis for GBPCAD is below:
The price is coiling around a solid key level - 1.8389
Bias -Bullish
Technical Indicators: Pivot Points Low anticipates a potential price reversal.
Super trend shows a clear buy, giving a perfect indicators' convergence.
Goal - 1.8459
About Used Indicators:
By the very nature of the supertrend indicator, it offers firm support and resistance levels for traders to enter and exit trades. Additionally, it also provides signals for setting stop losses
Disclosure: I am part of Trade Nation's Influencer program and receive a monthly fee for using their TradingView charts in my analysis.
———————————
WISH YOU ALL LUCK

EURJPY Will Go Up From Support! Long!
Take a look at our analysis for EURJPY.
Time Frame: 1D
Current Trend: Bullish
Sentiment: Oversold (based on 7-period RSI)
Forecast: Bullish
The market is on a crucial zone of demand 163.939.
The oversold market condition in a combination with key structure gives us a relatively strong bullish signal with goal 168.000 level.
P.S
Please, note that an oversold/overbought condition can last for a long time, and therefore being oversold/overbought doesn't mean a price rally will come soon, or at all.
Disclosure: I am part of Trade Nation's Influencer program and receive a monthly fee for using their TradingView charts in my analysis.
Like and subscribe and comment my ideas if you enjoy them!

CHF/JPY BULLS ARE STRONG HERE|LONG
CHF/JPY SIGNAL
Trade Direction: long
Entry Level: 172.570
Target Level: 175.428
Stop Loss: 170.661
RISK PROFILE
Risk level: medium
Suggested risk: 1%
Timeframe: 8h
Disclosure: I am part of Trade Nation's Influencer program and receive a monthly fee for using their TradingView charts in my analysis.
✅LIKE AND COMMENT MY IDEAS✅

XRP is Back!Hello TradingView Family / Fellow Traders. This is Richard, also known as theSignalyst.
📈XRP has been overall bullish from a medium-term perspective trading within the rising channel marked in blue.
Moreover, the green zone is a strong structure!
🏹 Thus, the highlighted blue circle is a strong area to look for buy setups as it is the intersection of structure and lower blue trendline acting as a non-horizontal support.
📚 As per my trading style:
As #XRP approaches the blue circle zone, I will be looking for bullish reversal setups (like a double bottom pattern, trendline break , and so on...)
📚 Always follow your trading plan regarding entry, risk management, and trade management.
Good luck!
All Strategies Are Good; If Managed Properly!
~Rich

SUSDT Potential UpsidesHey Traders, in today's trading session we are monitoring SUSDT for a buying opportunity around 0.4890 zone, SUSDT is trading in an uptrend and currently is in a correction phase in which it is approaching the trend at 0.4890 support and resistance area.
Trade safe, Joe.

Time to Buy BITCOIN?I hope you guys enjoyed the video; feel free to comment down below any questions you might have.

AUDCHF On The Rise! BUY!
My dear friends,
Please, find my technical outlook for AUDCHF below:
The price is coiling around a solid key level - 0.5250
Bias - Bullish
Technical Indicators: Pivot Points Low anticipates a potential price reversal.
Super trend shows a clear buy, giving a perfect indicators' convergence.
Goal - 0.5282
About Used Indicators:
The pivot point itself is simply the average of the high, low and closing prices from the previous trading day.
Disclosure: I am part of Trade Nation's Influencer program and receive a monthly fee for using their TradingView charts in my analysis.
———————————
WISH YOU ALL LUCK

NZDJPY What Next? BUY!
My dear subscribers,
NZDJPY looks like it will make a good move, and here are the details:
The market is trading on 84.472 pivot level.
Bias - Bullish
Technical Indicators: Both Super Trend & Pivot HL indicate a highly probable Bullish continuation.
Target - 84.990
About Used Indicators:
The average true range (ATR) plays an important role in 'Supertrend' as the indicator uses ATR to calculate its value. The ATR indicator signals the degree of price volatility.
Disclosure: I am part of Trade Nation's Influencer program and receive a monthly fee for using their TradingView charts in my analysis.
———————————
WISH YOU ALL LUCK

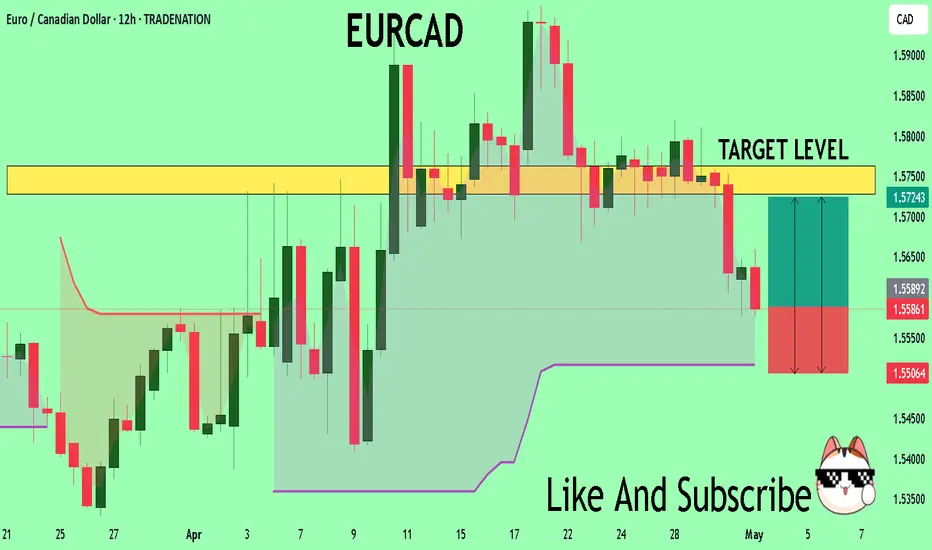
EURCAD Sellers In Panic! BUY!
My dear friends,
My technical analysis for EURCAD is below:
The market is trading on 1.5585 pivot level.
Bias - Bullish
Technical Indicators: Both Super Trend & Pivot HL indicate a highly probable Bullish continuation.
Target - 1.5728
Recommended Stop Loss - 1.5506
About Used Indicators:
A pivot point is a technical analysis indicator, or calculations, used to determine the overall trend of the market over different time frames.
Disclosure: I am part of Trade Nation's Influencer program and receive a monthly fee for using their TradingView charts in my analysis.
———————————
WISH YOU ALL LUCK
NZDCAD: Bullish Continuation is Highly Probable! Here is Why:
It is essential that we apply multitimeframe technical analysis and there is no better example of why that is the case than the current NZDCAD chart which, if analyzed properly, clearly points in the upward direction.
Disclosure: I am part of Trade Nation's Influencer program and receive a monthly fee for using their TradingView charts in my analysis.
❤️ Please, support our work with like & comment! ❤️

NZDUSD: Market of Buyers
The analysis of the NZDUSD chart clearly shows us that the pair is finally about to go up due to the rising pressure from the buyers.
Disclosure: I am part of Trade Nation's Influencer program and receive a monthly fee for using their TradingView charts in my analysis.
❤️ Please, support our work with like & comment! ❤️

GOLD: Bullish Continuation & Long Trade
GOLD
- Classic bullish formation
- Our team expects pullback
SUGGESTED TRADE:
Swing Trade
Long GOLD
Entry - 3219.9
Sl - 3207.5
Tp - 3246.2
Our Risk - 1%
Start protection of your profits from lower levels
Disclosure: I am part of Trade Nation's Influencer program and receive a monthly fee for using their TradingView charts in my analysis.
❤️ Please, support our work with like & comment! ❤️
