GOLD: Long Signal Explained
GOLD
- Classic bullish formation
- Our team expects pullback
SUGGESTED TRADE:
Swing Trade
Long GOLD
Entry - 3306.4
Sl - 3294.6
Tp - 3332.6
Our Risk - 1%
Start protection of your profits from lower levels
Disclosure: I am part of Trade Nation's Influencer program and receive a monthly fee for using their TradingView charts in my analysis.
❤️ Please, support our work with like & comment! ❤️
Long!!!!

High Probability BUY Zone at The Edge📍 XAUUSD – High Probability BUY Zone at The Edge
Gold is currently reacting at a high probability BUY area, supported by multiple technical confluences:
✅ $3,300 Round Number: Psychological level and historical reaction zone
✅ Completion of 2nd Bearish Leg: A classic two-leg correction often signals exhaustion
✅ Retest of Uptrend Boundary: Long-term ascending trendline that has supported price since March
📌 Entry: Current price zone
🎯 TP1: Local highs ($3,353)
🎯 TP2: Mid-channel or upper resistance zone ($3,398)
❌ SL: 3263
This is a textbook trend continuation setup — the structure remains bullish unless proven otherwise.
Wait for confirmation or manage your risk accordingly.
—
#XAUUSD #Gold #ForexTrading #MJTrading #TechnicalAnalysis #BuyZone #SwingTrade #SupportZone #TrendlineSupport #SmartMoney #PriceAction #ForexSignals #CommodityTrading #MarketStructure #RiskReward #ChartSetup #ForexCommunity


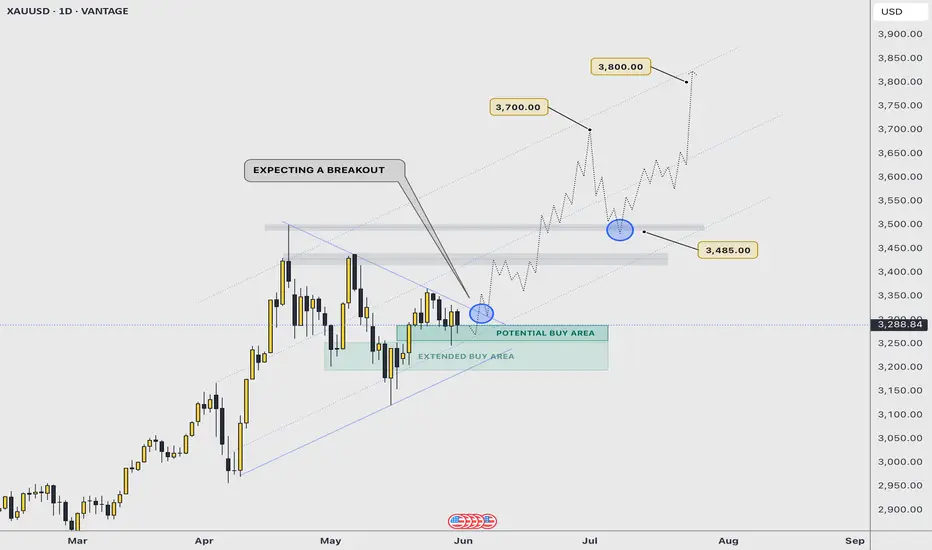
BREAKOUT SOON | $3700 - $3800 As illustrated, I’m visualising the next potential bullish continuation impulse that would take gold near the $4000 projected price.
In this idea, the path projected is based on the breakout of a rising symmetrical triangle that price formed; a strong bullish pattern that tends to be very effective when price successfully breaks out with strength.
On a fundamental aspect, things continue to hold the yellow metal on a positive route to maintain its bullish momentum and direction. Fed rates decision is getting close, and that is just the tip of the iceberg that’s going to move gold to record highs within weeks.
A key and major pivot area is near the $3200 - $3250 price range; so it’s possible we have one more attempt to break $3200.
—
GOOD LUCK
persaxu
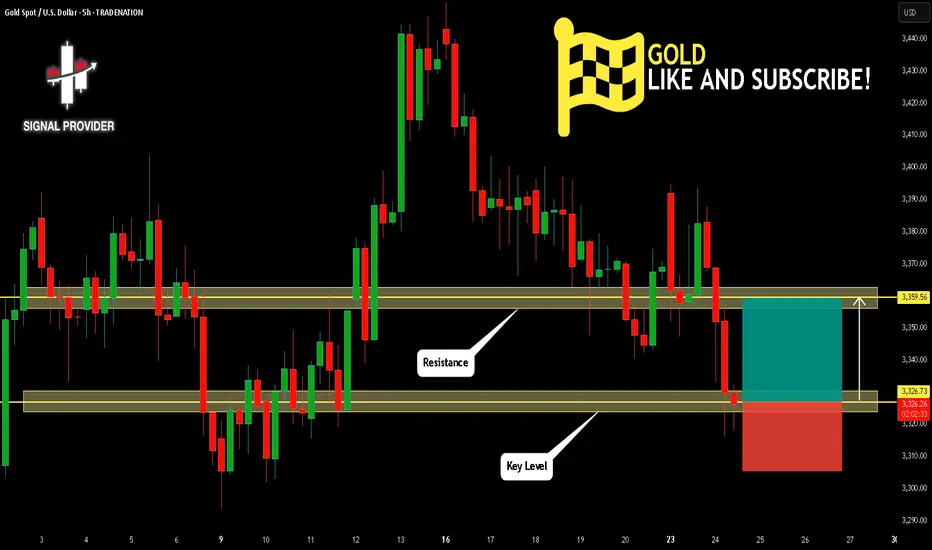
GOLD Will Go Higher! Long!
Here is our detailed technical review for GOLD.
Time Frame: 5h
Current Trend: Bullish
Sentiment: Oversold (based on 7-period RSI)
Forecast: Bullish
The market is trading around a solid horizontal structure 3,326.73.
The above observations make me that the market will inevitably achieve 3,359.56 level.
P.S
We determine oversold/overbought condition with RSI indicator.
When it drops below 30 - the market is considered to be oversold.
When it bounces above 70 - the market is considered to be overbought.
Disclosure: I am part of Trade Nation's Influencer program and receive a monthly fee for using their TradingView charts in my analysis.
Like and subscribe and comment my ideas if you enjoy them!
USDJPY Will Go Up! Buy!
Take a look at our analysis for USDJPY.
Time Frame: 9h
Current Trend: Bullish
Sentiment: Oversold (based on 7-period RSI)
Forecast: Bullish
The market is testing a major horizontal structure 145.018.
Taking into consideration the structure & trend analysis, I believe that the market will reach 146.793 level soon.
P.S
Overbought describes a period of time where there has been a significant and consistent upward move in price over a period of time without much pullback.
Disclosure: I am part of Trade Nation's Influencer program and receive a monthly fee for using their TradingView charts in my analysis.
Like and subscribe and comment my ideas if you enjoy them!

US30 - Intraday long scalp then short Looking for that intraday scalp on the long around 120 points can hold potentially further up to our higher supply level. If bearish PA is confirmed around the 43,000 level can look to take this short. All dependent on PA.

BTC Flips Bullish Above $104k — 1D 50EMA & OB Cluster HoldCRYPTOCAP:BTC | #4h
Price reclaimed 1D 50EMA & $104k after a clean bounce from 1D FVG ($98k).
As long as $104k and the 4h OB cluster hold, lower targets are off the table.
Maintaining bullish bias toward $106k+.
Lose $104k? Bull plan is invalid, reassess for lower.

MODV - Bull SSS Flag - Long setupMODV - Currently, we have multiple indicators in multiple time frames. We have smart money divergence, Smart surge both daily and weekly. Positive money flow on both daily and weekly. Holding a 9-day exponential moving average. Multiple institutional buys in early 2025 and late 2024.

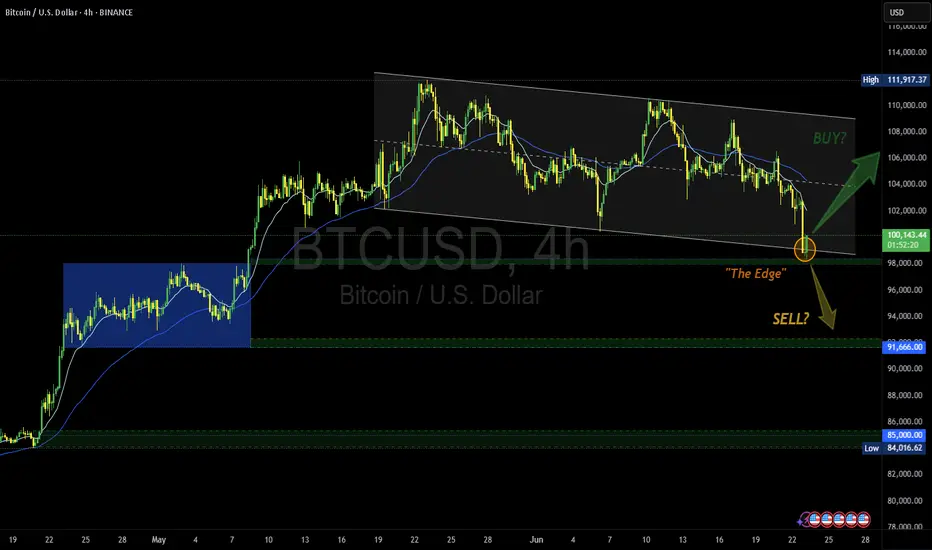
Another Edge - Decision time | Buy? or Sell? share your opinionTitle: BTCUSD: At The Edge – Decision Time Looms
Idea: Bitcoin is currently flirting with "The Edge"—a key decision zone near $98,000 where trend dynamics could shift sharply. After touching the lower boundary of a descending channel, BTC is testing support that could mark either a springboard for a bullish reversal or a trapdoor for further downside.
If bulls reclaim territory above the descending resistance line and push toward $104,000, we may see a trend breakout and renewed upside momentum. Confirmation with volume would strengthen the case for a long position, targeting the $111,917 level.
However, failure to hold "The Edge" could open the door to a swift move lower toward the $91,666 then $85,000 support zone, especially if accompanied by broader risk-off sentiment.
Trade Plan:
• Long above $100K with confirmation and strong volume;
target $111,917.
Stop below $97K.
• Short on breakdown below $97K with bearish momentum;
target $91,666.
Stop above $100K.
Watching: Volume spikes, macro news, and behavior around the channel boundaries.
🚀 Will Bitcoin bounce off the edge—or fall into the abyss?
#MJTrading #BTC #Bitcoin #Buy #long #chart #signal #forex
XAGUSD - Buy for RR1XAGUSD – Positioning for a Continuation Push 🚀
Silver's recent structure shows bulls defending the 35.5 region with conviction. After a healthy consolidation, price has reclaimed short-term momentum, eyeing a return to previous highs.
I'm entering long from 36.147, expecting bullish continuation toward the next key resistance level.
Entry: 36.147
Take Profit (TP): 37.0
Stop Loss (SL): 35.4
RR:1
Let’s see how price action unfolds — I’ll be watching closely for momentum confirmation.
#XAGUSD #SILVER #MJTRADING #FOREX #SIGNALS

After 45% Profit On Last Trade, I Am Re-entering UMACTrading Family,
On our stock trades, using my new liquidity indicator, we have been solidly beating the market with a cool 15% profit since our first trade with it. If you had held the SPY from the same time, your profit would have been a more meager 6.5%. Our indicator is proving beneficial, to say the least. And the last time it gave me a buy signal on UMAC, we banked 45% in profit on my last exit. I then determined that if it did not give me a sell signal (it hasn't), I would look to re-enter at that 7.66 level. We have reached that level, and I have dipped my toes back in at 7.94. I would look to double up my position if we drop even further to that 6.44 level, but I don't know that we will. My target of 11.76 will give us another 48% profit on this trade, and I have a SL set at 6.18 for a nice 2.17 rrr.
Let's go!
Stew

AUDCAD: Long Signal with Entry/SL/TP
AUDCAD
- Classic bullish pattern
- Our team expects retracement
SUGGESTED TRADE:
Swing Trade
Buy AUDCAD
Entry - 0.8836
Stop -0.8817
Take - 0.8871
Our Risk - 1%
Start protection of your profits from lower levels
Disclosure: I am part of Trade Nation's Influencer program and receive a monthly fee for using their TradingView charts in my analysis.
❤️ Please, support our work with like & comment! ❤️

AUDCHF: Growth & Bullish Forecast
Looking at the chart of AUDCHF right now we are seeing some interesting price action on the lower timeframes. Thus a local move up seems to be quite likely.
Disclosure: I am part of Trade Nation's Influencer program and receive a monthly fee for using their TradingView charts in my analysis.
❤️ Please, support our work with like & comment! ❤️

USOIL Is Very Bullish! Long!
Take a look at our analysis for USOIL.
Time Frame: 1D
Current Trend: Bullish
Sentiment: Oversold (based on 7-period RSI)
Forecast: Bullish
The market is on a crucial zone of demand 73.546.
The oversold market condition in a combination with key structure gives us a relatively strong bullish signal with goal 79.365 level.
P.S
We determine oversold/overbought condition with RSI indicator.
When it drops below 30 - the market is considered to be oversold.
When it bounces above 70 - the market is considered to be overbought.
Disclosure: I am part of Trade Nation's Influencer program and receive a monthly fee for using their TradingView charts in my analysis.
Like and subscribe and comment my ideas if you enjoy them!

EURNZD Will Go Higher From Support! Buy!
Take a look at our analysis for EURNZD.
Time Frame: 1h
Current Trend: Bullish
Sentiment: Oversold (based on 7-period RSI)
Forecast: Bullish
The market is on a crucial zone of demand 1.922.
The oversold market condition in a combination with key structure gives us a relatively strong bullish signal with goal 1.930 level.
P.S
We determine oversold/overbought condition with RSI indicator.
When it drops below 30 - the market is considered to be oversold.
When it bounces above 70 - the market is considered to be overbought.
Disclosure: I am part of Trade Nation's Influencer program and receive a monthly fee for using their TradingView charts in my analysis.
Like and subscribe and comment my ideas if you enjoy them!

EURJPY Is Going Up! Long!
Please, check our technical outlook for EURJPY.
Time Frame: 4h
Current Trend: Bullish
Sentiment: Oversold (based on 7-period RSI)
Forecast: Bullish
The price is testing a key support 166.677.
Current market trend & oversold RSI makes me think that buyers will push the price. I will anticipate a bullish movement at least to 167.654 level.
P.S
The term oversold refers to a condition where an asset has traded lower in price and has the potential for a price bounce.
Overbought refers to market scenarios where the instrument is traded considerably higher than its fair value. Overvaluation is caused by market sentiments when there is positive news.
Disclosure: I am part of Trade Nation's Influencer program and receive a monthly fee for using their TradingView charts in my analysis.
Like and subscribe and comment my ideas if you enjoy them!

EURUSD Long As the war escalated over the weekend market gapped during Asia session invalidating our initial forecast. (Linked Idea). Looking for the long on EURUSD.

GBP/CAD BULLS ARE GAINING STRENGTH|LONG
Hello, Friends!
GBP/CAD is trending up which is evident from the green colour of the previous weekly candle. However, the price has locally plunged into the oversold territory. Which can be told from its proximity to the BB lower band. Which presents a beautiful trend following opportunity for a long trade from the support line below towards the supply level of 1.850.
Disclosure: I am part of Trade Nation's Influencer program and receive a monthly fee for using their TradingView charts in my analysis.
✅LIKE AND COMMENT MY IDEAS✅

BITCOIN SENDS CLEAR BULLISH SIGNALS|LONG
BITCOIN SIGNAL
Trade Direction: long
Entry Level: 104,672.03
Target Level: 107,484.65
Stop Loss: 102,785.72
RISK PROFILE
Risk level: medium
Suggested risk: 1%
Timeframe: 3h
Disclosure: I am part of Trade Nation's Influencer program and receive a monthly fee for using their TradingView charts in my analysis.
✅LIKE AND COMMENT MY IDEAS✅

CRV Approaching Demand — Bottom Fishing in the $0.40–$0.49 Zone🎯 BINANCE:CRVUSDT Trading Plan:
Scenario 1 (Reversal from Demand):
Look for bullish SFP, engulfing, or reclaim in $0.40–$0.49 zone
If confirmed, long with first target $0.83
Tight stop below $0.39
Scenario 2 (Breakdown):
If $0.39 breaks decisively, step aside — risk of new lows
🔔 Triggers & Confirmations:
Enter only with clear bullish trigger on LTF (H1/H4)
No trade if price grinds below $0.40
📝 Order Placement & Management:
🟩 Buy Zone: $0.40–$0.49 (alerts on wicks into zone)
🛡️ Stop: Below $0.39
🎯 Target: $0.83
🚨 Risk Warning:
Only bottom fishing with confirmation — avoid knife catching

GBPUSD: Bullish Continuation & Long Signal
GBPUSD
- Classic bullish setup
- Our team expects bullish continuation
SUGGESTED TRADE:
Swing Trade
Long GBPUSD
Entry Point - 1.3449
Stop Loss - 1.3413
Take Profit - 1.3520
Our Risk - 1%
Start protection of your profits from lower levels
Disclosure: I am part of Trade Nation's Influencer program and receive a monthly fee for using their TradingView charts in my analysis.
❤️ Please, support our work with like & comment! ❤️

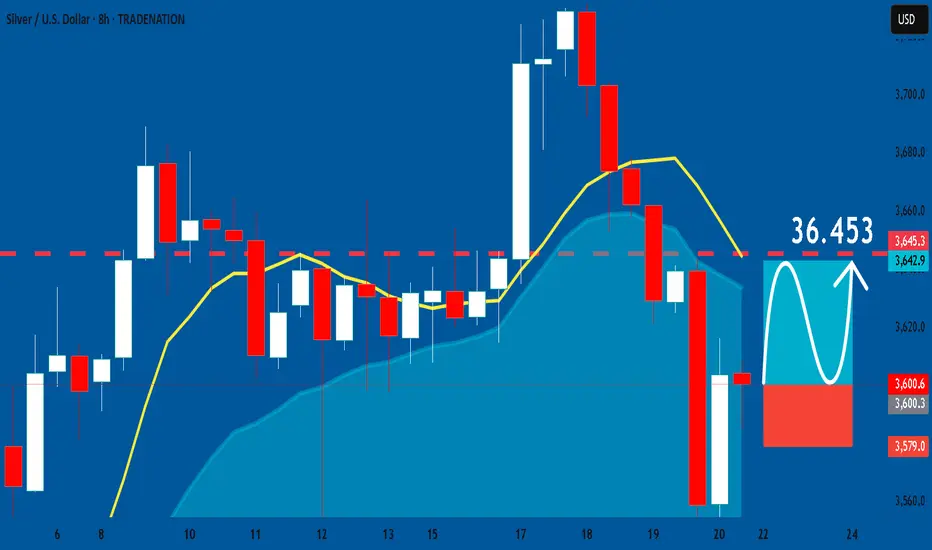
SILVER: Long Trading Opportunity
SILVER
- Classic bullish formation
- Our team expects growth
SUGGESTED TRADE:
Swing Trade
Buy SILVER
Entry Level -36.006
Sl - 35.790
Tp - 36.453
Our Risk - 1%
Start protection of your profits from lower levels
Disclosure: I am part of Trade Nation's Influencer program and receive a monthly fee for using their TradingView charts in my analysis.
❤️ Please, support our work with like & comment! ❤️