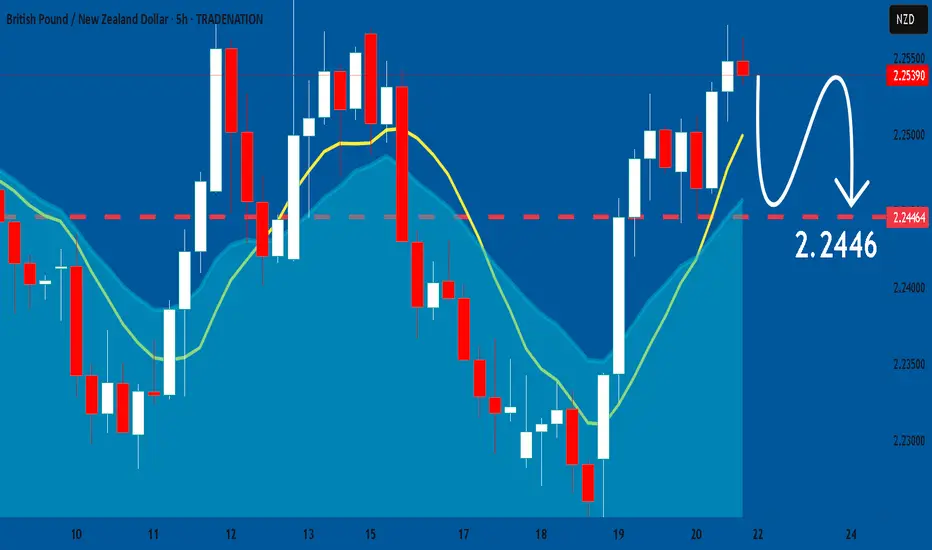
GBPNZD: Market Sentiment & Forecast
Looking at the chart of GBPNZD right now we are seeing some interesting price action on the lower timeframes. Thus a local move down seems to be quite likely.
Disclosure: I am part of Trade Nation's Influencer program and receive a monthly fee for using their TradingView charts in my analysis.
❤️ Please, support our work with like & comment! ❤️
Long!!!!
NATGAS: Expecting Bullish Movement! Here is Why:
Remember that we can not, and should not impose our will on the market but rather listen to its whims and make profit by following it. And thus shall be done today on the NATGAS pair which is likely to be pushed up by the bulls so we will buy!
Disclosure: I am part of Trade Nation's Influencer program and receive a monthly fee for using their TradingView charts in my analysis.
❤️ Please, support our work with like & comment! ❤️

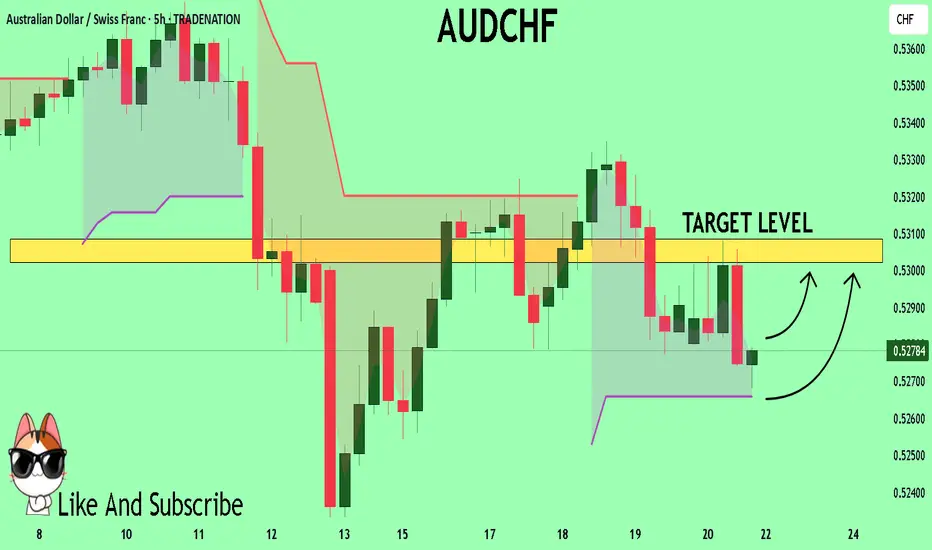
AUDCHF Technical Analysis! BUY!
My dear friends,
Please, find my technical outlook for AUDCHF below:
The instrument tests an important psychological level 0.5278
Bias - Bullish
Technical Indicators: Supper Trend gives a precise Bullish signal, while Pivot Point HL predicts price changes and potential reversals in the market.
Target - 0.5302
About Used Indicators:
Super-trend indicator is more useful in trending markets where there are clear uptrends and downtrends in price.
Disclosure: I am part of Trade Nation's Influencer program and receive a monthly fee for using their TradingView charts in my analysis.
———————————
WISH YOU ALL LUCK
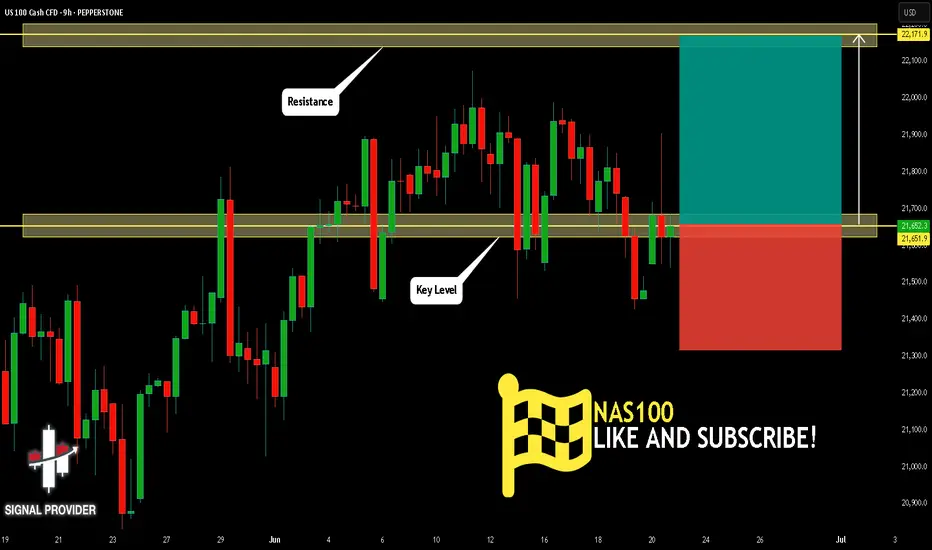
NAS100 Will Go Up From Support! Buy!
Please, check our technical outlook for NAS100.
Time Frame: 9h
Current Trend: Bullish
Sentiment: Oversold (based on 7-period RSI)
Forecast: Bullish
The market is approaching a key horizontal level 21,651.9.
Considering the today's price action, probabilities will be high to see a movement to 22,171.9.
P.S
We determine oversold/overbought condition with RSI indicator.
When it drops below 30 - the market is considered to be oversold.
When it bounces above 70 - the market is considered to be overbought.
Disclosure: I am part of Trade Nation's Influencer program and receive a monthly fee for using their TradingView charts in my analysis.
Like and subscribe and comment my ideas if you enjoy them!
AUDUSD Potential Long - Dependent on PA Market openAUD/USD Long Setup – 15M Chart Analysis
Looking at a potential long on AUD/USD after price tapped into demand and swept liquidity. The area aligns with a fair value gap and previous order block, suggesting interest from larger players.
Two Entry Options:
1. Aggressive: Buy limit at the order block (riskier, no confirmation).
2. Conservative: Wait for break of structure, then retest into FVG with bullish price action for confirmation.
Targets:
Target 1: 0.6470
Target 2: 0.6480
Target 3: 0.6490
Extended Target: 0.6530 (only if 0.6490 is breached and price holds above)
Important Notes:
This setup is forecast-based and depends on how price opens and reacts.
Entry should follow a clear confirmation, especially after a liquidity sweep.
Ideal confirmation: Break of structure followed by a retest with bullish PA on lower timeframes (M5/M1).
Invalidation: A clean break and close below 0.6430 would invalidate this idea.
Stay disciplined. Trade the plan, not the prediction.

GeoVax Looking long to $1.60Looking to the upside around $1.60. Break above the lower high structure. Pulled back into a key zone, looking for buy opportunity.

gold bullish trading idea gold trading idea gold follow bullish channel gold make higher high and higher low now gold make higher high 3480

EURUSD M15 Forecast - Check related IdeaAs explained in previous post we are expecting a pull back down to our order block (H4) then a bullish reversal to retest last weeks highs (1.16) region. If price breaks and closes above the M15 supply zone will have to re-evaluate and potentially take a long position from a retest into a FVG.

EURUSD to Retest 1.16 regionWatching the 1.1490–1.1450 zone for a potential bullish reaction. This area includes a 4H Fair Value Gap and Order Block. If price gives a 15M CoCH within this range, I’ll look to enter long.
Targets: 1.1540, 1.1570, and 1.1610
Invalidation below 1.1440
Patience until price delivers a clear setup.

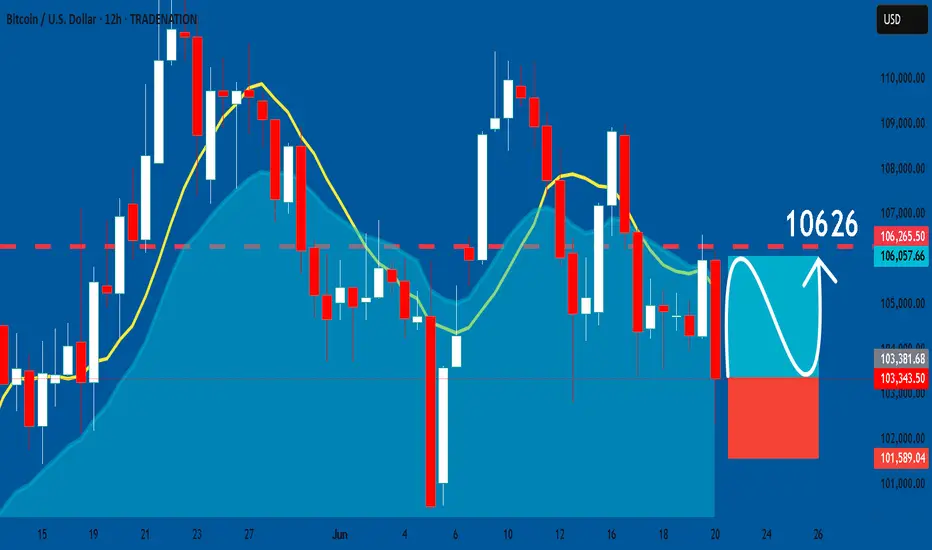
BTCUSD: Trading Signal From Our Team
BTCUSD
- Classic bullish formation
- Our team expects pullback
SUGGESTED TRADE:
Swing Trade
Long BTCUSD
Entry - 10334
Sl - 10158
Tp - 10626
Our Risk - 1%
Start protection of your profits from lower levels
Disclosure: I am part of Trade Nation's Influencer program and receive a monthly fee for using their TradingView charts in my analysis.
❤️ Please, support our work with like & comment! ❤️
NZDUSD Expected Growth! BUY!
My dear subscribers,
My technical analysis for NZDUSD is below:
The price is coiling around a solid key level - 0.5966
Bias - Bullish
Technical Indicators: Pivot Points Highanticipates a potential price reversal.
Super trend shows a clear buy, giving a perfect indicators' convergence.
Goal - 0.6001
My Stop Loss - 0.5946
About Used Indicators:
By the very nature of the supertrend indicator, it offers firm support and resistance levels for traders to enter and exit trades. Additionally, it also provides signals for setting stop losses
Disclosure: I am part of Trade Nation's Influencer program and receive a monthly fee for using their TradingView charts in my analysis.
———————————
WISH YOU ALL LUCK

SPY: Expecting Bullish Continuation! Here is Why:
Balance of buyers and sellers on the SPY pair, that is best felt when all the timeframes are analyzed properly is shifting in favor of the buyers, therefore is it only natural that we go long on the pair.
Disclosure: I am part of Trade Nation's Influencer program and receive a monthly fee for using their TradingView charts in my analysis.
❤️ Please, support our work with like & comment! ❤️

SILVER On The Rise! BUY!
My dear followers,
I analysed this chart on SILVER and concluded the following:
The market is trading on 36.006 pivot level.
Bias - Bullish
Technical Indicators: Both Super Trend & Pivot HL indicate a highly probable Bullish continuation.
Target - 36.456
About Used Indicators:
A super-trend indicator is plotted on either above or below the closing price to signal a buy or sell. The indicator changes color, based on whether or not you should be buying. If the super-trend indicator moves below the closing price, the indicator turns green, and it signals an entry point or points to buy.
Disclosure: I am part of Trade Nation's Influencer program and receive a monthly fee for using their TradingView charts in my analysis.
———————————
WISH YOU ALL LUCK

NZDUSD My Opinion! BUY!
My dear subscribers,
My technical analysis for NZDUSD is below:
The price is coiling around a solid key level - 0.6015
Bias - Bullish
Technical Indicators: Pivot Points High anticipates a potential price reversal.
Super trend shows a clear buy, giving a perfect indicators' convergence.
Goal - 0.6043
My Stop Loss - 0.5999
About Used Indicators:
By the very nature of the supertrend indicator, it offers firm support and resistance levels for traders to enter and exit trades. Additionally, it also provides signals for setting stop losses
Disclosure: I am part of Trade Nation's Influencer program and receive a monthly fee for using their TradingView charts in my analysis.
———————————
WISH YOU ALL LUCK

APPLE Trading Opportunity! BUY!
My dear followers,
This is my opinion on the APPLE next move:
The asset is approaching an important pivot point 196.46
Bias - Bullish
Safe Stop Loss - 193.21
Technical Indicators: Supper Trend generates a clear long signal while Pivot Point HL is currently determining the overall Bullish trend of the market.
Goal - 202.06
About Used Indicators:
For more efficient signals, super-trend is used in combination with other indicators like Pivot Points.
Disclosure: I am part of Trade Nation's Influencer program and receive a monthly fee for using their TradingView charts in my analysis.
———————————
WISH YOU ALL LUCK

GBPCHF Will Explode! BUY!
My dear subscribers,
GBPCHF looks like it will make a good move, and here are the details:
The market is trading on 1.0989 pivot level.
Bias - Bullish
My Stop Loss - 1.0948
Technical Indicators: Both Super Trend & Pivot HL indicate a highly probable Bullish continuation.
Target - 1.1062
About Used Indicators:
The average true range (ATR) plays an important role in 'Supertrend' as the indicator uses ATR to calculate its value. The ATR indicator signals the degree of price volatility.
Disclosure: I am part of Trade Nation's Influencer program and receive a monthly fee for using their TradingView charts in my analysis.
———————————
WISH YOU ALL LUCK

AGT/USDT AGT/USDT Cup and handle chart
please long from current price and wait few days you will get very handsome profit in this trade

HelenP. I Bitcoin can correct to trend line and start move upHi folks today I'm prepared for you Bitcoin analytics. In this chart, we can observe how the price developed a gradual upward trend, respecting the trend line as dynamic support multiple times. After each interaction with this line, the price showed a consistent pattern of rebounding and continuing its upward movement. Recently, the price faced a notable correction, which pushed it back toward this trend line once again, a critical zone that has proven its relevance as a support area. Upon touching the line, the market reacted with a bounce, signaling that buyers are still active and defending the structure. The price began to climb again, regaining some momentum, though it hasn’t yet managed to break the previous highs. Now BTCUSD is hovering near the ascending trend line, preparing for what could be another retest. If the trend holds, we may see a short-term decline toward this line, followed by a bullish rebound. I expect the price to push higher from this level, targeting the resistance zone near 108300, which also acted as a rejection area in the past. If you like my analytics you may support me with your like/comment ❤️
Disclaimer: As part of ThinkMarkets’ Influencer Program, I am sponsored to share and publish their charts in my analysis.

Gold may exit from pennant and rise to resistance levelHello traders, I want share with you my opinion about Gold. The price previously made a strong impulse upward, forming a downward pennant, but this move lost steam after touching the seller zone around 3430 - 3440. From there, the market reversed and dropped sharply below the support level, even creating a visible gap. Didn’t last long, the price recovered quickly and made another strong move up, breaking out of the downward pennant structure. Since then, Gold has been trading inside a new formation, an upward pennant, where both support and resistance lines are gradually converging. This setup suggests growing pressure and the potential for a breakout. Currently, the price is hovering near the support line of this upward pennant. In my opinion, we may see a small correction to test this support, followed by a bullish rebound. If the structure holds, Gold could break out upward and head directly toward the 3430 resistance level, which matches the upper boundary of the previous seller zone — this is my TP 1. Given the strong impulse structure and continuation pattern, I remain bullish and expect further growth after this local retest. Please share this idea with your friends and click Boost 🚀
Disclaimer: As part of ThinkMarkets’ Influencer Program, I am sponsored to share and publish their charts in my analysis.

AUDUSD Trading Opportunity! BUY!
My dear subscribers,
This is my opinion on the AUDUSD next move:
The instrument tests an important psychological level 0.6464
Bias - Bullish
Technical Indicators: Supper Trend gives a precise Bullish signal, while Pivot Point HL predicts price changes and potential reversals in the market.
Target - 0.6495
About Used Indicators:
On the subsequent day, trading above the pivot point is thought to indicate ongoing bullish sentiment, while trading below the pivot point indicates bearish sentiment.
Disclosure: I am part of Trade Nation's Influencer program and receive a monthly fee for using their TradingView charts in my analysis.
———————————
WISH YOU ALL LUCK

ETH - Do you Notice a Pattern here? I DO...Hello TradingView Family / Fellow Traders. This is Richard, also known as theSignalyst.
📈I find ETH 4h chart as it looks like history repeating itself.
Previously in 1 to 5 June, it formed a slight lower low before starting the next big bullish impulse leading towards the upper bound of the channel.
📚 Today, ETH just formed the slight lower low we are looking for.
Is it time for the next bullish impulse to start? well it will be confirmed after breaking above the last major high at $2,600.
What do you think?
📚 Always follow your trading plan regarding entry, risk management, and trade management.
Good luck!
All Strategies Are Good; If Managed Properly!
~Rich

SILVER Is Very Bullish! Long!
Take a look at our analysis for SILVER.
Time Frame: 4h
Current Trend: Bullish
Sentiment: Oversold (based on 7-period RSI)
Forecast: Bullish
The market is testing a major horizontal structure 3,603.0.
Taking into consideration the structure & trend analysis, I believe that the market will reach 3,697.2 level soon.
P.S
Overbought describes a period of time where there has been a significant and consistent upward move in price over a period of time without much pullback.
Disclosure: I am part of Trade Nation's Influencer program and receive a monthly fee for using their TradingView charts in my analysis.
Like and subscribe and comment my ideas if you enjoy them!

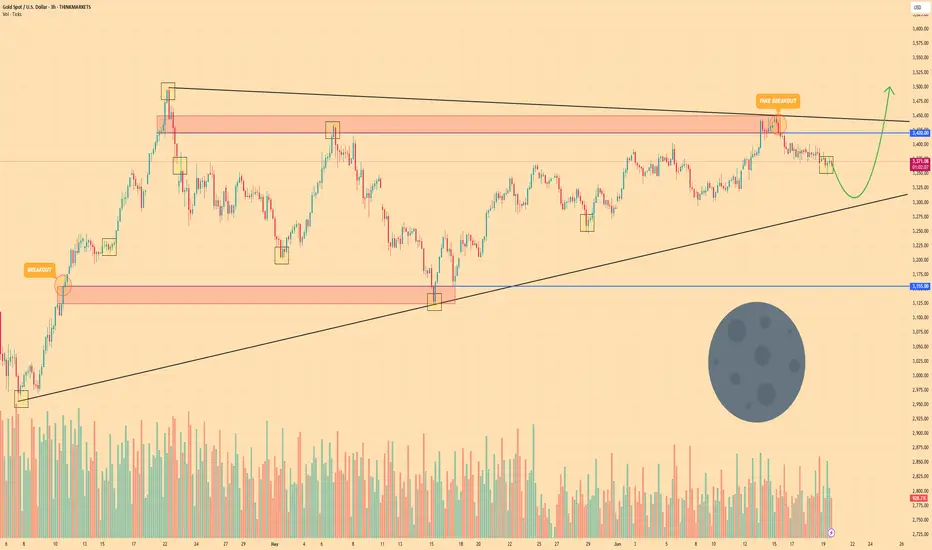
GOLD - Price may bounce up from wedge to $3500 points Hi guys, this is my overview for XAUUSD, feel free to check it and write your feedback in comments👊
A few moments ago, price entered to wedge, where it at once made an upward impulse from the support line.
Price broke $3155 with $3420 level and reached resistance line, but soon turned around and started to decline.
After this, Gold broke the $3420 level one more time and later tried to grow, but when it reached the resistance zone, it dropped.
Next, price bounced from support line of wedge and started to grow and in a short time rose to $3420 level.
Recently, it declined below, making a fake breakout of the resistance level, and now it continues to decline.
In my mind, Gold can decline a little more and then bounce up to $3500, breaking the resistance level.
If this post is useful to you, you can support me with like/boost and advice in comments❤️
Disclaimer: As part of ThinkMarkets’ Influencer Program, I am sponsored to share and publish their charts in my analysis.