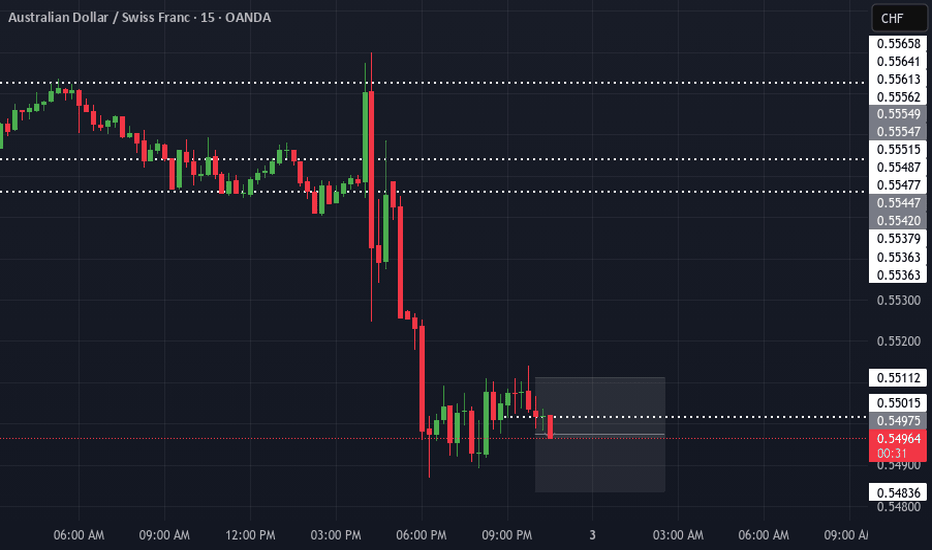
GBP/NZD BULLISH BIAS RIGHT NOW| LONG
Hello, Friends!
GBP/NZD is making a bearish pullback on the 1H TF and is nearing the support line below while we are generally bullish biased on the pair due to our previous 1W candle analysis, thus making a trend-following long a good option for us with the target being the 2.264 level.
Disclosure: I am part of Trade Nation's Influencer program and receive a monthly fee for using their TradingView charts in my analysis.
✅LIKE AND COMMENT MY IDEAS✅
Long!!!!
NZDJPY The Target Is UP! BUY!
My dear subscribers,
My technical analysis for NZDJPY is below:
The price is coiling around a solid key level - 85.141
Bias - Bullish
Technical Indicators: Pivot Points Low anticipates a potential price reversal.
Super trend shows a clear buy, giving a perfect indicators' convergence.
Goal - 86.026
My Stop Loss - 85.089
About Used Indicators:
By the very nature of the supertrend indicator, it offers firm support and resistance levels for traders to enter and exit trades. Additionally, it also provides signals for setting stop losses
Disclosure: I am part of Trade Nation's Influencer program and receive a monthly fee for using their TradingView charts in my analysis.
———————————
WISH YOU ALL LUCK
NZDUSD Technical Analysis! BUY!
My dear subscribers,
This is my opinion on the NZDUSD next move:
The instrument tests an important psychological level 0.5666
Bias - Bullish
Technical Indicators: Supper Trend gives a precise Bullish signal, while Pivot Point HL predicts price changes and potential reversals in the market.
Target - 0.5722
My Stop Loss - 0.5632
About Used Indicators:
On the subsequent day, trading above the pivot point is thought to indicate ongoing bullish sentiment, while trading below the pivot point indicates bearish sentiment.
Disclosure: I am part of Trade Nation's Influencer program and receive a monthly fee for using their TradingView charts in my analysis.
———————————
WISH YOU ALL LUCK
USDJPY: Long Signal with Entry/SL/TP
USDJPY
- Classic bullish setup
- Our team expects bullish continuation
SUGGESTED TRADE:
Swing Trade
Long USDJPY
Entry Point - 149.48
Stop Loss - 148.96
Take Profit - 150.43
Our Risk - 1%
Start protection of your profits from lower levels
Disclosure: I am part of Trade Nation's Influencer program and receive a monthly fee for using their TradingView charts in my analysis.
❤️ Please, support our work with like & comment! ❤️
EURO - Price can bounce from support level to top part of flatHi guys, this is my overview for EURUSD, feel free to check it and write your feedback in comments👊
Some days ago, price entered a wedge pattern, bounced down from the resistance line to the support line, and broke the $1.0415 level.
Next, the price turned around and started to grow. In a short time, it rose to the $1.0415 level and broke one more time.
Then, price some time traded between resistance line with $1.0415 level and later corrected to support line of wedge.
After this, EUR made a strong upward impulse, thereby exiting from wedge pattern and starting to trades inside flat.
In flat, price reached top part and then made a correction movement to $1.0735 support level and turned around.
In my mind, Euro can correct to support level and then rise to $1.0950 top part of flat.
If this post is useful to you, you can support me with like/boost and advice in comments❤️
The analysis focuses on the short-term to medium-term timeframe.The analysis focuses on the short-term to medium-term timeframe.
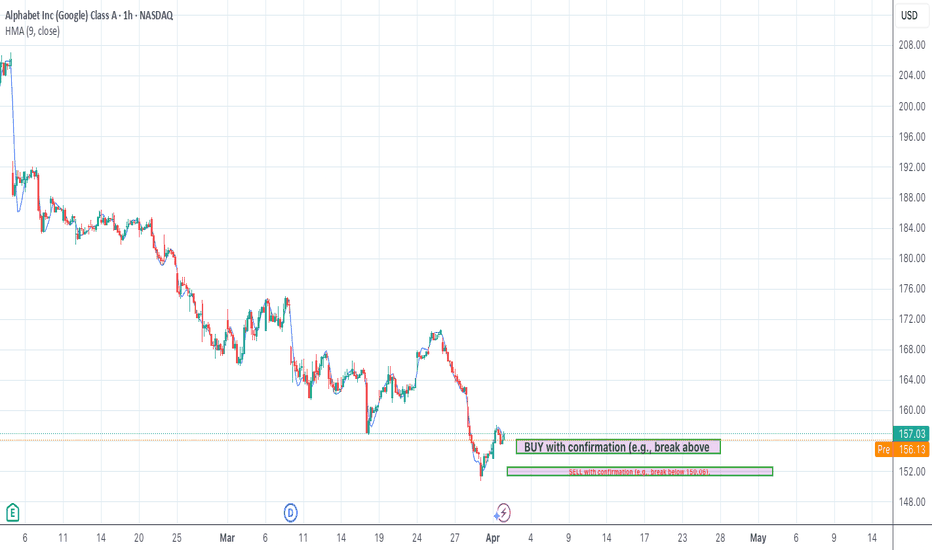
Tug-of-War Between Bulls and Bears: At the current price of 157.04, the market is in a tug-of-war between buyers (bulls) and sellers (bears).
Bulls are defending key support levels near 152.48 (Fibonacci 100% retracement of Wave C) and 154.34 (Expanded Flat target). A hold above these levels could signal a potential reversal.
Bears are attacking resistance levels at 160.31 (Fibonacci 100% projection of Wave C) and 162.82 (Expanded Flat target). A break below 152.48 could accelerate downward momentum.
Recent Price History: The market has been in a downtrend recently, with the price dropping from 191.18 (July 10, 2024) to 157.04. Key Fibonacci levels (e.g., 161.8% retracement at 159.84) and Elliott Wave patterns (e.g., Diagonal Ending Downward Candidate) have guided this decline. Momentum indicators (e.g., RSI at 47.51) suggest the downtrend may be losing steam, but the MACD histogram turning positive hints at a potential short-term bounce.
Current Sentiment (Technical & News):
Technical Indicators: Mixed signals. RSI (47.51) is neutral, while MACD shows a bullish crossover (histogram turning positive). The price is below key moving averages (e.g., 200-day SMA at 167.35), indicating a bearish bias.
News Sentiment: Mixed to slightly negative. Ad revenue pressures and regulatory risks weigh on sentiment, but long-term growth catalysts (AI, cloud) provide optimism. Analysts maintain a "Buy" rating despite near-term challenges.
Synthesis: The technical picture aligns with the news—short-term bearishness (price below MAs, ad revenue concerns) but potential for a reversal if support holds (undervaluation, bullish MACD).
Key Levels & Momentum:
The price is currently below the 50-day SMA (161.89) and 200-day SMA (167.35), signaling bearish dominance.
Momentum is fading (RSI neutral, Stochastic not oversold), but the MACD histogram suggests a possible short-term bounce.
2. Elliott Wave Analysis (Contextualized to Current Price)
Relevant Elliott Wave Patterns:
Diagonal Ending Downward Candidate (Valid): Suggests the downtrend may be nearing completion, with Wave 5 potentially ending near 152.48-154.34 (Fibonacci 100% projection).
Expanded Flat Upward Candidate (Potentially Valid): If the price holds above 152.48, this pattern could signal a corrective rally toward 162.82.
Wave Count vs. Indicators/Sentiment:
The Diagonal Ending pattern contradicts the bearish news sentiment but aligns with oversold technicals (RSI, MACD). This divergence suggests a potential reversal if support holds.
The Expanded Flat pattern would confirm a bullish reversal if the price breaks above 160.31.
Near-Term Projections:
Downside: A break below 152.48 could extend losses to 148.36 (161.8% Fibonacci projection).
Upside: A hold above 152.48 and break above 160.31 could target 162.82 (Expanded Flat target) and 167.35 (200-day SMA).
3. Strategy Derivation (Realistic, Actionable NOW, News Considered)
Primary Strategy: WAIT (due to conflicting signals).
Why Wait? The technical setup is mixed (bullish MACD vs. bearish MAs), and news sentiment is neutral-to-negative. The upcoming Q1 earnings could add volatility.
If Price Holds Support (152.48-154.34):
BUY with confirmation (e.g., break above 160.31).
Entry Zone: 154.34-156.13 (Fibonacci 78.6% retracement).
Stop-Loss: 151.44 (below recent low).
Take Profit: TP1 at 160.31 (Fibonacci 100%), TP2 at 162.82 (Expanded Flat target).
Risk/Reward: ~1:2 for TP1.
If Price Breaks Below Support (152.48):
SELL with confirmation (e.g., break below 150.06).
Entry Zone: 152.48-151.44.
Stop-Loss: 154.34 (above support).
Take Profit: TP1 at 148.36 (161.8% Fibonacci), TP2 at 145.90 (Wave 5 projection).
News Context Check:
Earnings uncertainty and ad revenue pressures favor caution. Reduce position size if trading.
4. Trade Setup (Actionable, Realistic, News Aware)
Direction: WAIT (watch key levels).
Key Levels to Watch:
Upside: 160.31 (breakout confirmation).
Downside: 152.48 (breakdown confirmation).
News Reminder: Be mindful of Q1 earnings and ad revenue trends.
5. Summary Section
✅ Investor / Long-Term Holder Summary:
Key Support: 152.48 (accumulation zone if held).
Long-Term Outlook: Undervalued (DCF: $260 vs. $157). Focus on AI/cloud growth.
Action: Wait for pullback to 152.48 or break above 167.35 (200-day SMA).
SILVER Will Go Higher! Buy!
Please, check our technical outlook for SILVER.
Time Frame: 4h
Current Trend: Bullish
Sentiment: Oversold (based on 7-period RSI)
Forecast: Bullish
The price is testing a key support 3,378.2.
Current market trend & oversold RSI makes me think that buyers will push the price. I will anticipate a bullish movement at least to 3,425.6 level.
P.S
Overbought describes a period of time where there has been a significant and consistent upward move in price over a period of time without much pullback.
Disclosure: I am part of Trade Nation's Influencer program and receive a monthly fee for using their TradingView charts in my analysis.
Like and subscribe and comment my ideas if you enjoy them!
GBPNZD Will Grow! Long!
Here is our detailed technical review for GBPNZD.
Time Frame: 12h
Current Trend: Bullish
Sentiment: Oversold (based on 7-period RSI)
Forecast: Bullish
The market is approaching a significant support area 2.253.
The underlined horizontal cluster clearly indicates a highly probable bullish movement with target 2.277 level.
P.S
Overbought describes a period of time where there has been a significant and consistent upward move in price over a period of time without much pullback.
Disclosure: I am part of Trade Nation's Influencer program and receive a monthly fee for using their TradingView charts in my analysis.
Like and subscribe and comment my ideas if you enjoy them!
OptionsMastery: Sitting in a weekly demand on NKE!🔉Sound on!🔉
📣Make sure to watch fullscreen!📣
Thank you as always for watching my videos. I hope that you learned something very educational! Please feel free to like, share, and comment on this post. Remember only risk what you are willing to lose. Trading is very risky but it can change your life!
DOUBLE BOTTOM IN ETH / ETH TO $2,500Hello! We have confirmation of a double bottom. Eth has a bullish pattern, the price reached the liquidity zone at $1,780, took positions, and the price began to form a double bottom. The price of Eth has already gained liquidity, and on a weekly and daily chart, the price will be looking at $2,500. Remember that a weekly chart is for seeing results between 20-30 days and a weekly chart will be seeing results over a period of 3 months. It is not ruled out that the price remains in its range. However, the indicators, price action, and market sentiment tell us that Eth is suitable for long positions.
GBPUSD Expected Growth! BUY!
My dear followers,
I analysed this chart on GBPUSD and concluded the following:
The market is trading on 1.2904 pivot level.
Bias - Bullish
Technical Indicators: Both Super Trend & Pivot HL indicate a highly probable Bullish continuation.
Target - 1.2929
About Used Indicators:
A super-trend indicator is plotted on either above or below the closing price to signal a buy or sell. The indicator changes color, based on whether or not you should be buying. If the super-trend indicator moves below the closing price, the indicator turns green, and it signals an entry point or points to buy.
Disclosure: I am part of Trade Nation's Influencer program and receive a monthly fee for using their TradingView charts in my analysis.
———————————
WISH YOU ALL LUCK
AUDJPY: Bullish Continuation & Long Signal
AUDJPY
- Classic bullish formation
- Our team expects growth
SUGGESTED TRADE:
Swing Trade
Buy AUDJPY
Entry Level - 93.633
Sl - 93.123
Tp - 94.417
Our Risk - 1%
Start protection of your profits from lower levels
Disclosure: I am part of Trade Nation's Influencer program and receive a monthly fee for using their TradingView charts in my analysis.
❤️ Please, support our work with like & comment! ❤️
CADCHF: Bullish Forecast & Bullish Scenario
Remember that we can not, and should not impose our will on the market but rather listen to its whims and make profit by following it. And thus shall be done today on the CADCHF pair which is likely to be pushed up by the bulls so we will buy!
Disclosure: I am part of Trade Nation's Influencer program and receive a monthly fee for using their TradingView charts in my analysis.
❤️ Please, support our work with like & comment! ❤️
EURJPY: Will Start Growing! Here is Why:
Balance of buyers and sellers on the EURJPY pair, that is best felt when all the timeframes are analyzed properly is shifting in favor of the buyers, therefore is it only natural that we go long on the pair.
Disclosure: I am part of Trade Nation's Influencer program and receive a monthly fee for using their TradingView charts in my analysis.
❤️ Please, support our work with like & comment! ❤️


