What is the potential of the crypto market and Bitcoin?📈👀
As everyone gets used to crypto, big players and institutional investors are starting to adopt it.
For example, just today the CAR launched its national cryptocurrency, and Timberlane launched an animated monkey music video called BAYC, following Snoop Dogg and Eminem.
Let's examine the potential of BTC and crypto in general.
In the main picture you can compare the capitalization of different parts of the financial market.
The largest capitalizations are in forex, futures, and funds. Then, with a big gap, the other components of the market go, including crypto, with a current capitalization of only about $700 billion.
That is, the crypto can still get scammed)
Why isn't crypto being adopted faster?
First of all, because there is no stability in it. No matter how much crypto-enthusiasts talk about Bitcoin as the new gold, in reality it is a very speculative asset and most bitcoins are in the hands of private investors. States are afraid of what they don't control, so they don't invest in crypto, but rush to issue their own digital stablecoins.
- Except for El Salvador's, which everyone is laughing at (they've already bought BTC)
How much can a BTC be worth?
Bitcoin is the face of the entire crypto market, as it grows and updates historic highs, it attracts new investors and more people learn about it.
At the time of the bull run in 2021, at $69,000, BTC had a capitalization of just $1100 billion.
To reach the desired mark of $100,000, BTC needs a capitalization of about $2100 billion at the current turnover of 21 million coins.
Even if that happens, the crypto market will still be incomparably small compared to other parts of the economy and the potential is truly great. We are the pioneers of this industry, and as we know, it is the first ones who make the most profit.
Under what conditions will the BTC break through the $100,000 mark?
1. Adaptation
Cryptocurrency adaptation is when every third person will have a cryptocurrency wallet installed on their phone and will be able to use it to buy clothes or pay for groceries in the supermarket.
2. State stablecoins
The launch of digital national currencies will force people to adapt to the new reality and use blockchain in their daily lives. Many people will have to learn what crypto is and how to use it. At the same time, trust towards crypto will increase.
3. Education in schools
Just like now parents and teachers explain to children that every country has its own currency and that you can buy a piece of a company if you have money, in the future they will also have to explain that every country has its own stablecoin and you can buy a piece of some cool project on the blockchain.
Cryptocurrency - Blockchain - will absorb at least x10 liquidity from other markets, IT’S ONLY QUESTION OF TIME!
Long-term

USD/CHF The Dollar is Rising ↑ The incomplete double top pattern makes the pair rise to the major high.
The pair reacts from the demand level ✔.
break the bearish channel ✔.
for more confirmation wait for the next bullish candle ✔.

BTC Long Term And Short Term AnalysisBTC LONG TERM - On the 1D the green spot has confirmed from yesterday with bullish divergence at the same time but the stochastic Is still crossing down on the 1D. On the 4H It has come down to the 55 Ema it would be nice to see it bounce off that, If It does then I can see a bit more upside towards 21700.
BTC SHORT TERM - My short term target from yesterday was hit (20400) It's been rejected off that resistance and a red spot and the stochastic crossing down too. Like I said with with 4H as long as It stays above the 55 Ema i can see a bit more upside. Shorter target 21000.
BTC OVERALL - I think BTC will carry on this move upwards of at least 21000 if it stays above 19700.
Let me know your thoughts in the comments and like my idea!!

Low stress BTC money printerBlockchain is here to stay; let's take some profile along the way.
Start early, buy low and sell high.

EurJpy Ascending TriangleEurJpy Ascending Triangle: long-term pattern for technical analysis Without any indicators.


Eurusd Long Trend EurUsd Long Trend Analysis on daily timeframe if the trendline breakout is the best opportunity for buying traders.

XRPOne and a half year later XRP/USD is back at its lows. No resolution with the SEC case, crypto bearmarket, war, interest rates and so on are the main reasons for this fall.
Considering the fact that in the BIS meeting it was told that CBDCs were discussed, I strongly believe that XRP and/or Ripple might have a role in this, so in order not to miss out I might fill the bag.
Trade safe :)

Bitcoin / Bottom / Price prediction / Long term Hello.
I thing last AH is not 20k but is around 11 500.
This should be the next bottom.
If there is big weekly wick it can dip to 9000$

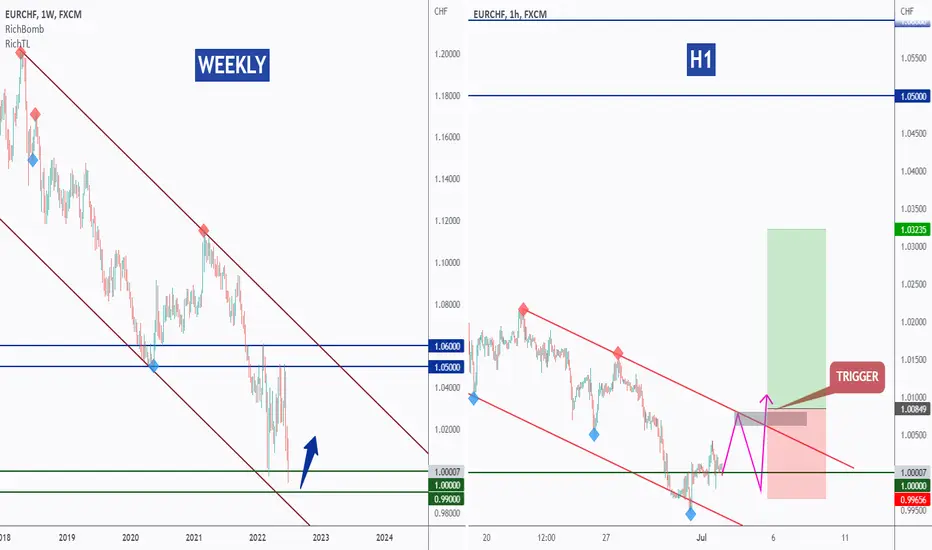
EURCHF - Top-Down Analysis!Hello TradingView Family / Fellow Traders. This is Richard, as known as theSignalyst.
Weekly: Left Chart
EURCHF is approaching a strong support and lower brown trendline acting as an oversold area so we will be looking for buy setups on lower timeframes.
H1: Right Chart
EURCHF is forming a channel in red but it is not valid yet, so we are waiting for a new swing high to form around it to consider it out trigger swing (projection in purple)
Trigger => Waiting for that swing high to form then buy after a momentum candle close above it. (gray area)
Meanwhile, until the buy is activated, EURCHF can still trade lower inside the support zone.
Always follow your trading plan regarding entry, risk management, and trade management.
Good luck!
All Strategies Are Good; If Managed Properly!
~Rich
BTCUSD Weekly Chart On the support area of the long-term channel trend line and the static support area of $18,000-20,000.
By observing the return signal candle (it can be a bullish engulfing in the weekly time frame), the probability of a trend change in the daily and 4-hour time frames increases.
Also, trend changes in 1-hour and 4-hour time frames can be signs of the beginning of an upward movement in daily and weekly time frames.

GBPJpy current trend Daily GBPJpy triangle +major support on daily chart. Also check my other trend and after result .


Bitcoin BTC - exciting times - golden trendline since 2011Bitcoin BTC - exciting times - golden trendline since 2011
Not much more to comment - what would a break through the downside mean to you?
Let me know dear Crypto Nation?
*not financial advice
do your own research before investing

BITCOIN - USDT - BINANCE BINANCE:BTCUSDT
I expect the steadfastness of the price movement and the temporary trend to the targets in case the daily closing is above the level of 19,200.


MATIC USDT - BINANCE - LONGBINANCE:MATICUSDT
Matic currency analysis in case of trying to break a trend.

EURCHF I LONG TERM BUY FROM DEMANDWelcome back! Here's an analysis of this pair!
**EURCHF - Listen to video!
We recommend that you keep this pair on your watchlist and enter when the entry criteria of your strategy is met.
Please support this idea with a LIKE and COMMENT if you find it useful and Click "Follow" on our profile if you'd like these trade ideas delivered straight to your email in the future.
Thanks for your continued support!
Brian & Kenya Horton, BK Forex Academy

Importance of resistance and long-term chartsI just had to pop this chart on here this morning – it is the CBOT monthly wheat chart. It demonstrates that no matter what your time frame that it is important to look at long term charts and it also demonstrates the importance of resistance.
There are two resistance points to mention on here – the first is the 1349 2008 high and the second is the shallow parallel line I have drawn, which connects the 1977 low and the 2000 low. I shifted this line up to connect to the 1349 2008 high and this provided resistance at 1373. The market tested these twin perils in March and failed miserably. The mid-point of this range is about 810 and this where I suspect the market will head.
Disclaimer:
The information posted on Trading View is for informative purposes and is not intended to constitute advice in any form, including but not limited to investment, accounting, tax, legal or regulatory advice. The information therefore has no regard to the specific investment objectives, financial situation or particular needs of any specific recipient. Opinions expressed are our current opinions as of the date appearing on Trading View only. All illustrations, forecasts or hypothetical data are for illustrative purposes only. The Society of Technical Analysts Ltd does not make representation that the information provided is appropriate for use in all jurisdictions or by all Investors or other potential Investors. Parties are therefore responsible for compliance with applicable local laws and regulations. The Society of Technical Analysts will not be held liable for any loss or damage resulting directly or indirectly from the use of any information on this site.

BTC/USD Bollinger Band based signal pressure is intenseNot a piece of financial advice.
We are awaiting a clean signal that is expected to flash anytime soon should the market prevents itself from going south. We have already entered the bear market this season. Hope the Bollinger Band signal does not fail this time. Therefore, no rush here to enter the trade. Interestingly the RSI/Stoch suggests the bottom has been found. Weekly close above 21.9k is expected should there be no chaos to push markets further down.
Those who got into the bottom around 19.5k level have 1k up to their share if swinging at this risky zone at an hourly trend cycle that is rewarding for quite some time.
Should I put a trade here? I rather wait for a clean signal emerge so that my trades will follow the algorithms rather than emotions.

Potential Butterfly for Facebook (Monthly)Until we see a confirmed B point at the 78.6% retrace, this pattern is nothing but purely speculative.
The long position shown on the chart is the technical trade, but on a monthly chart I would personally just stick to investing :D

2 Day Death Cross BTC $Seriously though... I do not see to many people talking about this scenario. I am not a financial advisor, and if I am looking at this chart correctly it looks to me the bottom may be in, but many professionals are over thinking the scenario with the inflation worries going on and the higher chances of a depression and further sell offs. What if they are wrong. Maybe we go lower maybe we don't and we stay level or maybe we do in fact have a significant rebound. I am semi bullish to buying more sub 20k myself. My own opinion of course.
