GBPAUD: Bullish Forecast & Outlook
Balance of buyers and sellers on the GBPAUD pair, that is best felt when all the timeframes are analyzed properly is shifting in favor of the buyers, therefore is it only natural that we go long on the pair.
Disclosure: I am part of Trade Nation's Influencer program and receive a monthly fee for using their TradingView charts in my analysis.
❤️ Please, support our work with like & comment! ❤️
LONG

SILVER: Expecting Bullish Continuation! Here is Why:
The charts are full of distraction, disturbance and are a graveyard of fear and greed which shall not cloud our judgement on the current state of affairs in the SILVER pair price action which suggests a high likelihood of a coming move up.
Disclosure: I am part of Trade Nation's Influencer program and receive a monthly fee for using their TradingView charts in my analysis.
❤️ Please, support our work with like & comment! ❤️

USDCHF: Long Signal Explained
USDCHF
- Classic bullish formation
- Our team expects pullback
SUGGESTED TRADE:
Swing Trade
Long USDCHF
Entry - 0.7943
Sl - 0.7934
Tp - 0.7958
Our Risk - 1%
Start protection of your profits from lower levels
Disclosure: I am part of Trade Nation's Influencer program and receive a monthly fee for using their TradingView charts in my analysis.
❤️ Please, support our work with like & comment! ❤️
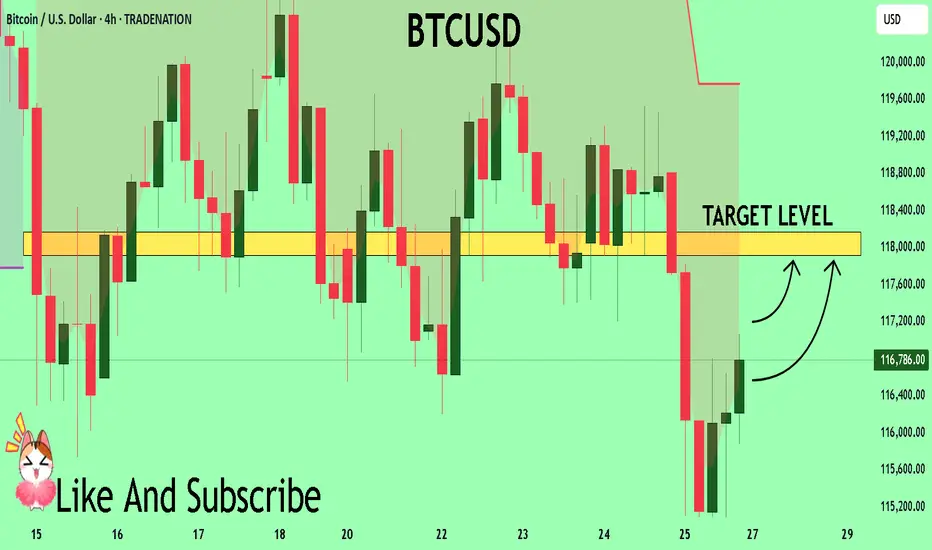
BTCUSD What Next? BUY!
My dear friends,
Please, find my technical outlook for BTCUSD below:
The price is coiling around a solid key level - 11678
Bias - Bullish
Technical Indicators: Pivot Points High anticipates a potential price reversal.
Super trend shows a clear buy, giving a perfect indicators' convergence.
Goal - 11791
About Used Indicators:
The pivot point itself is simply the average of the high, low and closing prices from the previous trading day.
Disclosure: I am part of Trade Nation's Influencer program and receive a monthly fee for using their TradingView charts in my analysis.
———————————
WISH YOU ALL LUCK
VIRTUAL – Major Confluence ZoneEntry into 3D S/R and Demand Zone (Blue Box)
The current price action is testing a key 3D support/resistance level, which aligns with a historical demand zone.
Multiple diagonal supports converge here, making it a high-probability zone for a reaction.
Accumulation & Reversal Play
The setup suggests that this zone is ideal for building a position.
Expect potential wicks/spikes into the lower blue zone, hunting liquidity before a reversal.
If price holds above ~$1.40 (blue line), look for signs of strength (bullish candles, reclaim of lost support).
Upside Targets
If the zone holds, the first target is the prior local highs ($2.00–2.05).
Further targets are the overhead supply zones (highlighted in red), especially if the momentum persists.
Invalidation
A daily close below $1.40 or sustained trading below the lower blue box invalidates the setup and signals a risk-off environment.

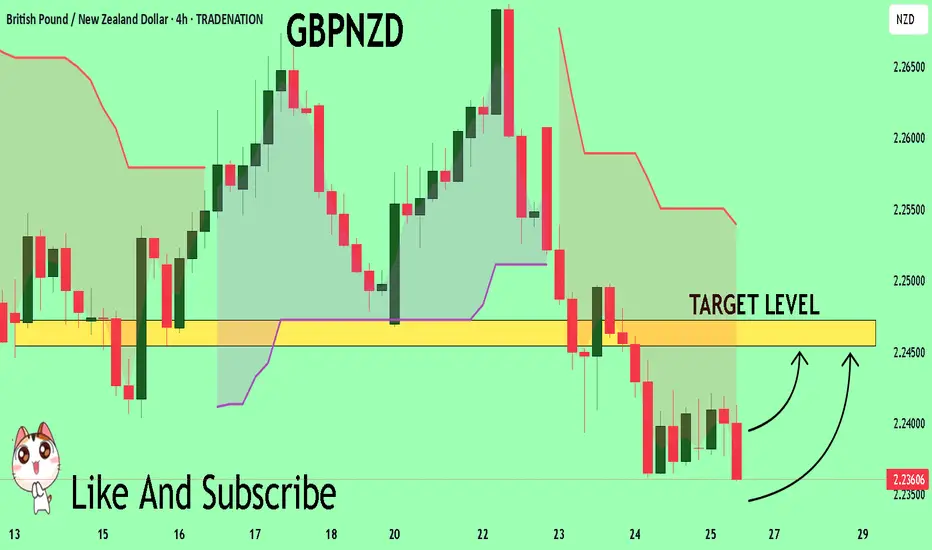
GBPNZD Will Explode! BUY!
My dear friends,
My technical analysis for GBPNZD is below:
The market is trading on 2.2361 pivot level.
Bias - Bullish
Technical Indicators: Both Super Trend & Pivot HL indicate a highly probable Bullish continuation.
Target - 2.2454
About Used Indicators:
A pivot point is a technical analysis indicator, or calculations, used to determine the overall trend of the market over different time frames.
Disclosure: I am part of Trade Nation's Influencer program and receive a monthly fee for using their TradingView charts in my analysis.
———————————
WISH YOU ALL LUCK
EURUSD Is Bullish! Long!
Take a look at our analysis for EURUSD.
Time Frame: 9h
Current Trend: Bullish
Sentiment: Oversold (based on 7-period RSI)
Forecast: Bullish
The price is testing a key support 1.173.
Current market trend & oversold RSI makes me think that buyers will push the price. I will anticipate a bullish movement at least to 1.184 level.
P.S
Overbought describes a period of time where there has been a significant and consistent upward move in price over a period of time without much pullback.
Disclosure: I am part of Trade Nation's Influencer program and receive a monthly fee for using their TradingView charts in my analysis.
Like and subscribe and comment my ideas if you enjoy them!

GBPAUD Is Going Up! Buy!
Here is our detailed technical review for GBPAUD.
Time Frame: 1D
Current Trend: Bullish
Sentiment: Oversold (based on 7-period RSI)
Forecast: Bullish
The market is testing a major horizontal structure 2.051.
Taking into consideration the structure & trend analysis, I believe that the market will reach 2.072 level soon.
P.S
The term oversold refers to a condition where an asset has traded lower in price and has the potential for a price bounce.
Overbought refers to market scenarios where the instrument is traded considerably higher than its fair value. Overvaluation is caused by market sentiments when there is positive news.
Disclosure: I am part of Trade Nation's Influencer program and receive a monthly fee for using their TradingView charts in my analysis.
Like and subscribe and comment my ideas if you enjoy them!

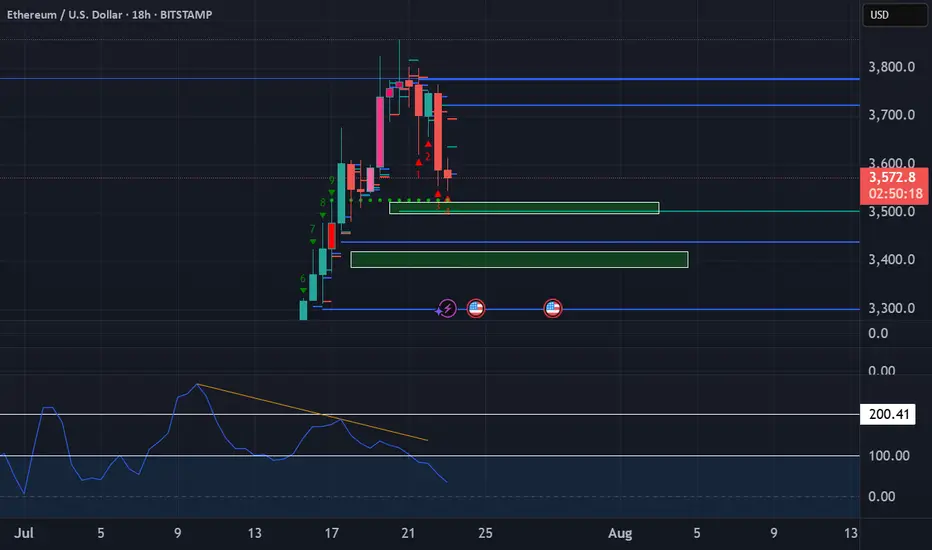
Ethereum short updateDon't be surprised to see some buying coming into play at the POI's highlighted below.
Hedging involves entering into a trade that is expected to perform in the opposite direction of an existing position, effectively protecting against potential losses.
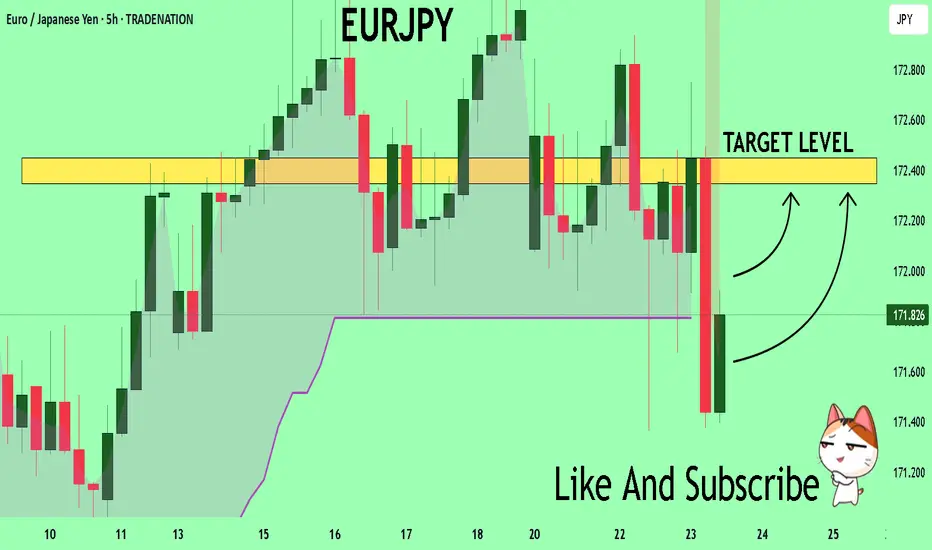
EURJPY Will Explode! BUY!
My dear subscribers,
My technical analysis for EURJPY is below:
The price is coiling around a solid key level - 171.82
Bias - Bullish
Technical Indicators: Pivot Points Low anticipates a potential price reversal.
Super trend shows a clear buy, giving a perfect indicators' convergence.
Goal - 172.34
About Used Indicators:
By the very nature of the supertrend indicator, it offers firm support and resistance levels for traders to enter and exit trades. Additionally, it also provides signals for setting stop losses
Disclosure: I am part of Trade Nation's Influencer program and receive a monthly fee for using their TradingView charts in my analysis.
———————————
WISH YOU ALL LUCK
GBPAUD Sellers In Panic! BUY!
My dear followers,
This is my opinion on the GBPAUD next move:
The asset is approaching an important pivot point 2.0491
Bias - Bullish
Technical Indicators: Supper Trend generates a clear long signal while Pivot Point HL is currently determining the overall Bullish trend of the market.
Goal - 2.0573
About Used Indicators:
For more efficient signals, super-trend is used in combination with other indicators like Pivot Points.
Disclosure: I am part of Trade Nation's Influencer program and receive a monthly fee for using their TradingView charts in my analysis.
———————————
WISH YOU ALL LUCK

GBPUSD Massive Long! BUY!
My dear friends,
GBPUSD looks like it will make a good move, and here are the details:
The market is trading on 1.3528 pivot level.
Bias - Bullish
Technical Indicators: Supper Trend generates a clear long signal while Pivot Point HL is currently determining the overall Bullish trend of the market.
Goal - 1.3556
Recommended Stop Loss - 1.3512
About Used Indicators:
Pivot points are a great way to identify areas of support and resistance, but they work best when combined with other kinds of technical analysis
Disclosure: I am part of Trade Nation's Influencer program and receive a monthly fee for using their TradingView charts in my analysis.
———————————
WISH YOU ALL LUCK

EURAUD: Bullish Forecast & Outlook
Our strategy, polished by years of trial and error has helped us identify what seems to be a great trading opportunity and we are here to share it with you as the time is ripe for us to buy EURAUD.
Disclosure: I am part of Trade Nation's Influencer program and receive a monthly fee for using their TradingView charts in my analysis.
❤️ Please, support our work with like & comment! ❤️

GOLD: Bullish Continuation & Long Signal
GOLD
- Classic bullish formation
- Our team expects growth
SUGGESTED TRADE:
Swing Trade
Buy GOLD
Entry Level - 3364.8
Sl - 3359.2
Tp - 3376.2
Our Risk - 1%
Start protection of your profits from lower levels
Disclosure: I am part of Trade Nation's Influencer program and receive a monthly fee for using their TradingView charts in my analysis.
❤️ Please, support our work with like & comment! ❤️

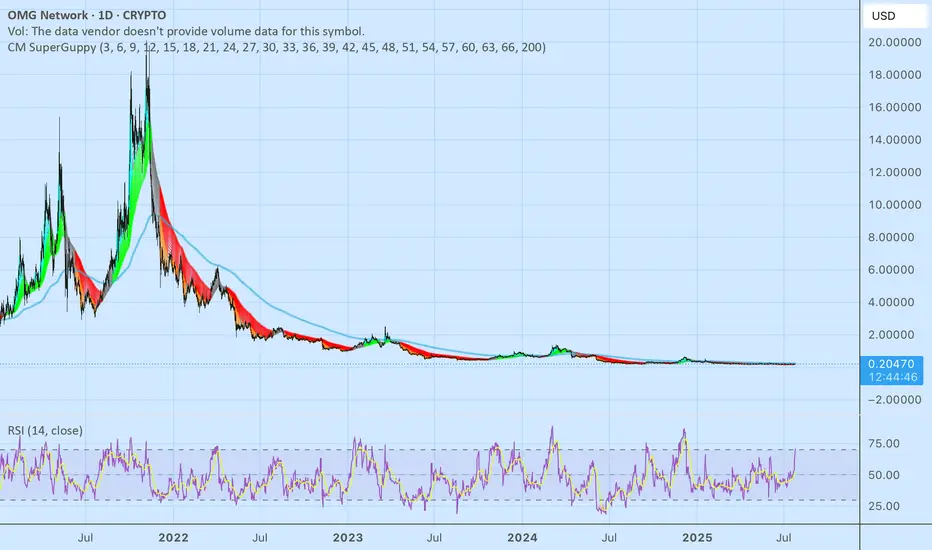
NC HAMMER CRYPTO find meLooking at omg we see that it is practically dead, however we have seen this before it does a major pump when it gets over the 200EMA like we have seen with XCN… a little goes a long way with this one. ATH roughly $20 currently at $0.20, you do the math on risk vs reward.
The Edge Of The Fork - The Joker In Your PocketWOW!
\ \ First of all, I want to say THANK YOU for all the boosts, follows, and comments. You guys & gals give me the energy to continue this journey with you.\ \
Today, I want to show you that what we’ve learned with horizontal lines can also be applied to "Medianlines," or Forks.
Listen, I don’t want you to blow your brain with all the rules.
Not at the beginning of this journey, and not later on either.
Don’t ask yourself:
* when to use which Fork
* which swing to measure
* when to trade
* where to set your stop
* what if... bla bla bla
That’s not fun — that’s stress.
I don’t like stress — nobody does.
So let’s just chill and have fun here.
That’s my personal reason for doing all this Trading thing. I want to have fun — the money will take care of itself, just like the destination of a trail takes care of itself, as long as I keep putting one foot in front of the other. And that’s simple, right?
So let’s do it exactly the same way.
Just simple steps, connecting some dots, and BAM! — You’re there before you even know it §8-)
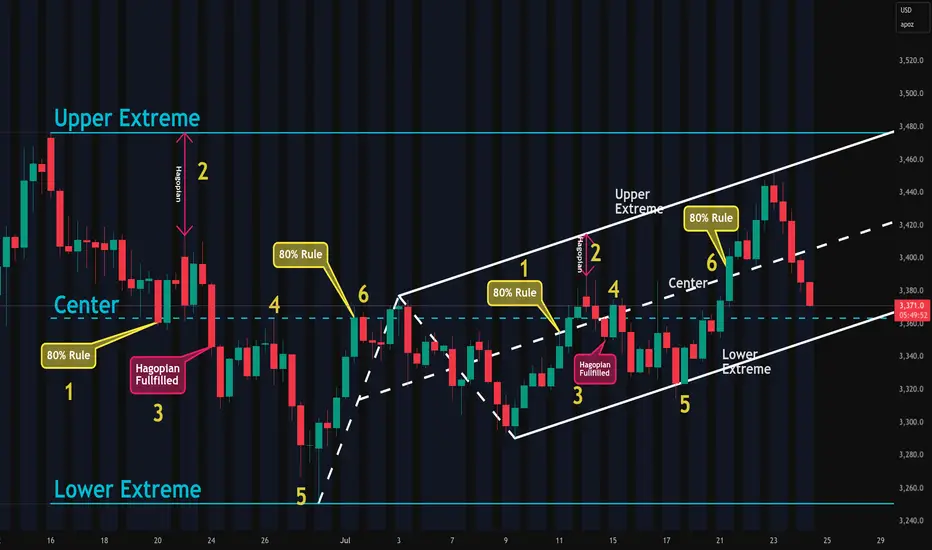
\ Let’s jump to the chart:\
Today, you’ll find out why Medianlines/Forks are a cousin of the horizontal Channel — but NOT the same.
Where are they different?
Forks are different because they’re capable of projecting the most probable path of price. And that’s a HUGE difference.
Yes, you can apply the full rule set of Forks to a horizontal Channel.
But the Channel CANNOT project the most probable path of price.
I hear you, I hear you: "No one and nothing can foresee the future. How is it even possible that Forks can?"
\ Here’s why:\
There’s a thing called "Statistical Importance." And it means that if something happens very often in the same way, we have a higher chance of seeing the same behavior again in the future.
And that’s what the inventor, Allan Andrews, discovered — and he created the rules around his findings.
\ A high probability that price will move in the direction of the projected path, as long as it stays within the boundaries of the Medianlines/Fork.\
That’s the whole "magic" behind Medianlines/Forks.
And the same applies to the "Behavior of Price" within and around Medianlines. That’s really all there is to it.
Look at the chart and compare the Channel and the Fork:
1. Price reaches the Centerline about 80% of the time
2. HAGOPIAN → price goes farther in the opposite direction than where it came from
3. HAGOPIAN’s rule fulfilled
4. Price reaches the Centerline again
5. Price reaches the other extreme
6. Price reaches the Centerline about 80% of the time
You’ll see the same behavior inside the Fork!
That’s beautiful, isn’t it? §8-)
And here’s a little Joker in your pocket — if you know the difference between the Channel and the Forks!
Do you know what it is?
Yep! You’d automatically know the direction to trade — giving you another 10% edge right out of the box — LONG TRADES ONLY. Because the Fork projects the most probable path of price to the upside, not down.
That's all folks §8-)
Like this lesson?
With a simple boost and/or a little comment, you load my Battery so I can continue my next step on the trail with you.
Thank you for spending your time with me §8-)
AUDUSD Will Go Up From Support! Long!
Here is our detailed technical review for AUDUSD.
Time Frame: 4h
Current Trend: Bullish
Sentiment: Oversold (based on 7-period RSI)
Forecast: Bullish
The market is on a crucial zone of demand 0.661.
The oversold market condition in a combination with key structure gives us a relatively strong bullish signal with goal 0.665 level.
P.S
Please, note that an oversold/overbought condition can last for a long time, and therefore being oversold/overbought doesn't mean a price rally will come soon, or at all.
Disclosure: I am part of Trade Nation's Influencer program and receive a monthly fee for using their TradingView charts in my analysis.
Like and subscribe and comment my ideas if you enjoy them!

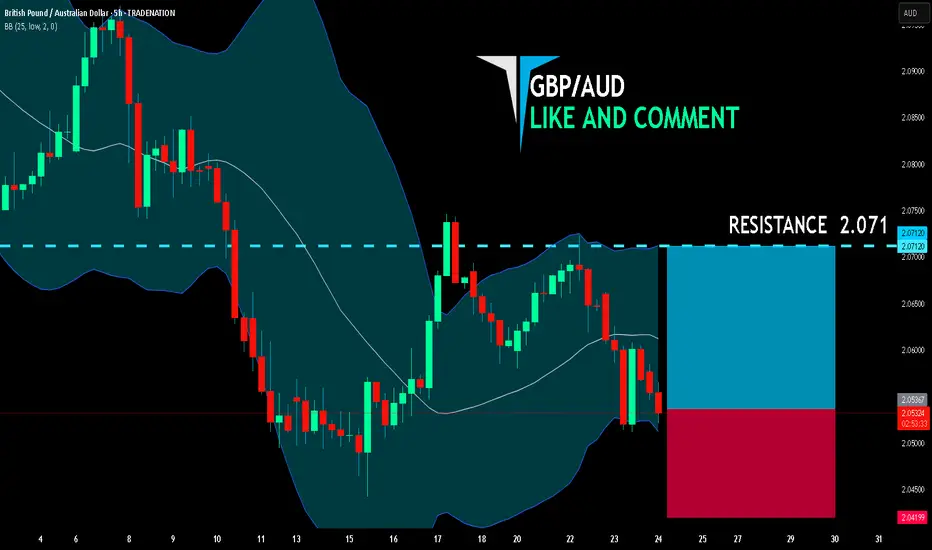
GBP/AUD LONG FROM SUPPORT
GBP/AUD SIGNAL
Trade Direction: long
Entry Level: 2.053
Target Level: 2.071
Stop Loss: 2.041
RISK PROFILE
Risk level: medium
Suggested risk: 1%
Timeframe: 5h
Disclosure: I am part of Trade Nation's Influencer program and receive a monthly fee for using their TradingView charts in my analysis.
✅LIKE AND COMMENT MY IDEAS✅
MKR – Bull Pennant Breakout, Eyes on $3000Breakout Confirmation:
MKR has broken out of a daily bull pennant, signaling bullish momentum. The breakout candle reclaimed key HTF S/R (~$1987–$2000 zone) and flipped it to support.
Entry and Risk Zone:
Ideal long entries are on retests of this S/R flip ($1987–$2000). Invalidation below $1826 (recent low and support).
Upside Target:
First target at $2759, full target at $3000 zone, just below the marked supply.
Trade Management:
Trailing stops recommended as price approaches $2750–$2800 to lock in gains.
MKR just broke out of a clean daily bull pennant pattern, confirming a structural shift with a retest and reclaim of high timeframe S/R. This level, previously strong resistance, now acts as support. Combined with the breakout and the momentum from recent market dips, the setup favors continuation to the upside with $2750–$3000 as the likely destination. Failure to hold $1826 invalidates the bullish scenario.

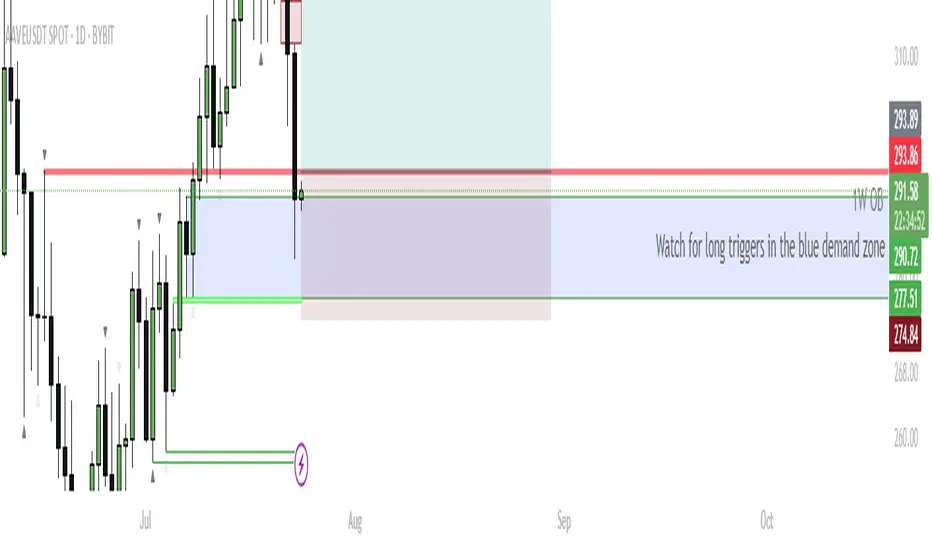
AAVE – Eyeing Reversal From Daily Demand for $400 TargetCurrent Structure:
AAVE recently rejected from 1M S/R at $332.54 and pulled back into a confluence support zone—overlapping 1W order block (OB), 1D OB, and previous resistance now flipped support ($277–$290 zone, marked blue).
Buy Zone:
Watching the blue box area for bullish reversal triggers. This is a high-probability demand zone due to multiple timeframe confluence.
Trigger:
Wait for a bullish reaction/candle confirmation inside the blue zone. Ideal scenario: bullish engulfing, sweep of the low and reclaim, or a strong bounce with rising volume.
Targets:
Primary upside target: retest of the 1M S/R at $332, then continuation toward $400 if momentum sustains.
Invalidation:
If price closes below the 1D OB ($274.84), long setup is invalidated—risk of further downside increases.
AAVE is testing a major support confluence zone, combining weekly and daily order blocks. This area previously acted as resistance and now presents a strong demand zone. If bulls defend this zone and trigger a reversal, there’s a clear runway back to previous highs and potentially $400. This setup offers a favorable risk/reward profile with tight invalidation.
PEPE – Highest Weekly Close in 6 Months: Eyes on New HighsMajor Breakout Level:
Last week’s candle closed above the 1W S/R (~0.000013845), marking the highest weekly close in half a year.
Bullish Structure:
Price reclaimed and closed above a crucial weekly resistance. This flips the structure bullish, increasing odds of continuation.
Next Targets:
Immediate resistance lies near the 1M S/R (around 0.000020193–0.000020272). Break and close above opens way toward the 1.27–1.618 Fib extensions (0.000029793+).
Invalidation:
Failure to hold above the 1W S/R and a weekly close back below (~0.000013845) would invalidate the breakout, putting risk back toward mid-range support (0.000009697).
The weekly close above key resistance signals strong buyer interest and market acceptance of higher prices, especially after a multi-month consolidation. This “highest close in 6 months” is a classic trend continuation setup. The next natural target is the higher time frame resistance (1M S/R), with Fibs aligning to previous price action. Failure to hold the breakout level would suggest a failed move and likely mean-reversion.

USD/JPY: A Bullish Thesis for Trend ContinuationThis analysis outlines a data-driven, bullish thesis for USD/JPY, identifying a strategic long entry within an established market trend. The setup is supported by a combination of fundamental catalysts and a clear technical structure.
📰 The Fundamental Picture
The primary driver for this trade will be the high-impact US economic data scheduled for release. This release is expected to inject significant volatility into the market. Fundamentally, this trade is a play on the deep policy differences between the US Federal Reserve and the Bank of Japan. While the Fed's future steps are a topic of debate, the Bank of Japan's policy remains one of the most accommodative in the world, creating a long-term headwind for the Japanese Yen. This dynamic provides a strong fundamental basis for relative US Dollar strength against the Yen.
📊 The Technical Structure
Chart analysis reveals that USD/JPY is in a confirmed and healthy uptrend. The current price action indicates a constructive pullback, presenting a strategic opportunity to join the dominant trend at a favorable price. The proposed entry point is positioned at a key technical level that offers a low-risk entry. Technical indicators support the continuation of the trend, suggesting that momentum remains with the bulls.
✅ The Trade Plan
This trade is structured with a clear and favorable risk-to-reward profile, aiming to capitalize on the established trend.
👉 Entry: 146.343
⛔️ Stop Loss: 145.233
🎯 Take Profit: 148.560
⚖️ Risk/Reward Ratio: 1:2

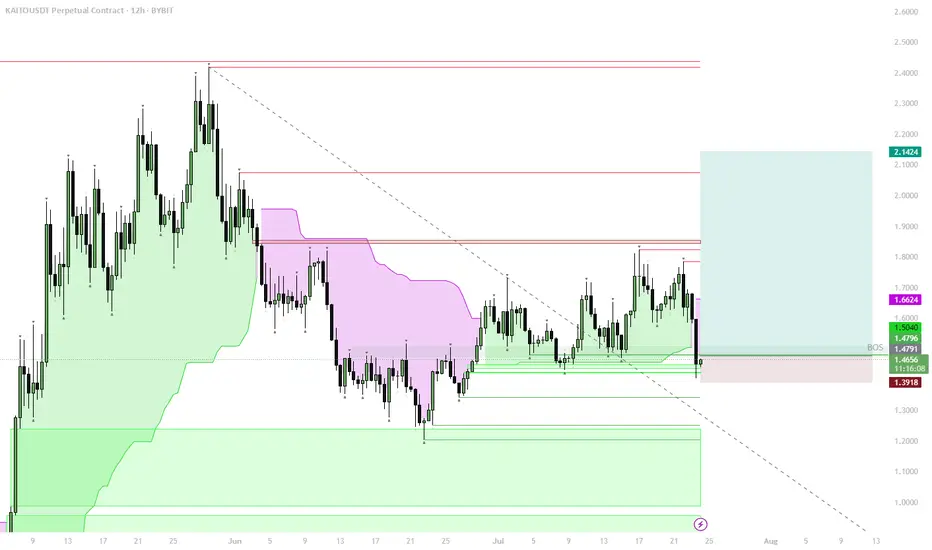
KAITO – Structural Flip, Bullish Accumulation ZoneStructural Shift:
Price reclaimed the key 1D S/R + BOS (Break of Structure) level, signaling a major trend change from bearish to bullish.
Trend Confirmation:
The move above $1.48–$1.50 zone confirms a bullish market structure. This level is now strong support.
Accumulation Opportunity:
The area between $1.65–$1.50 is ideal for spot accumulation, as it aligns with the reclaimed BOS and the lower edge of the bullish structure.
Upside Targets:
If the bullish structure holds, price could target $1.66 (local resistance), with the next targets at $1.85, $2.14, and potentially higher if momentum continues.
Invalidation:
A break and close below $1.48 would invalidate this bullish scenario and signal a return to the previous range.
The reclaim of the BOS level, with a shift above 1D S/R, marks a clear bullish structural flip on the chart. Historically, such shifts create strong accumulation zones just above the reclaimed level, where risk/reward is best for spot buys. Buying into the $1.65–$1.50 range aligns with both trend-following and classic Smart Money concepts: enter after the structural confirmation, not before. Invalidation is clear below $1.48, where structure would flip bearish again.