Czech Republic: A Dividend HeavenThe Prague Stock Exchange (PSE) PSECZ:PX is characterized by a concentration of mature, dividend-paying companies, particularly in sectors such as energy, banking, and heavy industry. Unlike growth-focused exchanges in the U.S. or Asia, the Czech market offers relatively few stocks with high reinvestment or expansion trajectories.
Preference for Payouts
Over the past two decades, Czech listed companies have consistently distributed a significant share of profits as dividends. This reflects both limited reinvestment opportunities in a relatively saturated domestic market and a shareholder preference for cash returns. For example, CEZ and Komercni banka have maintained payout ratios above 70% in most years.
Structural Support & Tax environment
The Czech Republic provides a structurally supportive environment for dividend-oriented investors. One key advantage is the tax framework. Czech residents are exempt from capital gains tax if they hold an investment for more than three years. This strongly favors long-term investing.
For non-residents, a 15% withholding tax on dividends applies—unless the investor resides in a country outside the EU/EEA that does not have a tax treaty or tax information exchange agreement with the Czech Republic.
Key Dividend-Paying Companies
CEZ (CEZ) PSECZ:CEZ
Industry: Energy (Electricity generation and distribution)
Dividend History (Gross per Share) / Dividend Yield (%)
2020: CZK 34 10.1%
2021: CZK 52 5.8%
2022: CZK 48 18.83%
2023: CZK 145 5.43%
2024: CZK 52 5.9%
Dividend Growth:
2020 to 2021: +52.9%
2021 to 2022: -7.7%
2022 to 2023: +202%
2023 to 2024: -64.1%
Komercni banka (KOMB) PSECZ:KOMB
Industry: Banking and financial services
Dividend History (Gross per Share) / Dividend Yield (%)
2020: CZK 23.9 3.63%
2021: CZK 99.3 10.62%
2022: CZK 60.42 9.22%
2023: CZK 82.7 11.41%
2024: CZK 91.3 10.76%
Dividend Growth:
2020 to 2021: +315.6%
2021 to 2022: -39.2%
2022 to 2023: +36.9%
2023 to 2024: +10.4%
Moneta Money Bank (MONET) PSECZ:MONET
Industry: Banking and financial services
Dividend History (Gross per Share) / Dividend Yield (%)
2020: CZK 0 (dividend suspended)
2021: CZK 3 10.67%
2022: CZK 7 10.53%
2023: CZK 8 12.82%
2024: CZK 9 8.08%
Dividend Growth:
2020 to 2021: N/A
2021 to 2022: +133.3%
2022 to 2023: +14.3%
2023 to 2024: +12.5%
LONG

BTCUSD: Growth & Bullish Continuation
Remember that we can not, and should not impose our will on the market but rather listen to its whims and make profit by following it. And thus shall be done today on the BTCUSDpair which is likely to be pushed up by the bulls so we will buy!
Disclosure: I am part of Trade Nation's Influencer program and receive a monthly fee for using their TradingView charts in my analysis.
❤️ Please, support our work with like & comment! ❤️

QQQ Trading Opportunity! BUY!
My dear friends,
QQQ looks like it will make a good move, and here are the details:
The market is trading on 509.27 pivot level.
Bias - Bullish
Technical Indicators: Supper Trend generates a clear long signal while Pivot Point HL is currently determining the overall Bullish trend of the market.
Goal - 514.96
About Used Indicators:
Pivot points are a great way to identify areas of support and resistance, but they work best when combined with other kinds of technical analysis
Disclosure: I am part of Trade Nation's Influencer program and receive a monthly fee for using their TradingView charts in my analysis.
———————————
WISH YOU ALL LUCK

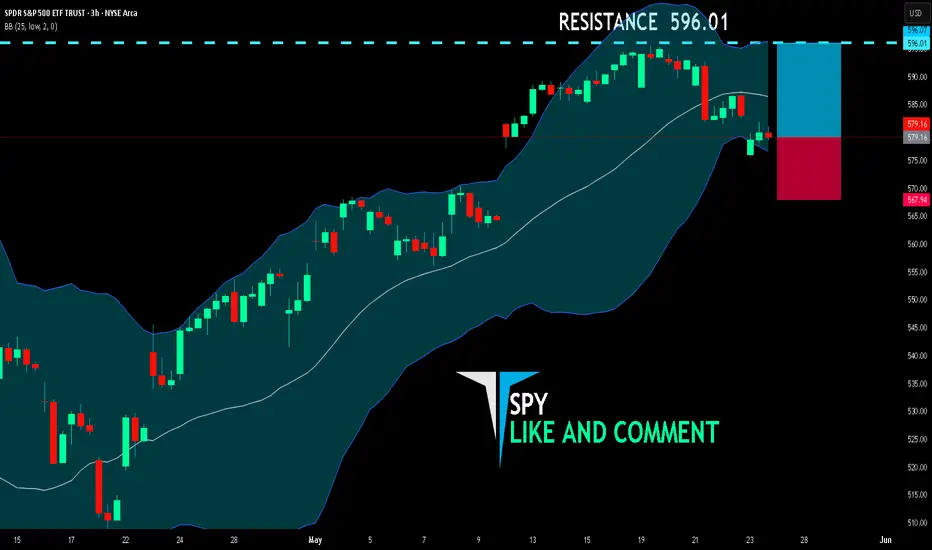
SPY LONG FROM SUPPORT
SPY SIGNAL
Trade Direction: long
Entry Level: 579.16
Target Level: 596.01
Stop Loss: 567.94
RISK PROFILE
Risk level: medium
Suggested risk: 1%
Timeframe: 3h
Disclosure: I am part of Trade Nation's Influencer program and receive a monthly fee for using their TradingView charts in my analysis.
✅LIKE AND COMMENT MY IDEAS✅
ICP - Perfect Long OpportunityDescription
---------------------------------------------------------------
+ ICP has started reversal inside the channel and the price is heading towards the resistance zone, this gives a bullish trade opportunity.
---------------------------------------------------------------
VectorAlgo Trade Details
------------------------------
Entry Price: 5.3
Stop Loss: 3.3
------------------------------
Target 1: 6.9
Target 2: 12.7
Target 3: 22.5
------------------------------
Timeframe: 1W
Capital Risk: 1-2% of trading amount
Leverage: 5-10x
---------------------------------------------------------------
Enhance, Trade, Grow
---------------------------------------------------------------
Feel free to share your thoughts and insights. Don't forget to like and follow us for more trading ideas and discussions.
Best Regards,
VectorAlgo

APPLE: Bullish Continuation & Long Trade
APPLE
- Classic bullish pattern
- Our team expects retracement
SUGGESTED TRADE:
Swing Trade
Buy APPLE
Entry - 195.23
Stop - 188.82
Take - 206.74
Our Risk - 1%
Start protection of your profits from lower levels
Disclosure: I am part of Trade Nation's Influencer program and receive a monthly fee for using their TradingView charts in my analysis.
❤️ Please, support our work with like & comment! ❤️

USDJPY: Long Signal Explained
USDJPY
- Classic bullish setup
- Our team expects bullish continuation
SUGGESTED TRADE:
Swing Trade
Long USDJPY
Entry Point - 142.56
Stop Loss - 141.39
Take Profit - 144.82
Our Risk - 1%
Start protection of your profits from lower levels
Disclosure: I am part of Trade Nation's Influencer program and receive a monthly fee for using their TradingView charts in my analysis.
❤️ Please, support our work with like & comment! ❤️

USDCHF: Market of Buyers
Balance of buyers and sellers on the USDCHF pair, that is best felt when all the timeframes are analyzed properly is shifting in favor of the buyers, therefore is it only natural that we go long on the pair.
Disclosure: I am part of Trade Nation's Influencer program and receive a monthly fee for using their TradingView charts in my analysis.
❤️ Please, support our work with like & comment! ❤️

#NQ1! "E-Mini Nasdaq 100" Index Market Bullish Robbery Plan 🌟Hi! Hola! Ola! Bonjour! Hallo! Marhaba!🌟
Dear Money Makers & Robbers, 🤑 💰💸✈️
Based on 🔥Thief Trading style technical and fundamental analysis🔥, here is our master plan to heist the NQ1! "E-Mini Nasdaq 100" Index Market Heist. Please adhere to the strategy I've outlined in the chart, which emphasizes long entry. Our aim is to escape near the high-risk YELLOW MA Zone. It's a Risky level, overbought market, consolidation, trend reversal, trap at the level where traders and bearish robbers are stronger. 🏆💸"Take profit and treat yourself, traders. You deserve it!💪🏆🎉
Entry 📈 : "The heist is on! Wait for the Crossing previous high (19800) then make your move - Bullish profits await!"
however I advise to Place Buy stop orders above the Moving average (or) Place buy limit orders within a 15 or 30 minute timeframe most recent or swing, low or high level for Pullback entries.
📌I strongly advise you to set an "alert (Alarm)" on your chart so you can see when the breakout entry occurs.
Stop Loss 🛑: "🔊 Yo, listen up! 🗣️ If you're lookin' to get in on a buy stop order, don't even think about settin' that stop loss till after the breakout 🚀. You feel me? Now, if you're smart, you'll place that stop loss where I told you to 📍, but if you're a rebel, you can put it wherever you like 🤪 - just don't say I didn't warn you ⚠️. You're playin' with fire 🔥, and it's your risk, not mine 👊."
📍 Thief SL placed at the nearest/swing low level Using the 2H timeframe (19200) Day trade basis.
📍 SL is based on your risk of the trade, lot size and how many multiple orders you have to take.
🏴☠️Target 🎯: 20500
🧲Scalpers, take note 👀 : only scalp on the Long side. If you have a lot of money, you can go straight away; if not, you can join swing traders and carry out the robbery plan. Use trailing SL to safeguard your money 💰.
💰💵💸NQ1! "E-Mini Nasdaq 100" Index Money Heist Plan is currently experiencing a bullishness,., driven by several key factors. .☝☝☝
📰🗞️Get & Read the Fundamental, Macro Economics, COT Report, Geopolitical and News Analysis, Sentimental Outlook, Intermarket Analysis, Index-Specific Analysis, Future trend targets with Overall outlook score... go ahead to check 👉👉👉🔗🔗🌎🌏🗺
⚠️Trading Alert : News Releases and Position Management 📰🗞️🚫🚏
As a reminder, news releases can have a significant impact on market prices and volatility. To minimize potential losses and protect your running positions,
we recommend the following:
Avoid taking new trades during news releases
Use trailing stop-loss orders to protect your running positions and lock in profits
💖Supporting our robbery plan 💥Hit the Boost Button💥 will enable us to effortlessly make and steal money 💰💵. Boost the strength of our robbery team. Every day in this market make money with ease by using the Thief Trading Style.🏆💪🤝❤️🎉🚀
I'll see you soon with another heist plan, so stay tuned 🤑🐱👤🤗🤩

EURCAD What Next? BUY!
My dear subscribers,
This is my opinion on the EURCAD next move:
The instrument tests an important psychological level 1.5605
Bias - Bullish
Technical Indicators: Supper Trend gives a precise Bullish signal, while Pivot Point HL predicts price changes and potential reversals in the market.
Target - 1.5669
About Used Indicators:
On the subsequent day, trading above the pivot point is thought to indicate ongoing bullish sentiment, while trading below the pivot point indicates bearish sentiment.
Disclosure: I am part of Trade Nation's Influencer program and receive a monthly fee for using their TradingView charts in my analysis.
———————————
WISH YOU ALL LUCK

Gold may break resistance level and then continue to growHello traders, I want share with you my opinion about Gold. In this chart, price previously formed a clear triangle pattern, where price was squeezed between two converging trend lines. After a period of consolidation, the market broke above this formation, reaching the resistance zone near 3365, but then started to retrace. Following that breakout, a new structure emerged, an upward wedge. The asset has been moving within this narrowing channel, forming higher lows and approaching the upper boundary with weakening momentum. This type of pattern often signals an upcoming strong move once the price breaks out from either side. Currently, Gold is trading near the resistance line of the wedge and just beneath the seller zone. I expect that the price may fall back to the support line of the wedge around the 3205 - 3185 area. After that, a bounce from this zone could trigger a bullish breakout from the wedge. That’s why I set my TP 1 at the 3420 level, this target aligns with a full wedge breakout and continuation of the upward movement through the resistance level and beyond the seller zone. Please share this idea with your friends and click Boost 🚀
Disclaimer: As part of ThinkMarkets’ Influencer Program, I am sponsored to share and publish their charts in my analysis.

BITCOIN - Price will continue to grow inside rising channelHi guys, this is my overview for BTCUSDT, feel free to check it and write your feedback in comments👊
Price started to grow inside rising channel, where it declined to support line and then bounced up to $93100 level.
BTC broke this level at once and then some time traded near, after which bounced and continued to grow.
Soon BTC made a correction, but quickly turned around and later rose to $104900 level, after which started to decline.
After price fell a little, it made an upward impulse to resistance line of channel, breaking $104900 level.
But not long time ago, BTC bounced from this line and started to decline, so I think that price can continue to fall.
Also, I expect that price will fall to support area and then turn around and continue to grow in channel to $113700
If this post is useful to you, you can support me with like/boost and advice in comments❤️

USOIL Will Go Higher From Support! Buy!
Please, check our technical outlook for USOIL.
Time Frame: 9h
Current Trend: Bullish
Sentiment: Oversold (based on 7-period RSI)
Forecast: Bullish
The price is testing a key support 61.684.
Current market trend & oversold RSI makes me think that buyers will push the price. I will anticipate a bullish movement at least to 64.409 level.
P.S
Please, note that an oversold/overbought condition can last for a long time, and therefore being oversold/overbought doesn't mean a price rally will come soon, or at all.
Disclosure: I am part of Trade Nation's Influencer program and receive a monthly fee for using their TradingView charts in my analysis.
Like and subscribe and comment my ideas if you enjoy them!

CADJPY Will Go Higher! Long!
Take a look at our analysis for CADJPY.
Time Frame: 1D
Current Trend: Bullish
Sentiment: Oversold (based on 7-period RSI)
Forecast: Bullish
The market is testing a major horizontal structure 103.810.
Taking into consideration the structure & trend analysis, I believe that the market will reach 105.723 level soon.
P.S
We determine oversold/overbought condition with RSI indicator.
When it drops below 30 - the market is considered to be oversold.
When it bounces above 70 - the market is considered to be overbought.
Disclosure: I am part of Trade Nation's Influencer program and receive a monthly fee for using their TradingView charts in my analysis.
Like and subscribe and comment my ideas if you enjoy them!

GOLD BULLS WILL DOMINATE THE MARKET|LONG
GOLD SIGNAL
Trade Direction: long
Entry Level: 3,297.95
Target Level: 3,337.98
Stop Loss: 3,271.20
RISK PROFILE
Risk level: medium
Suggested risk: 1%
Timeframe: 1h
Disclosure: I am part of Trade Nation's Influencer program and receive a monthly fee for using their TradingView charts in my analysis.
✅LIKE AND COMMENT MY IDEAS✅

NZDCAD The Target Is UP! BUY!
My dear followers,
This is my opinion on the NZDCAD next move:
The asset is approaching an important pivot point 0.8191
Bias - Bullish
Technical Indicators: Supper Trend generates a clear long signal while Pivot Point HL is currently determining the overall Bullish trend of the market.
Goal - 0.8219
About Used Indicators:
For more efficient signals, super-trend is used in combination with other indicators like Pivot Points.
Disclosure: I am part of Trade Nation's Influencer program and receive a monthly fee for using their TradingView charts in my analysis.
———————————
WISH YOU ALL LUCK

doge buy midterm"🌟 Welcome to Golden Candle! 🌟
We're a team of 📈 passionate traders 📉 who love sharing our 🔍 technical analysis insights 🔎 with the TradingView community. 🌎
Our goal is to provide 💡 valuable perspectives 💡 on market trends and patterns, but 🚫 please note that our analyses are not intended as buy or sell recommendations. 🚫
Instead, they reflect our own 💭 personal attitudes and thoughts. 💭
Follow along and 📚 learn 📚 from our analyses! 📊💡"

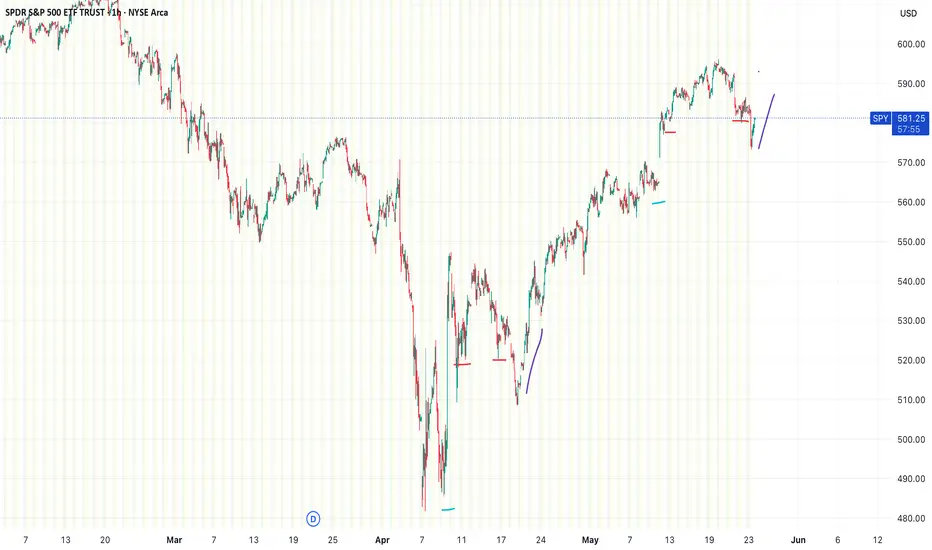
Repeat of Late Apr-May lows & rallyThe chart shows the SPDR S&P 500 ETF Trust (SPY) on a 1-hour timeframe, with a pattern appearing to be repeating itself from late April/May(Liberation day announcements) dip and then boot and rally from trade announcements, all marked by colored lines.
The colored lines (blue, red, purple) highlight a recurring price action setup. Each set of lines seems to mark a sequence of movements:
Blue: Sharp drop, then gap up
Red: Consolidation at a lower higher from gap up, return to high, consolidation back lower at previous lower high
Purple: Breakout & reversal upward.
HelenP. I Bitcoin may continue to grow inside upward channelHi folks today I'm prepared for you Bitcoin analytics. In this chart, we can see how the price has been steadily moving within a well-defined upward channel, respecting its trend structure with clean rebounds from the lower boundary. The price has shown signs of a minor pullback after reaching the upper part of the consolidation range. However, it remains well-supported above the 102700 - 104700 zone, which aligns closely with both the trend line and a previous accumulation area. This confluence strengthens the case for a bullish continuation. Given the consistently higher lows, strong reaction from buyers near the channel support, and the overall bullish momentum, I believe this correction will be short-lived. The market appears to be gathering liquidity before attempting another leg upward. If the current structure holds, BTCUSDT is likely to continue climbing along the lower edge of the channel, gradually pushing toward the next significant target. My current goal remains at 117000 points, a level that aligns with the channel’s upper resistance and reflects the natural extension of the ongoing bullish movement. If you like my analytics you may support me with your like/comment ❤️

Euro will start to grow from support and then leave pennantHello traders, I want share with you my opinion about Euro. Previously, price was moving confidently inside an upward channel, forming steady higher highs and higher lows. After a clear breakout from that structure, the price started consolidating inside a new pattern, an upward pennant. This formation usually appears as a continuation structure, where the market builds pressure before a new impulse. Currently, the price is trading near the middle of the pennant, after rolling down from the resistance line and rebounding up from the support area. The structure is compressing, and a retest of the support line near 1.1155 may occur before a breakout happens. Given the confluence of the pennant structure, the strong support area, and the previous bullish momentum, I expect the Euro to rebound again from the lower trend line and initiate an upward breakout. That’s why I set my TP 1 at the 1.1500 level, a logical target aligned with the upper boundary of the pattern and next key resistance. Please share this idea with your friends and click Boost 🚀
Disclaimer: As part of ThinkMarkets’ Influencer Program, I am sponsored to share and publish their charts in my analysis.

USDCAD Is Bullish! Buy!
Take a look at our analysis for USDCAD.
Time Frame: 10h
Current Trend: Bullish
Sentiment: Oversold (based on 7-period RSI)
Forecast: Bullish
The market is on a crucial zone of demand 1.379.
The oversold market condition in a combination with key structure gives us a relatively strong bullish signal with goal 1.387 level.
P.S
The term oversold refers to a condition where an asset has traded lower in price and has the potential for a price bounce.
Overbought refers to market scenarios where the instrument is traded considerably higher than its fair value. Overvaluation is caused by market sentiments when there is positive news.
Disclosure: I am part of Trade Nation's Influencer program and receive a monthly fee for using their TradingView charts in my analysis.
Like and subscribe and comment my ideas if you enjoy them!

USDCAD Massive Long! BUY!
My dear subscribers,
USDCAD looks like it will make a good move, and here are the details:
The market is trading on 1.3814 pivot level.
Bias - Bullish
My Stop Loss - 1.3784
Technical Indicators: Both Super Trend & Pivot HL indicate a highly probable Bullish continuation.
Target - 1.3877
About Used Indicators:
The average true range (ATR) plays an important role in 'Supertrend' as the indicator uses ATR to calculate its value. The ATR indicator signals the degree of price volatility.
Disclosure: I am part of Trade Nation's Influencer program and receive a monthly fee for using their TradingView charts in my analysis.
———————————
WISH YOU ALL LUCK

GBPUSD Will Go Up! Buy!
Please, check our technical outlook for GBPUSD.
Time Frame: 4h
Current Trend: Bullish
Sentiment: Oversold (based on 7-period RSI)
Forecast: Bullish
The price is testing a key support 1.341.
Current market trend & oversold RSI makes me think that buyers will push the price. I will anticipate a bullish movement at least to 1.350 level.
P.S
Please, note that an oversold/overbought condition can last for a long time, and therefore being oversold/overbought doesn't mean a price rally will come soon, or at all.
Disclosure: I am part of Trade Nation's Influencer program and receive a monthly fee for using their TradingView charts in my analysis.
Like and subscribe and comment my ideas if you enjoy them!
