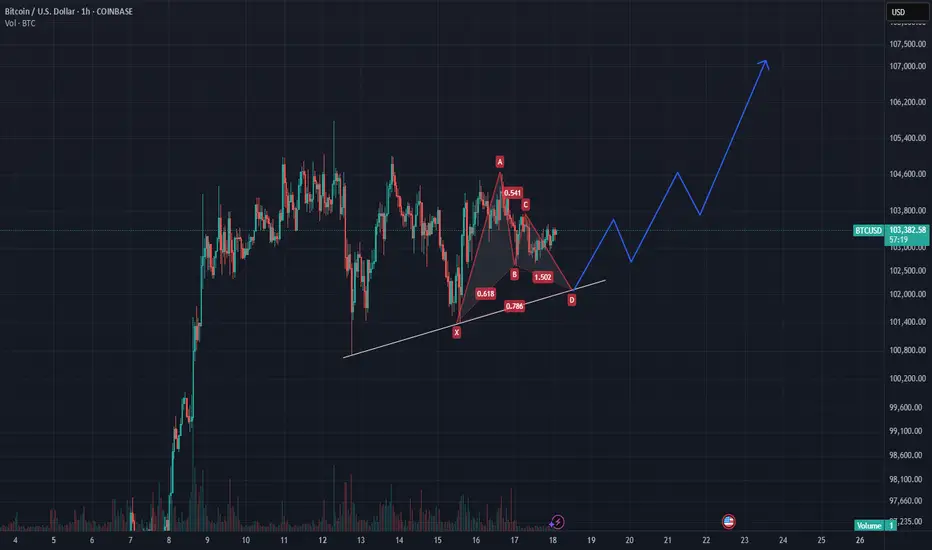
BTC/USDT Long Trade SetupBINANCE:BTCUSDT.P
Entry 104460
SL 104100
TGT 106840
W Pattern Trade with Fibo 0.5 rejection
LONG

doge buy midterm"🌟 Welcome to Golden Candle! 🌟
We're a team of 📈 passionate traders 📉 who love sharing our 🔍 technical analysis insights 🔎 with the TradingView community. 🌎
Our goal is to provide 💡 valuable perspectives 💡 on market trends and patterns, but 🚫 please note that our analyses are not intended as buy or sell recommendations. 🚫
Instead, they reflect our own 💭 personal attitudes and thoughts. 💭
Follow along and 📚 learn 📚 from our analyses! 📊💡"

POL/USDT Potential UpsidesHey Traders, in today's trading session we are monitoring POL/USDT for a buying opportunity around 0.2200 zone, POL/USDT is trading in an uptrend and currently is in a correction phase in which it is approaching the trend at 0.2200 support and resistance area.
Trade safe, Joe.

CHFJPY: Long Trade Explained
CHFJPY
- Classic bullish setup
- Our team expects bullish continuation
SUGGESTED TRADE:
Swing Trade
Long CHFJPY
Entry Point - 173.57
Stop Loss - 173.03
Take Profit - 174.53
Our Risk - 1%
Start protection of your profits from lower levels
Disclosure: I am part of Trade Nation's Influencer program and receive a monthly fee for using their TradingView charts in my analysis.
❤️ Please, support our work with like & comment! ❤️

CADJPY: Long Trade with Entry/SL/TP
CADJPY
- Classic bullish formation
- Our team expects growth
SUGGESTED TRADE:
Swing Trade
Buy CADJPY
Entry Level - 103.60
Sl - 103.05
Tp - 104.64
Our Risk - 1%
Start protection of your profits from lower levels
Disclosure: I am part of Trade Nation's Influencer program and receive a monthly fee for using their TradingView charts in my analysis.
❤️ Please, support our work with like & comment! ❤️

AUDUSD: Bullish Forecast & Bullish Scenario
The recent price action on the AUDUSD pair was keeping me on the fence, however, my bias is slowly but surely changing into the bullish one and I think we will see the price go up.
Disclosure: I am part of Trade Nation's Influencer program and receive a monthly fee for using their TradingView charts in my analysis.
❤️ Please, support our work with like & comment! ❤️

NZDJPY Will Go Up From Support! Buy!
Please, check our technical outlook for NZDJPY.
Time Frame: 1h
Current Trend: Bullish
Sentiment: Oversold (based on 7-period RSI)
Forecast: Bullish
The price is testing a key support 85.439.
Current market trend & oversold RSI makes me think that buyers will push the price. I will anticipate a bullish movement at least to 85.706 level.
P.S
We determine oversold/overbought condition with RSI indicator.
When it drops below 30 - the market is considered to be oversold.
When it bounces above 70 - the market is considered to be overbought.
Disclosure: I am part of Trade Nation's Influencer program and receive a monthly fee for using their TradingView charts in my analysis.
Like and subscribe and comment my ideas if you enjoy them!

USDJPY Expected Growth! BUY!
My dear friends,
USDJPY looks like it will make a good move, and here are the details:
The market is trading on 144.56 pivot level.
Bias - Bearish
Technical Indicators: Supper Trend generates a clear short signal while Pivot Point HL is currently determining the overall Bearish trend of the market.
Goal - 145.11
About Used Indicators:
Pivot points are a great way to identify areas of support and resistance, but they work best when combined with other kinds of technical analysis
Disclosure: I am part of Trade Nation's Influencer program and receive a monthly fee for using their TradingView charts in my analysis.
———————————
WISH YOU ALL LUCK

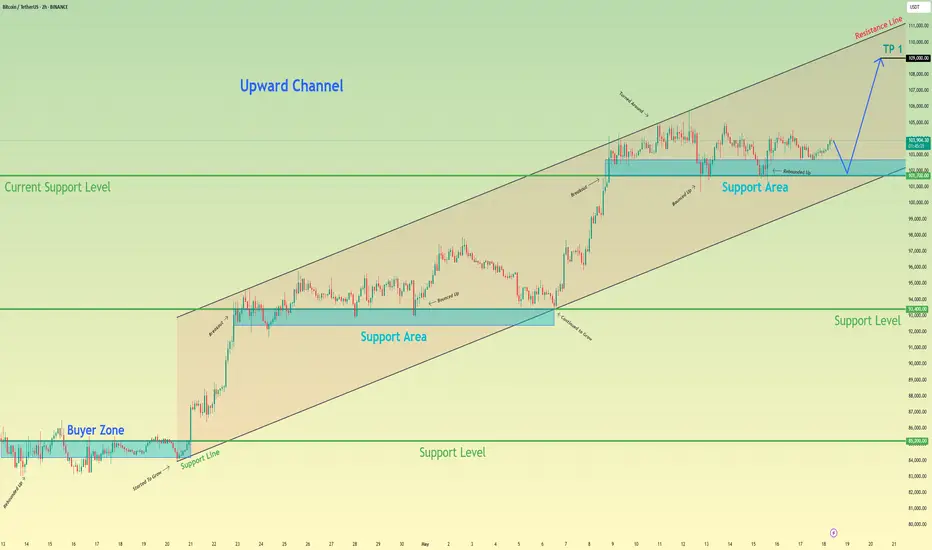
Bitcoin can continue grow in channel, after small correctionHello traders, I want share with you my opinion about Bitcoin. In this chart, we can see how the price remains inside a clear upward channel, respecting both support and resistance boundaries. After breaking above the 93400 - 92400 support area, the price continued to grow and formed a new support zone between 101700 - 102700 points. This area has been tested several times, showing strong buyer interest and keeping the bullish structure intact. Right now, BTC is hovering just above this support area. A minor correction down to this zone would be healthy and could provide fuel for the next upward leg. The market structure shows higher highs and higher lows, typical of a stable channel-driven trend. As long as the price stays above 101700 points, I expect it to move toward the upper channel boundary. That’s why my current target is set at 109000 points, which is the next key resistance and the top of the channel. This move would align with the current trend and follow the previous impulse-retracement pattern we’ve seen throughout this structure. Please share this idea with your friends and click Boost 🚀
EURO - Price can make small correction and then bounce upHi guys, this is my overview for EURO, feel free to check it and write your feedback in comments👊
Recently, price entered to falling channel, where it at once fell to $1.1330 level and then not long time traded near this level.
Next, price rose to resistance line of channel, and some time traded near, after which dropped.
Price broke $1.1330 level and started to traded below this level, and later it continued to decline in channel.
Later, Euro made a gap and then exited from channel, after which turned around and started to grow in a rising channel.
In this channel, price broke $1.1140 level and continued to move up until it reached resistance line.
Then price corrected, and now I expect that Euro can bounce up from support area to $1.1280 inside channel.
If this post is useful to you, you can support me with like/boost and advice in comments❤️
Disclaimer: As part of ThinkMarkets’ Influencer Program, I am sponsored to share and publish their charts in my analysis.

NZD/CAD BUYERS WILL DOMINATE THE MARKET|LONG
Hello, Friends!
NZD-CAD downtrend evident from the last 1W red candle makes longs trades more risky, but the current set-up targeting 0.827 area still presents a good opportunity for us to buy the pair because the support line is nearby and the BB lower band is close which indicates the oversold state of the NZD/CAD pair.
Disclosure: I am part of Trade Nation's Influencer program and receive a monthly fee for using their TradingView charts in my analysis.
✅LIKE AND COMMENT MY IDEAS✅

Apple respite before sell offApple bounced straight of major support at circa $170, with the SMI now also rising we could see a few weeks of short term respite before continuing down to test the major support line again. Also notice a backtest of the rising trend at around 21%.
Long term view is still bearish, don't think we've seen the yearly bottoms yet. Will be interesting to see how this plays out especially with bonds.

US30 Breakdown May 19thWhy shouldn't you write with a broken pen? Because it's pointless. Just like your life if you don't stay focused on your purpose. Ok let's get to work!
Price is on a beautiful uptrend and right now it's on a retracement down to 42650 area. I believe price will continue to push up to the 42870 Level.
How I'll enter
I am going to wait for price to get down to the 42650 level
Wait for a break of structure as confirmation for a buy (on a 1min)
Then Buy
But like my ex, price does whatever it wants, so be careful and always wait for a break and retest or a break of structure near the key areas.
Have fun. And trade responsibly

BTC, last Chance in this bull market?Hello everyone,
the market was very challenging within the last weeks, because there had been many ways to count, which is the most difficult part of elliot wave analysis. The reason was, that the price was in a correction/ consolidation, which I assume has now finally ended. Trump accounced that they picket 5 coins for the strategic reserve:
BTC
ETH
XRP
SOL
ADA
This aligns very well to what people have waited for. If you believe in a finall bull run, these 5 could be part of your portfolio. I would also recommend to have a look at LINK and LTC, as they are performing quiet well.

SILVER My Opinion! BUY!
My dear friends,
Please, find my technical outlook for SILVER below:
The instrument tests an important psychological level 32.284
Bias - Bullish
Technical Indicators: Supper Trend gives a precise Bullish signal, while Pivot Point HL predicts price changes and potential reversals in the market.
Target - 32.607
Recommended Stop Loss - 32.097
About Used Indicators:
Super-trend indicator is more useful in trending markets where there are clear uptrends and downtrends in price.
Disclosure: I am part of Trade Nation's Influencer program and receive a monthly fee for using their TradingView charts in my analysis.
———————————
WISH YOU ALL LUCK

CHFJPY Trading Opportunity! BUY!
My dear subscribers,
CHFJPY looks like it will make a good move, and here are the details:
The market is trading on 173.90 pivot level.
Bias - Bullish
My Stop Loss - 173.48
Technical Indicators: Both Super Trend & Pivot HL indicate a highly probable Bullish continuation.
Target - 174.66
About Used Indicators:
The average true range (ATR) plays an important role in 'Supertrend' as the indicator uses ATR to calculate its value. The ATR indicator signals the degree of price volatility.
Disclosure: I am part of Trade Nation's Influencer program and receive a monthly fee for using their TradingView charts in my analysis.
———————————
WISH YOU ALL LUCK

GBPAUD: Growth & Bullish Forecast
It is essential that we apply multitimeframe technical analysis and there is no better example of why that is the case than the current GBPAUD chart which, if analyzed properly, clearly points in the upward direction.
Disclosure: I am part of Trade Nation's Influencer program and receive a monthly fee for using their TradingView charts in my analysis.
❤️ Please, support our work with like & comment! ❤️

BITCOIN Will Go Higher! Long!
Here is our detailed technical review for BITCOIN.
Time Frame: 1D
Current Trend: Bullish
Sentiment: Oversold (based on 7-period RSI)
Forecast: Bullish
The market is trading around a solid horizontal structure 102,856.61.
The above observations make me that the market will inevitably achieve 117,574.76 level.
P.S
Overbought describes a period of time where there has been a significant and consistent upward move in price over a period of time without much pullback.
Disclosure: I am part of Trade Nation's Influencer program and receive a monthly fee for using their TradingView charts in my analysis.
Like and subscribe and comment my ideas if you enjoy them!

USDJPY Will Go Up! Buy!
Take a look at our analysis for USDJPY.
Time Frame: 2h
Current Trend: Bullish
Sentiment: Oversold (based on 7-period RSI)
Forecast: Bullish
The market is testing a major horizontal structure 144.899.
Taking into consideration the structure & trend analysis, I believe that the market will reach 146.054 level soon.
P.S
Please, note that an oversold/overbought condition can last for a long time, and therefore being oversold/overbought doesn't mean a price rally will come soon, or at all.
Disclosure: I am part of Trade Nation's Influencer program and receive a monthly fee for using their TradingView charts in my analysis.
Like and subscribe and comment my ideas if you enjoy them!

GBPCAD Is Bullish! Long!
Here is our detailed technical review for GBPCAD.
Time Frame: 1D
Current Trend: Bullish
Sentiment: Oversold (based on 7-period RSI)
Forecast: Bullish
The market is approaching a significant support area 1.865.
The underlined horizontal cluster clearly indicates a highly probable bullish movement with target 1.902 level.
P.S
We determine oversold/overbought condition with RSI indicator.
When it drops below 30 - the market is considered to be oversold.
When it bounces above 70 - the market is considered to be overbought.
Disclosure: I am part of Trade Nation's Influencer program and receive a monthly fee for using their TradingView charts in my analysis.
Like and subscribe and comment my ideas if you enjoy them!

BTC Bullish Deep CrabAn idea to display an potential Deep Crab idea. This might hit the support line at 98k that was the last resistance from the last rally. Whether this holds is another story. Thank you

BTC Bullish GartleyAn idea to display an potential Gartley idea. This might hit the trendline that is upsloping. Whether this holds is another story. Thank you
AUDUSD Is Very Bullish! Buy!
Take a look at our analysis for AUDUSD.
Time Frame: 30m
Current Trend: Bullish
Sentiment: Oversold (based on 7-period RSI)
Forecast: Bullish
The market is on a crucial zone of demand 0.640.
The oversold market condition in a combination with key structure gives us a relatively strong bullish signal with goal 0.641 level.
P.S
We determine oversold/overbought condition with RSI indicator.
When it drops below 30 - the market is considered to be oversold.
When it bounces above 70 - the market is considered to be overbought.
Disclosure: I am part of Trade Nation's Influencer program and receive a monthly fee for using their TradingView charts in my analysis.
Like and subscribe and comment my ideas if you enjoy them!
