HelenP. I Bitcoin will fall to support zone and then start riseHi folks today I'm prepared for you Bitcoin analytics. This chart shows how the price continues to trade inside a rising channel, with the price currently hovering just above the support zone around 101000. After forming a clean consolidation phase near the upper boundary of the structure, the market is showing signs of a potential pullback toward this zone. However, the broader trend remains bullish, and as long as price holds within the ascending formation, this correction may act as a base for the next move higher. The consolidation structure formed at the top indicates that buyers are not rushing in aggressively, but they are also not allowing prices to drop sharply, a classic sign of accumulation. This aligns well with the previously confirmed trend line and horizontal support zone. If BTC holds this area and finds renewed momentum, I expect a breakout from the consolidation range to the upside. My goal remains at 107000 points, which sits a little higher than the projected top of the current channel. Given the strength of the structure, the higher lows, and the recent defense of support, I maintain a bullish bias and anticipate another upward wave from this level. If you like my analytics you may support me with your like/comment ❤️
LONG

Gold can correct to support line of channel and then start growHello traders, I want share with you my opinion about Gold. In this chart, we can see how the price, after forming a triangle structure and breaking out to the upside, Gold entered a downward channel, where it has been consistently respecting both the resistance and support lines. Each bounce from the lower boundary of this channel signals local buyer interest, especially near the support level around 3060, which also overlaps with the buyer zone. Recently, the price rebounded from this support line, indicating a potential start of a bullish correction inside the channel. This move is consistent with past price behavior, strong impulses from the bottom boundary followed by gradual movement toward the upper resistance line. Given the structure and the ongoing bounce, I expect Gold can correct the support line of the channel, after which it turns around and starts to grow to the 3290 resistance level, which aligns with the upper boundary of the pattern and the beginning of the seller zone. That’s why my TP 1 is set at 3290 points - a reasonable technical target within the current channel formation. Please share this idea with your friends and click Boost 🚀
Disclaimer: As part of ThinkMarkets’ Influencer Program, I am sponsored to share and publish their charts in my analysis.

BITCOIN - Price can leave pennant and rise to $106500 pointsHi guys, this is my overview for BTCUSDT, feel free to check it and write your feedback in comments👊
Some time ago, price traded inside a flat, where it declined to the $93400 support level and then rose to the top part of the flat.
Then it corrected, after which made a strong upward impulse, exiting from flat, and continued to grow in pennant.
In pennant, BTC broke $97800 and $102300 levels, after which it made retest and continued to grow to resistance line.
When the price reached this line, it corrected to support area, after which tried to grow, but failed and fell back.
But recently it rose to the resistance line of the pennant, where at the moment it continued to trades near.
In my opinion, BTC can correct to support line and then bounce up to $106500, exiting from the pennant.
If this post is useful to you, you can support me with like/boost and advice in comments❤️

EURUSD: Long Signal with Entry/SL/TP
EURUSD
- Classic bullish formation
- Our team expects growth
SUGGESTED TRADE:
Swing Trade
Buy EURUSD
Entry Level - 1.1202
Sl - 1.1128
Tp - 1.1344
Our Risk - 1%
Start protection of your profits from lower levels
Disclosure: I am part of Trade Nation's Influencer program and receive a monthly fee for using their TradingView charts in my analysis.
❤️ Please, support our work with like & comment! ❤️

CHFJPY: Trading Signal From Our Team
CHFJPY
- Classic bullish formation
- Our team expects pullback
SUGGESTED TRADE:
Swing Trade
Long CHFJPY
Entry - 173.86
Sl - 173.44
Tp - 174.83
Our Risk - 1%
Start protection of your profits from lower levels
Disclosure: I am part of Trade Nation's Influencer program and receive a monthly fee for using their TradingView charts in my analysis.
❤️ Please, support our work with like & comment! ❤️

EURJPY Will Explode! BUY!
My dear friends,
EURJPY looks like it will make a good move, and here are the details:
The market is trading on 162.89 pivot level.
Bias - Bullish
Technical Indicators: Supper Trend generates a clear long signal while Pivot Point HL is currently determining the overall Bullish trend of the market.
Goal - 163.75
Recommended Stop Loss - 162.45
About Used Indicators:
Pivot points are a great way to identify areas of support and resistance, but they work best when combined with other kinds of technical analysis
Disclosure: I am part of Trade Nation's Influencer program and receive a monthly fee for using their TradingView charts in my analysis.
———————————
WISH YOU ALL LUCK

CADJPY: Expecting Bullish Continuation! Here is Why:
Balance of buyers and sellers on the CADJPY pair, that is best felt when all the timeframes are analyzed properly is shifting in favor of the buyers, therefore is it only natural that we go long on the pair.
Disclosure: I am part of Trade Nation's Influencer program and receive a monthly fee for using their TradingView charts in my analysis.
❤️ Please, support our work with like & comment! ❤️

AUDNZD: Growth & Bullish Continuation
The charts are full of distraction, disturbance and are a graveyard of fear and greed which shall not cloud our judgement on the current state of affairs in the AUDNZD pair price action which suggests a high likelihood of a coming move up.
Disclosure: I am part of Trade Nation's Influencer program and receive a monthly fee for using their TradingView charts in my analysis.
❤️ Please, support our work with like & comment! ❤️

GOLD Will Grow! Buy!
Here is our detailed technical review for GOLD.
Time Frame: 2h
Current Trend: Bullish
Sentiment: Oversold (based on 7-period RSI)
Forecast: Bullish
The market is trading around a solid horizontal structure 3,202.52.
The above observations make me that the market will inevitably achieve 3,258.41 level.
P.S
Please, note that an oversold/overbought condition can last for a long time, and therefore being oversold/overbought doesn't mean a price rally will come soon, or at all.
Disclosure: I am part of Trade Nation's Influencer program and receive a monthly fee for using their TradingView charts in my analysis.
Like and subscribe and comment my ideas if you enjoy them!

AUDJPY Will Go Up From Support! Long!
Please, check our technical outlook for AUDJPY.
Time Frame: 12h
Current Trend: Bullish
Sentiment: Oversold (based on 7-period RSI)
Forecast: Bullish
The market is approaching a key horizontal level 93.383.
Considering the today's price action, probabilities will be high to see a movement to 96.039.
P.S
We determine oversold/overbought condition with RSI indicator.
When it drops below 30 - the market is considered to be oversold.
When it bounces above 70 - the market is considered to be overbought.
Disclosure: I am part of Trade Nation's Influencer program and receive a monthly fee for using their TradingView charts in my analysis.
Like and subscribe and comment my ideas if you enjoy them!

AUDCHF Will Go Higher! Buy!
Here is our detailed technical review for AUDCHF.
Time Frame: 12h
Current Trend: Bullish
Sentiment: Oversold (based on 7-period RSI)
Forecast: Bullish
The market is approaching a significant support area 0.536.
The underlined horizontal cluster clearly indicates a highly probable bullish movement with target 0.548 level.
P.S
Overbought describes a period of time where there has been a significant and consistent upward move in price over a period of time without much pullback.
Disclosure: I am part of Trade Nation's Influencer program and receive a monthly fee for using their TradingView charts in my analysis.
Like and subscribe and comment my ideas if you enjoy them!

GBPJPY The Target Is UP! BUY!
My dear followers,
I analysed this chart on GBPJPY and concluded the following:
The market is trading on 193.32 pivot level.
Bias - Bullish
Technical Indicators: Both Super Trend & Pivot HL indicate a highly probable Bullish continuation.
Target - 194.72
About Used Indicators:
A super-trend indicator is plotted on either above or below the closing price to signal a buy or sell. The indicator changes color, based on whether or not you should be buying. If the super-trend indicator moves below the closing price, the indicator turns green, and it signals an entry point or points to buy.
Disclosure: I am part of Trade Nation's Influencer program and receive a monthly fee for using their TradingView charts in my analysis.
———————————
WISH YOU ALL LUCK

PRIME TIMEIt’s prime time for PRIME. Very low entry cost good risk to reward ratio, I believe with Bitcoin if it holds we could see PRIME do a very strong and fast push upwards. Not financial advice it’s just what I see. I was told I can’t post links in my ideas,
Long scalp if BTC breaks it’s downtrend, otherwise retrace downward until we get support as we are overbought on the daily but if this peaks we will see some price movement. If you follow me you have gained some scalp trades over 15-25% these past days on PRIME.
Good luck and have fun with it.
NC HAMMER CRYPTO will be my new name.

GOLD Sellers In Panic! BUY!
My dear subscribers,
This is my opinion on the GOLD next move:
The instrument tests an important psychological level 3209.1
Bias - Bullish
Technical Indicators: Supper Trend gives a precise Bullish signal, while Pivot Point HL predicts price changes and potential reversals in the market.
Target - 3224.3
My Stop Loss - 3201.4
About Used Indicators:
On the subsequent day, trading above the pivot point is thought to indicate ongoing bullish sentiment, while trading below the pivot point indicates bearish sentiment.
Disclosure: I am part of Trade Nation's Influencer program and receive a monthly fee for using their TradingView charts in my analysis.
———————————
WISH YOU ALL LUCK

EURJPY Expected Growth! BUY!
My dear subscribers,
EURJPY looks like it will make a good move, and here are the details:
The market is trading on 163.88 pivot level.
Bias - Bullish
Technical Indicators: Both Super Trend & Pivot HL indicate a highly probable Bullish continuation.
Target - 164.26
About Used Indicators:
The average true range (ATR) plays an important role in 'Supertrend' as the indicator uses ATR to calculate its value. The ATR indicator signals the degree of price volatility.
Disclosure: I am part of Trade Nation's Influencer program and receive a monthly fee for using their TradingView charts in my analysis.
———————————
WISH YOU ALL LUCK

EUR MXN LONG Investment Opportunity
The EUR/MXN pair is showing signs of recovery, with an interesting possibility of appreciation of the Euro against the Mexican Peso. In this analysis, we will explore a LONG strategy, with an entry point at 21.80, based on technical and fundamental considerations.
Position parameters:
Take Profit (TP): 22.80
Stop Loss (SL): 21.46
Trend analysis and motivations for LONG:
The Euro is showing a certain degree of stability thanks to the monetary policy of the ECB and the improving economic outlook in the Eurozone. On the other hand, the Mexican Peso could be pressured by the volatility of emerging markets and the decisions of Banxico on interest rates.
Graphically, the 21.80 level has acted as a key support, suggesting a favorable area for the opening of a LONG position. The 22.80 target represents a significant resistance, tested in previous market phases. If the bullish momentum is maintained, this level could be reached with a gradual progression.
Risk management and operational outlook:
The Stop Loss is positioned at 21.46, a point that could indicate a bearish breakout if reached. The risk/reward ratio appears balanced, allowing a prudent management of the position without exposing the capital to excessive risks.
Conclusion:
The LONG strategy on EUR/MXN is supported by technical and macroeconomic factors that indicate a possible revaluation of the Euro in the short-medium term. Monitoring global economic developments and central bank decisions will be essential to confirm the validity of this approach.

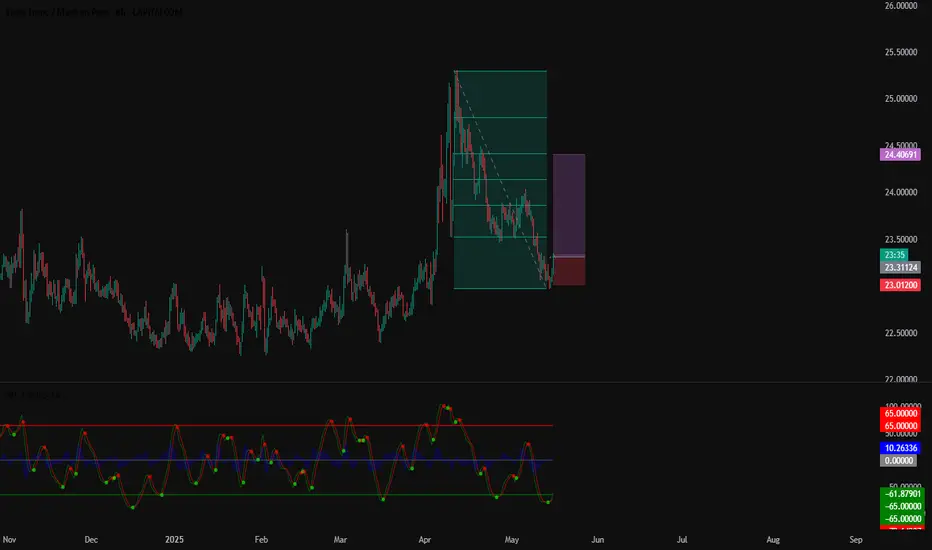
Investment Opportunity CHF/MXN LONG
The CHF/MXN cross is showing interesting signs of recovery after a consolidation phase. With a view to the strengthening of the Swiss Franc against the Mexican Peso, I decided to set a LONG position, with an entry point at 23.31.
Key levels of the strategy:
Take Profit (TP): 24.4060
Stop Loss (SL): 23.0100
Rationale for the LONG position:
Technical analysis suggests a potential rebound, supported by several macroeconomic factors. Switzerland continues to maintain a prudent monetary policy, with stable interest rates and a currency considered a safe haven in times of uncertainty. On the contrary, the Mexican Peso is subject to pressure from inflation and volatility in emerging markets.
Looking at the chart, the 23.31 level has proven to be a significant support, increasing the probability of a bullish move towards the 24.4060 target, a key resistance level that coincides with a previous distribution area.
Risk Management:
The Stop Loss is set at 23.0100, a level that, if reached, would invalidate my bullish idea and signal a possible trend reversal. With this setup, the risk/reward ratio is favorable, ensuring a balance between caution and profit opportunities.
Conclusion:
The current configuration of CHF/MXN presents an interesting opportunity for those looking for medium-term movements. If the momentum remains positive, the price could approach the 24.40 area, confirming the validity of the LONG strategy. Closely monitoring global economic dynamics and monetary policies will be key for active position management.
LONG GBP/CHF Investment Opportunity
Hello, I am Trader Andrea Russo, and today I want to share an investment opportunity that I consider extremely interesting: a LONG position on GBP/CHF.
In recent months, the GBP/CHF currency cross has shown signs of consolidation and a potential resumption of the bullish trend. In this article, I will analyze in detail the reasons that make this investment promising, the key points to monitor and the strategies to manage risk and maximize profits.
Investment Strategy: Main Points
Entry: The LONG position is opened at the price of 1.01119, a level that represents an interesting technical area and is located near the recent lows of the market.
Stop Loss (SL): To minimize risks, the SL is set at a distance of 0.95%. This level protects us from sudden movements contrary to our direction.
Take Profit (TP): The final target is set at 2.83%. This target allows us to capitalize on a significant bullish move.
GBP/CHF Technical Analysis
Technical analysis provides us with useful tools to understand the historical and future behavior of the market. In the case of GBP/CHF, there are some interesting signals:
1. Support and Resistance
Support: The level of 1.01119 is configured as a key support. Historically, the market has respected this area, bouncing on several occasions. This makes it the ideal level to position Long.
Resistance: The first significant resistance area is located around 1.03000. If the price breaks this threshold, it is likely to open up room for further bullish movements.
2. Moving Average and Trend
The 50 and 200-period moving averages on the daily chart indicate a possible bullish reversal. GBP/CHF is attempting to break above the short-term moving average, an encouraging sign for traders looking for Long opportunities.
3. Chart Patterns
A potential double bottom is forming on the 4H and daily charts. This pattern is a classic reversal indicator, suggesting growing strength among buyers.
4. Technical Indicators
RSI: The RSI indicator is currently in the neutral zone, around 50. A breakout above 60 would confirm the bullish strength.
MACD: The MACD oscillator is showing a bullish crossover, with the signal line above zero. This is another sign that the bullish momentum could gain strength.
Fundamental Analysis
Fundamental analysis is also crucial to support our strategy.
1. Monetary Policies and Interest Rate Differential
British Pound (GBP): The Bank of England has recently adopted a restrictive monetary policy, raising interest rates. This could favor an appreciation of the pound against the Swiss franc.
Swiss Franc (CHF): Swiss monetary policy, although historically prudent, could be affected by global inflation pressure, but the CHF remains less aggressive in raising rates.
2. Economic Context
Consumer confidence in the UK is recovering, and recent data shows stable GDP growth. These factors support a possible strengthening of the pound. On the other hand, the Swiss franc is influenced by increased demand for safe haven currencies, but could come under pressure in the context of a global economic recovery.
Risk Management
The most important aspect of any trading strategy is risk management:
Risk-Reward Ratio: With a SL of 0.95% and a TP of 2.83%, the risk-reward ratio is very favorable, above 1:3.
Diversification: This trade should be part of a diversified portfolio to minimize global risks.
Conclusions
Investing in GBP/CHF with a LONG position at 1.01119 represents an interesting opportunity based on both technical and fundamental analysis. The combination of key levels, technical signals and economic context suggests a potential bullish movement. However, let's remember that the market is unpredictable, and good risk management is essential.
I hope this analysis is useful for your trading strategy. If you have any questions or want to share your point of view, do not hesitate to do so in the comments!

EUR/GBP LONG Investment Opportunities: Technical Analysis
The currency market offers new investment opportunities, and among the most interesting pairs of the moment we find EUR/GBP, with a favorable configuration for a long trade.
Entry Point and Trading Objectives
Entry: 0.8526
Take Profit (TP): +1.34%
Stop Loss (SL): -0.44%
This trade is based on in-depth technical analysis, considering key support and resistance levels that reinforce the hypothesis of a bullish movement.
Technical Analysis and Market Trends
After a consolidation phase around the 0.8526 threshold, the currency cross shows signs of bullish strength, with technical indicators confirming a potential breakout.
Primary Trend: Bullish with dynamic support.
RSI: In the neutral zone, indicating room for further growth.
Moving Averages: The 50-period crossed the 200-period, a sign of positive momentum.
Optimism on the single currency is also supported by fundamental factors, including monetary policies of the European Central Bank (ECB) and economic dynamics of the United Kingdom.
Risk Management and Final Considerations
To mitigate market volatility, the trade is accompanied by a Stop Loss at -0.44%, to protect the capital from any unexpected reversals.
Investors interested in this opportunity should carefully monitor macroeconomic events, such as inflation data and interest rate decisions, which could influence the direction of the EUR/GBP exchange rate.

LONG EUR/SGD Investment Opportunity
Entry: 1.46708 Take Profit (TP): +1.33% Stop Loss (SL): -0.86%
📊 Market Overview
EUR/SGD is in a strategic zone, with an entry level set at 1.46708, an area that could act as a key support. The idea of this LONG trade is based on a possible resumption of the trend, taking advantage of a bullish movement in case of confirmation of the momentum.
🔍 Technical Analysis
Key Support: The price has tested the entry level several times, suggesting a potential base for a restart.
Resistance: The TP target implies a movement of +1.33%, indicating a possible breakout to new highs.
Stop Loss: The protection set at -0.86% helps manage the risk and minimize any losses.
📈 Risk Management
Capital management is crucial. With a Stop Loss of 0.86%, the risk is well calibrated against the potential gain of 1.33%, maintaining a positive risk/reward ratio.
🔥 Conclusion
If the price confirms the support and shows signs of strength, this LONG strategy on EUR/SGD could generate a favorable opportunity. However, it is always essential to monitor the market conditions and adjust the strategy if necessary.

NZDUSD: Long Trade Explained
NZDUSD
- Classic bullish pattern
- Our team expects retracement
SUGGESTED TRADE:
Swing Trade
Buy NZDUSD
Entry - 0.5869
Stop - 0.5842
Take - 0.5924
Our Risk - 1%
Start protection of your profits from lower levels
Disclosure: I am part of Trade Nation's Influencer program and receive a monthly fee for using their TradingView charts in my analysis.
❤️ Please, support our work with like & comment! ❤️

EURUSD Massive Long! BUY!
My dear friends,
Please, find my technical outlook for EURUSD below:
The price is coiling around a solid key level - 1.1186
Bias - Bullish
Technical Indicators: Pivot Points Low anticipates a potential price reversal.
Super trend shows a clear buy, giving a perfect indicators' convergence.
Goal - 1.1294
Safe Stop Loss - 1.1123
About Used Indicators:
The pivot point itself is simply the average of the high, low and closing prices from the previous trading day.
Disclosure: I am part of Trade Nation's Influencer program and receive a monthly fee for using their TradingView charts in my analysis.
———————————
WISH YOU ALL LUCK

NZDJPY: Bulls Will Push Higher
The price of NZDJPY will most likely increase soon enough, due to the demand beginning to exceed supply which we can see by looking at the chart of the pair.
Disclosure: I am part of Trade Nation's Influencer program and receive a monthly fee for using their TradingView charts in my analysis.
❤️Please, support our work with like & comment!❤️
