Dow Jones is Nearing an Important Support!!Hey Traders, in today's trading session we are monitoring US30 for a buying opportunity around 43,950 zone, Dow Jones is trading in an uptrend and currently is in a correction phase in which it is approaching the trend at 43,950 support and resistance area.
Trade safe, Joe.
LONG

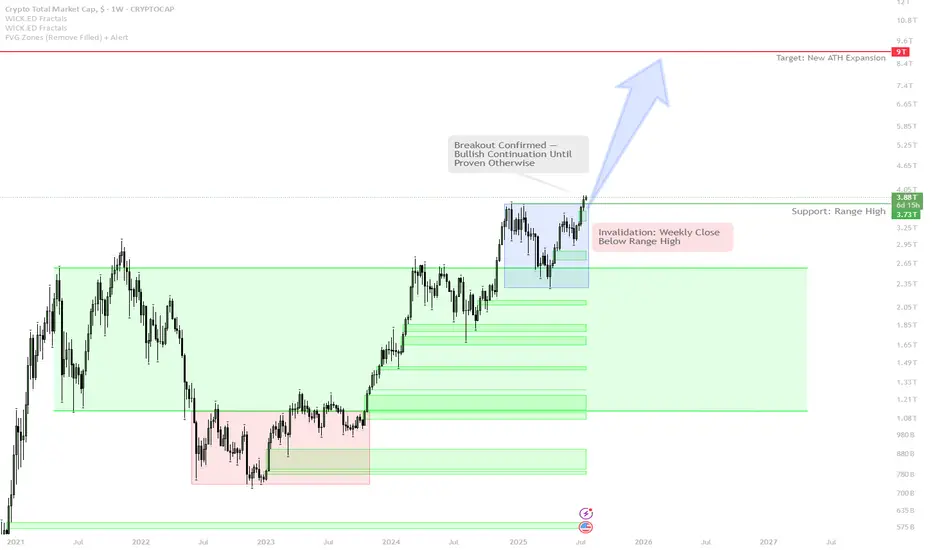
Total Crypto Market Cap: Weekly Breakout Signals Bull Run Contin
The weekly candle has closed above the key range high — this is a major bullish signal, similar to the breakout seen in early 2021.
As long as price remains above this breakout level, the scenario is a continuation uptrend — expect further expansion and strong price action.
If the market fails and closes back below the range high, the breakout will be invalidated — this would signal a potential range or pullback phase.
Current strategy is to trade with the trend:
Hold spot exposure and add on confirmed breakouts.
Do NOT short without a clear breakdown and structure reversal.
If a failed breakout occurs (weekly candle closes back below range high), take profit quickly and switch to risk-off mode.
Market psychology: Most buyers hesitate at lows, but FOMO after a strong move is classic. The disciplined approach is to buy the setup, not the hype.
This is a textbook technical breakout with historical precedence for explosive upside. As long as Total Market Cap holds above the range high, the path of least resistance is up. Attempting to fade the breakout is risky unless there is a clear weekly close back below the level. Trend continuation is favored until proven otherwise. The correct approach is to stay with the trend and manage risk only if a breakdown occurs.
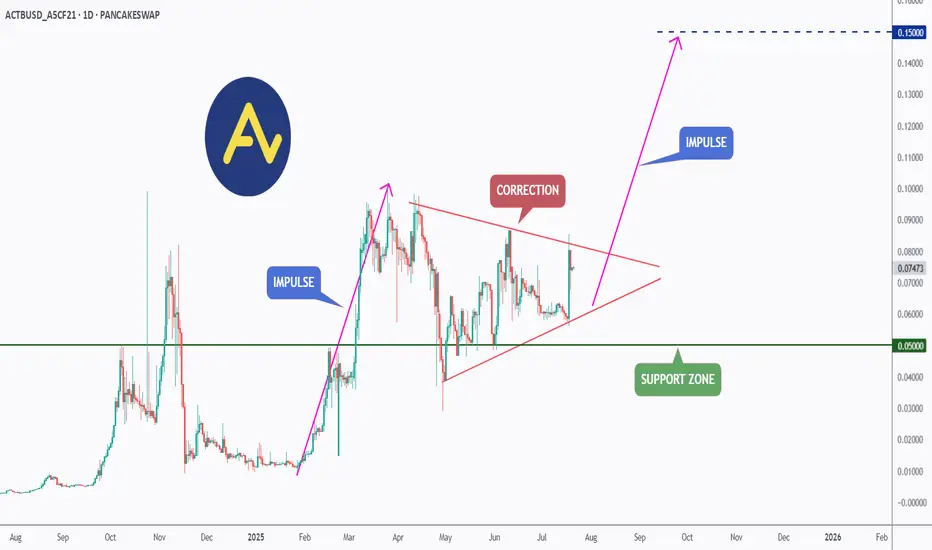
ACT (Acet) - Eyeing the Next Impulse Move?ACT has been forming a textbook bullish continuation pattern.↗️
After a strong impulse leg earlier this year, price has been consolidating within a symmetrical triangle, signaling a healthy correction phase.
🏹Today, ACT broke out of the triangle to the upside , indicating that bulls may be taking control once again.
📍If momentum continues, the next impulse move could push price toward the $0.15 resistance as a first target — a major psychological and technical level.
As long as the $0.050 support holds, ACT remains in bullish territory with upside potential in sight.
📚 Always follow your trading plan regarding entry, risk management, and trade management.
Good luck!
All Strategies Are Good; If Managed Properly!
~Richard Nasr
PUMP Trend Reversal – Testing 1H Supply FlipStep-by-step Price Scenario:
Price has broken the local downtrend and reclaimed the 1H supply zone, showing LTF strength.
Look for acceptance above 0.00445–0.00452 green zone for confirmation of the reversal.
If price holds above this zone, expect a move toward the next supply levels at 0.0048, then 0.0050, and 0.0054.
If price loses the green zone (close below 0.00436), scenario is invalidated—look for a retest of the previous lows near 0.00394.
Reasoning:
After a strong local downtrend, price has started to show reversal signs with a clear break and reclaim of the 1H supply zone. This area previously acted as resistance and now flipped to support, signaling the potential for a short-term rally. If buyers manage to hold above this new support, it would confirm the strength of the reversal and open up the path to test the next local supply zones above. However, failure to hold the reclaimed level (close below 0.00436) would invalidate this scenario and suggest the downtrend may continue. This setup is based on a classical supply/demand flip and early signs of bullish momentum on lower timeframes.

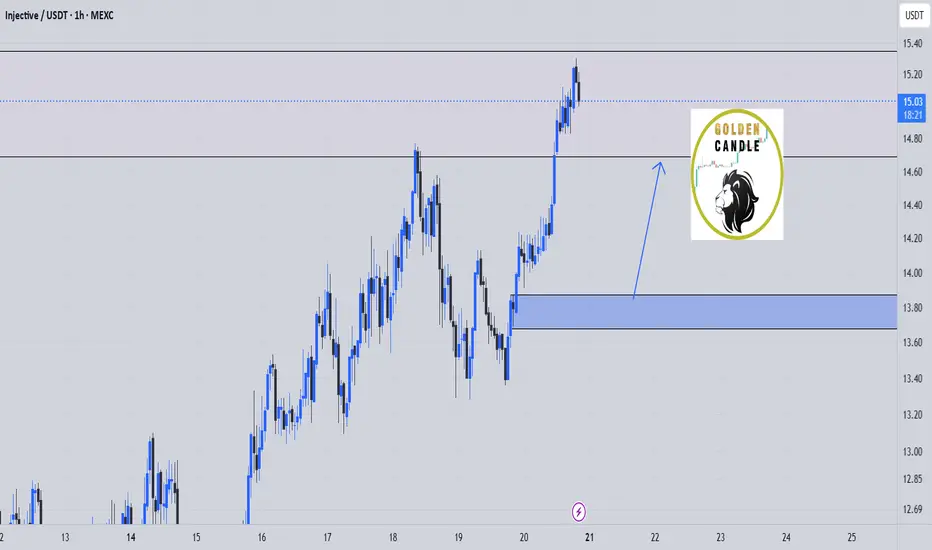
inj buy midterm"🌟 Welcome to Golden Candle! 🌟
We're a team of 📈 passionate traders 📉 who love sharing our 🔍 technical analysis insights 🔎 with the TradingView community. 🌎
Our goal is to provide 💡 valuable perspectives 💡 on market trends and patterns, but 🚫 please note that our analyses are not intended as buy or sell recommendations. 🚫
Instead, they reflect our own 💭 personal attitudes and thoughts. 💭
Follow along and 📚 learn 📚 from our analyses! 📊💡"
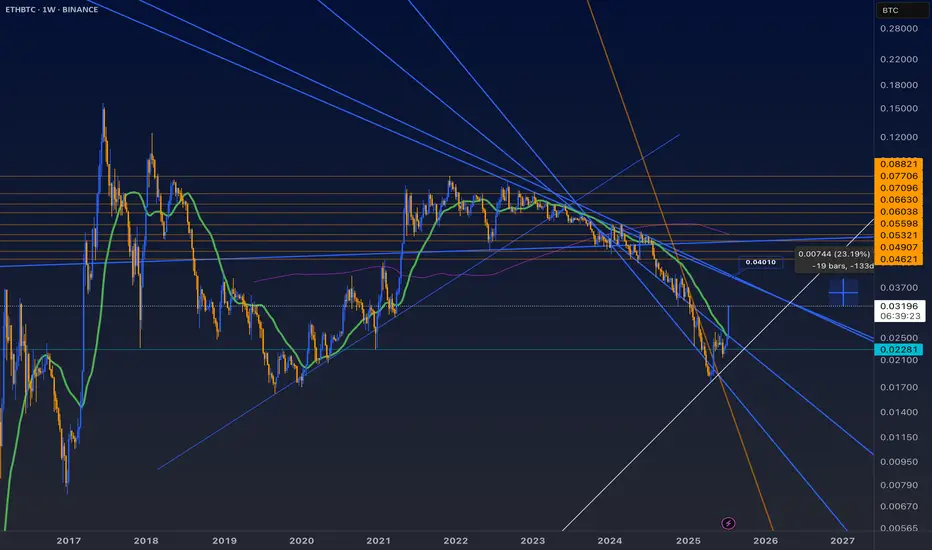
ETH/BTC 25-7-20I think there’s some clear headroom for more movement to 0.40 Ethereum per Bitcoin. Let’s see but right now is hot. Then the support after the 0.400 resistance is hit is back at 0.22, but who know what the price of Bitcoin would be at that point.
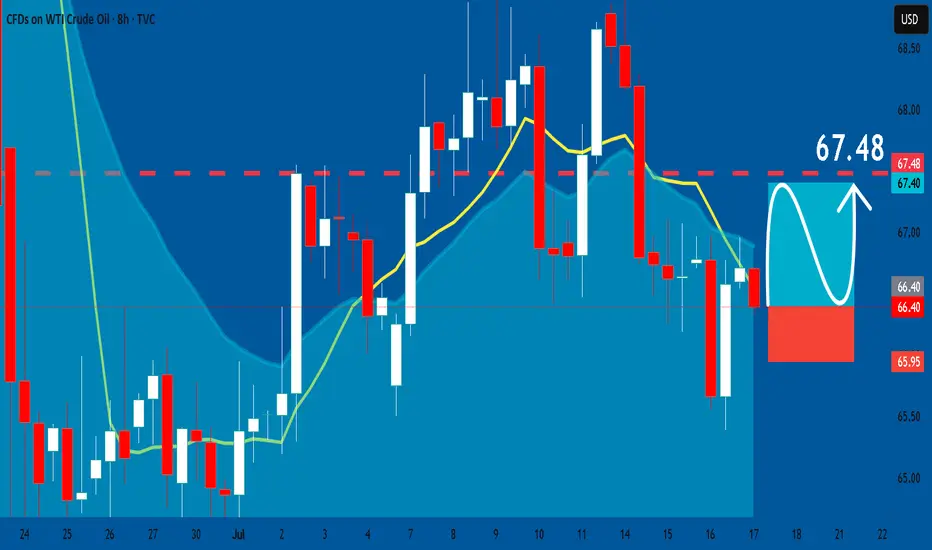
USOIL: Bullish Continuation & Long Trade
USOIL
- Classic bullish pattern
- Our team expects retracement
SUGGESTED TRADE:
Swing Trade
Buy USOIL
Entry - 66.40
Stop - 65.95
Take - 67.48
Our Risk - 1%
Start protection of your profits from lower levels
Disclosure: I am part of Trade Nation's Influencer program and receive a monthly fee for using their TradingView charts in my analysis.
❤️ Please, support our work with like & comment! ❤️
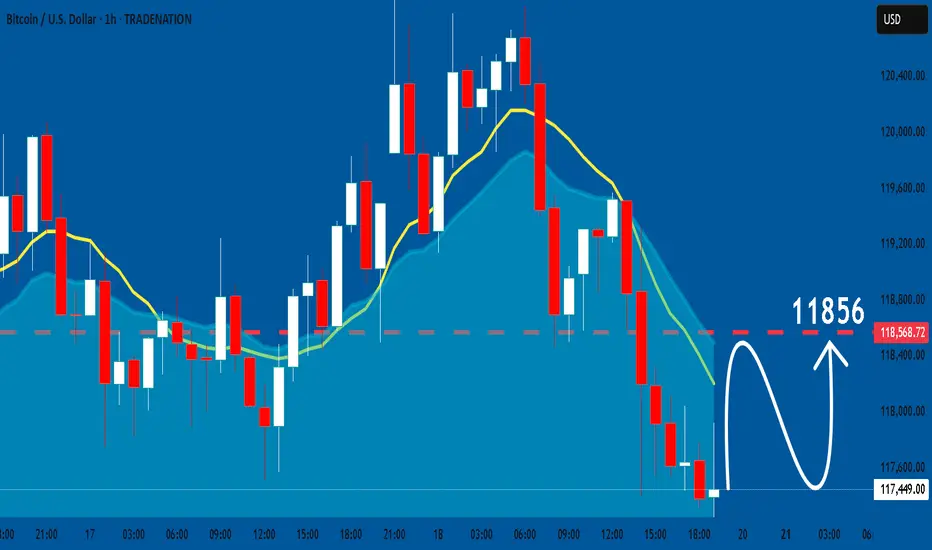
BTCUSD: Bullish Continuation
Looking at the chart of BTCUSD right now we are seeing some interesting price action on the lower timeframes. Thus a local move up seems to be quite likely.
Disclosure: I am part of Trade Nation's Influencer program and receive a monthly fee for using their TradingView charts in my analysis.
❤️ Please, support our work with like & comment! ❤️
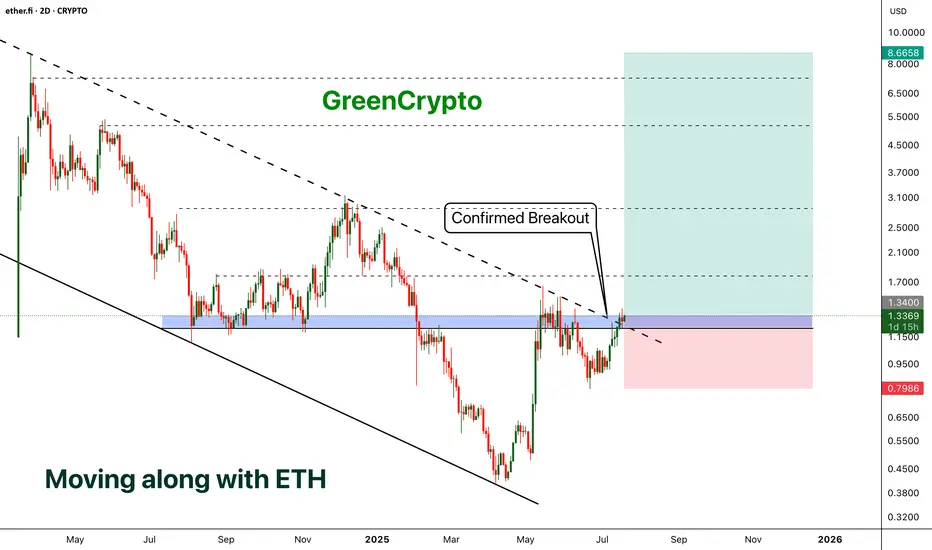
ETHFI - Moving along with the ETH- ETHFI has finally broken out from the descending channel pattern and now price is above the trending resistance line.
- We can expect a minor reversal (chances are less ) and parabolic move from here.
- I'm expecting at-least 500+% profit from this opportunity
Entry Price: 1.3384
Stop Loss: 0.7965
TP1: 1.7657
TP2: 2.5436
TP3: 4.5055
TP4: 5.6136
TP5: 8.5626
Max Leverage 5x.
Don't forget to keep stoploss.
Support us by Liking and following.
Thanks and Cheers!
GreenCrypto
APT - A lower timeframe view - Breakout Entry- On 1D candle, APT is still trading inside the channel
- currently price is trading near the resistance and got rejected from the resistance as expected.
- I'm expecting few more candles near the resistance zone before breakout.
If we look at the higher timeframe (1W) view we shared earlier, there is huge potential for uptrend as we are expecting past pattern to repeat
if you are looking for a short term trade without focusing on weekly chart, this is a good opportunity
Entry Price: 5.313
Stop Loss: 3.462
TP1: 6.141
TP2: 7.270
TP3: 8.634
TP4: 10.583
TP5: 14.768
Don't forget to keep stoploss
Cheers
GreenCrypto

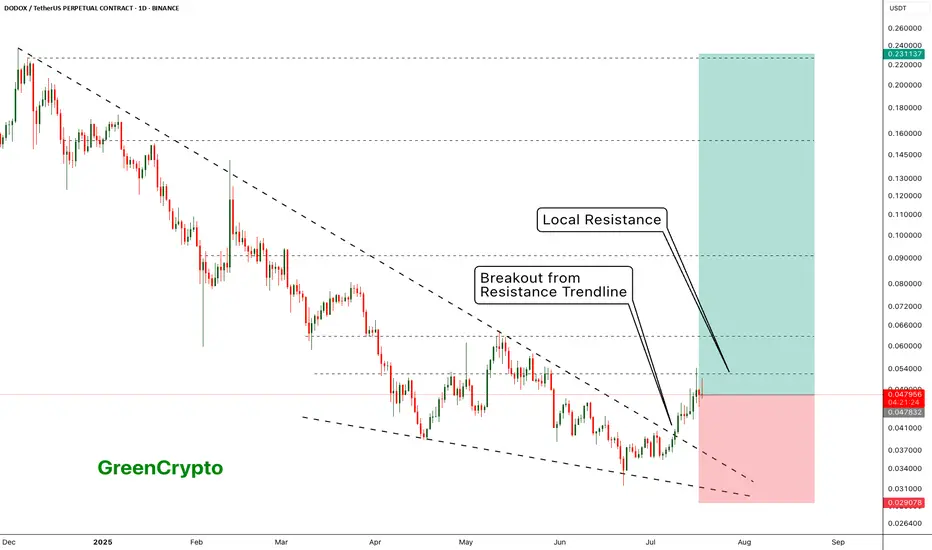
DODOX - Resistance is holding it back - Huge Potential- DODOX has successfully broken out from the resistance trendline
- Now its being pushed back back the weak local resistances
- I see a huge upward potential here.
Entry Price: 0.048271 ( Or you can wait for it breakout from the local resistance of 0.063051)
Stop Loss: 0.029078
TP1: 0.062621
TP2: 0.079766
TP3: 0.103243
TP4: 0.151853
TP5: 0.222332
Max Leverage 5x.
Don't forget to keep stoploss
Cheers!
GreenCrypto
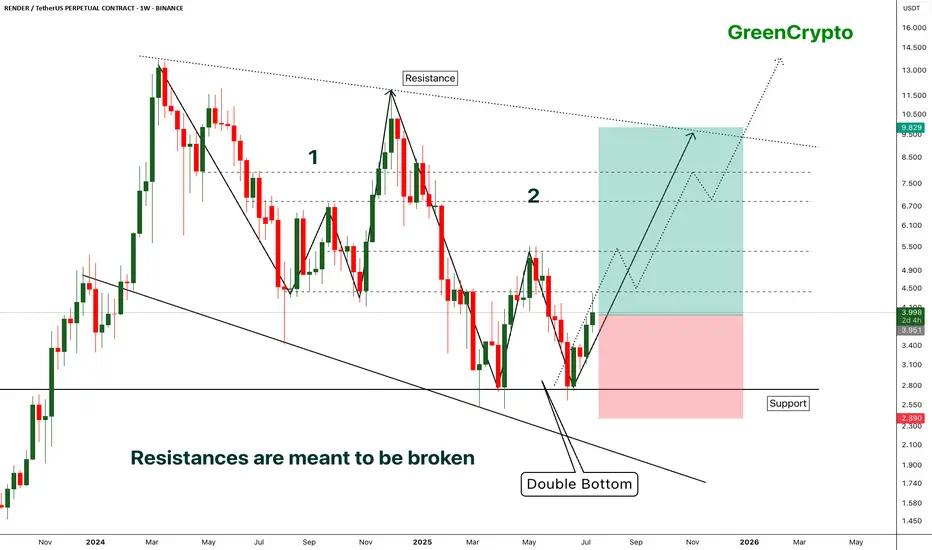
RENDER - [Double bottom] - Resistances are meant to be broken- RENDER has successfully bounced back from the support by forming the double bottom pattern.
- Double bottom pattern is bullish pattern, when it forms at the strong support it becomes extremely bullish. this is one of such scenario.
- Im expecting some minor resistance at the local resistance around 4.3
- A successfull breakout this local resistance will push the price further high.
Entry Price: 3.941
Stop Loss: 2.378
TP1: 4.413
TP2: 5.350
TP3: 6.887
TP4: 8.092
TP5: 9.810
Max Leverage 5x.
Don't forget to keep stoploss.
Support us by Liking and following.
Thanks and Cheers!
GreenCrypto
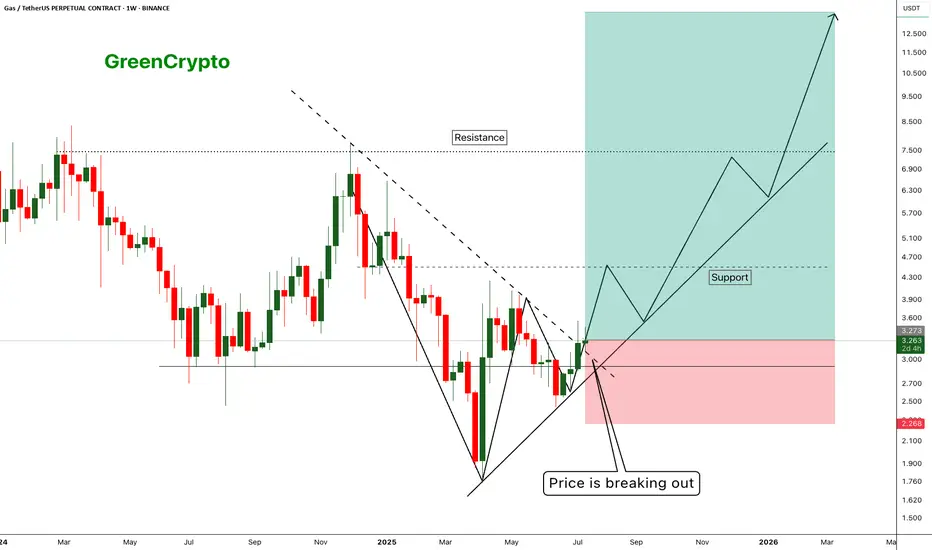
GAS - Huge Risk:Reward Trade 1:10 - Is there any Gas Left ?- Gas has finally managed to breakout from the resistance trendline and now trading just above the resistance
- I'm expecting this trend to continue along the support line shown in the chart.
Entry Price: 3.281
Stop Loss: 2.271
TP1: 3.944
TP2: 4.589
TP3: 6.775
TP4: 8.412
TP5: 13.512
Max Leverage 5x.
Don't forget to keep stoploss.
Support us by Liking and following.
Thanks and Cheers!
GreenCrypto
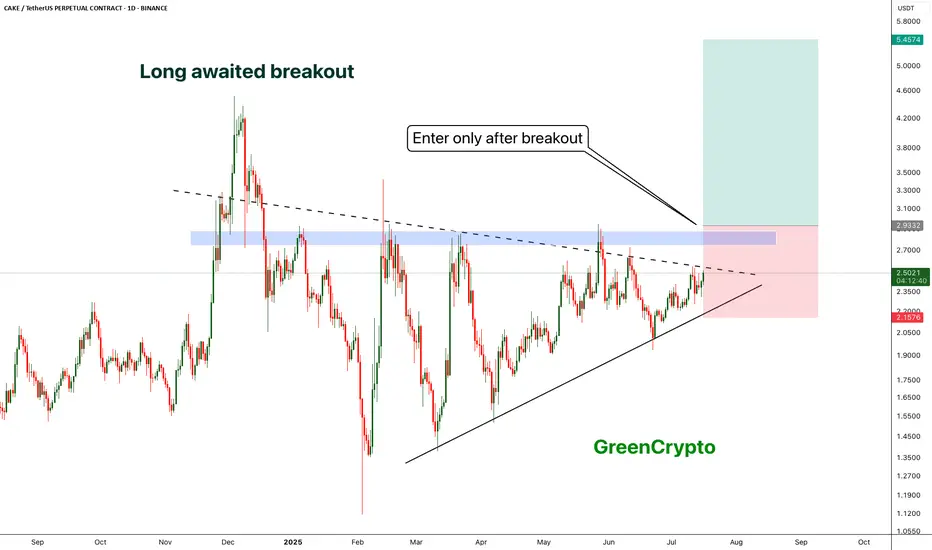
5$ is realistic target for CAKE- CAKE is trading inside the triangle since 2025
- now it seems like there is a possibility of breakout
- A clear breakout with decent volume would push the price towards 5$
- we will enter after the breakout
Entry Price: 2.9
Stop Loss: 2.15
TP1: 3.4371
TP2: 4.2671
TP3: 5.0083
Max Leverage 5x
Don't forget to keep stop loss
cheers
GreenCrypto
BITCOIN - Price can bounce up from support line to $125000Hi guys, this is my overview for BTCUSD, feel free to check it and write your feedback in comments👊
For a long time, the price was trading sideways inside a wide flat range between the $99000 support area and the $112000 resistance level.
After accumulating volume, bitcoin made a strong upward impulse and performed a breakout, pushing above the top of the flat.
Following this movement, the price action began to form a rising wedge pattern, moving between its clear support and resistance lines.
Recently, price tested the resistance line of the wedge and then started a predictable correction back down towards support.
Now, BTC is approaching the support line of the wedge, which aligns with the important horizontal support area around $112000-$113500.
I expect that the price can test this support line and then bounce up to the $125000 resistance line of the wedge.
If this post is useful to you, you can support me with like/boost and advice in comments❤️
Disclaimer: As part of ThinkMarkets’ Influencer Program, I am sponsored to share and publish their charts in my analysis.

HelenP I. Gold will little correct and then rise to top of wedgeHi folks today I'm prepared for you Gold analytics. If we look at the chart, we can see a clear ascending wedge pattern that has been guiding the price action. The structure is well-defined by a lower trend line providing consistent support and an upper resistance line. I believe that the key area to watch right now is the support zone between 3310 and 3295 points. The logic is that after the recent push, the price may undergo a small, healthy correction to test this zone's strength. The condition for our bullish scenario to unfold is a successful hold of this support; a bounce or signs of buyer interest in this area would be the confirmation we are looking for. Once this condition is met, I believe that gold will have enough momentum to continue its upward movement within the confines of the wedge. Therefore, the main goal for this scenario is set at 3415 points. This target is not arbitrary; it directly coincides with the resistance line of the wedge, which represents a logical point for the current upward swing to conclude. If you like my analytics you may support me with your like/comment.❤️
Disclaimer: As part of ThinkMarkets’ Influencer Program, I am sponsored to share and publish their charts in my analysis.

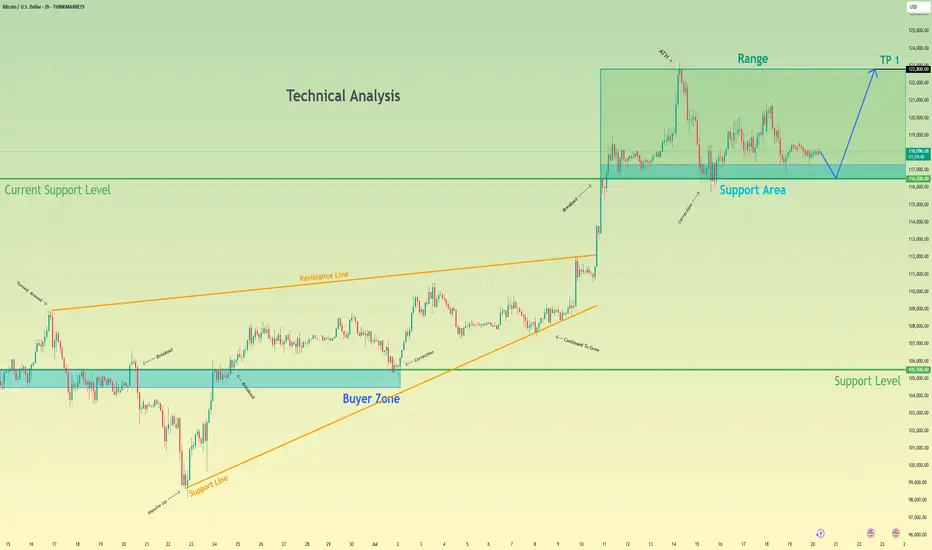
Bitcoin may bounce up from support area to 122800 pointsHello traders, I want share with you my opinion about Bitcoin. Analyzing the broader market context on the BTC chart, the past price action has carved out two significant technical structures: a wide trading range and a larger upward wedge pattern. The formation of this wedge indicates a generally positive market sentiment, though the narrowing price swings suggest a decrease in upward momentum. The foundation of the current structure was established around the buyer zone of 105500 - 104500, a level that has historically proven to be a robust floor. This historical behavior provides a critical reference for our hypothesis. Currently, we are observing bitcoin's price action closely, interacting with the current support area, located between 116500 and 117300. The character of the movement here is largely corrective and consolidative, pointing to a state of temporary equilibrium. This consolidation near the lower boundary of the wedge is a pivotal point. My thinking is that a final, brief dip to thoroughly test the 116500 - 117300 support area is a high-probability scenario. Such a move would effectively absorb remaining sell-side liquidity before a reversal. We can then anticipate an impulsive move upwards across the range. Therefore, the logical take-profit for this long position is set at 122800 points, as this level marks the upper resistance of the range and a natural target. Please share this idea with your friends and click Boost 🚀
Disclaimer: As part of ThinkMarkets’ Influencer Program, I am sponsored to share and publish their charts in my analysis.
EURCHF Is Going Up! Buy!
Here is our detailed technical review for EURCHF.
Time Frame: 9h
Current Trend: Bullish
Sentiment: Oversold (based on 7-period RSI)
Forecast: Bullish
The market is testing a major horizontal structure 0.931.
Taking into consideration the structure & trend analysis, I believe that the market will reach 0.936 level soon.
P.S
Overbought describes a period of time where there has been a significant and consistent upward move in price over a period of time without much pullback.
Disclosure: I am part of Trade Nation's Influencer program and receive a monthly fee for using their TradingView charts in my analysis.
Like and subscribe and comment my ideas if you enjoy them!

buy bch midterm"🌟 Welcome to Golden Candle! 🌟
We're a team of 📈 passionate traders 📉 who love sharing our 🔍 technical analysis insights 🔎 with the TradingView community. 🌎
Our goal is to provide 💡 valuable perspectives 💡 on market trends and patterns, but 🚫 please note that our analyses are not intended as buy or sell recommendations. 🚫
Instead, they reflect our own 💭 personal attitudes and thoughts. 💭
Follow along and 📚 learn 📚 from our analyses! 📊💡"

$PENGU Pudgy PenguinsWithout a breakout to the DOWNside, CSECY:PENGU is still looking bullish for at least a hit to .04.

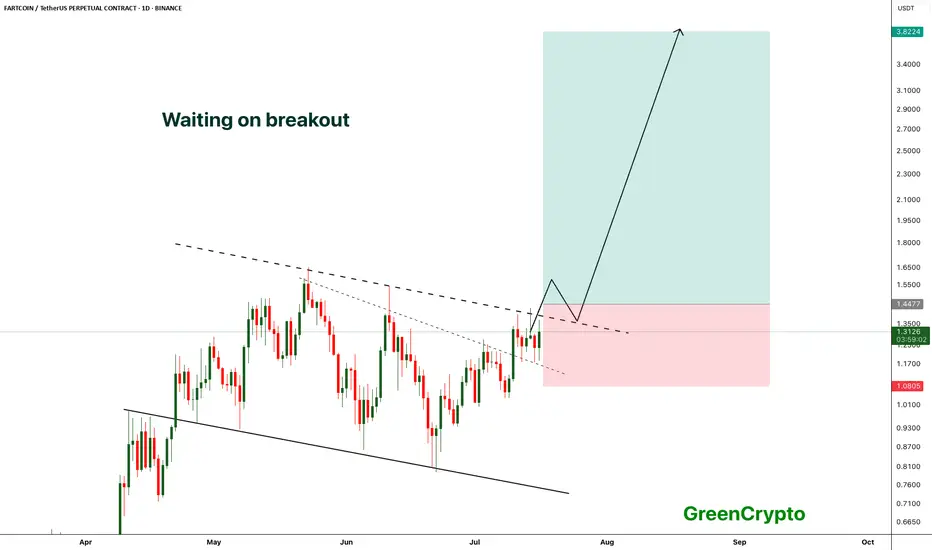
FARTCOIN - Breakout from the channel- FARTCOIN is waiting to breakout from the channel, a confirmed breakout would push the price to new all time high
- we have long trade opportunity once the price breaks above the resistance trendline
Entry Price: above 1.44
Stop Loss: Below 1.08
TP1: 1.6464
TP2: 1.8923
TP3: 2.2450
TP4: 2.9973
TP5: 3.8224
Max Leverage: 5x
Don't forget to keep stoploss
Cheers
GreenCrypto
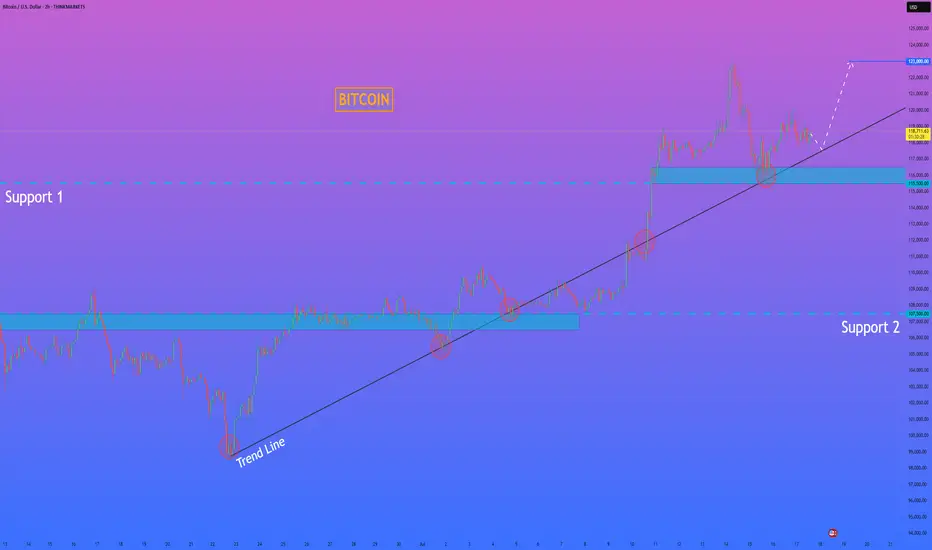
HelenP. I Bitcoin will correct to trend line and then start riseHi folks today I'm prepared for you Bitcoin analytics. The price has been trading in a strong bullish structure, clearly respecting the ascending trend line since the rebound from the 107500 level. Each time the price touched the trend line, it formed a higher low and continued the upward movement. After breaking through the important Support 1 zone (115500–116500), BTC made a strong impulse upward and reached a local high above 122000 points. Currently, the price is making a pullback and moving closer to the trend line again. This area has previously acted as a major point of interest for buyers, and now it's expected to play a key role once more. The support zone and trend line are converging, which makes this level critical for the next move. I believe BTCUSD will bounce from this area and continue its bullish momentum. My goal is set at 123000 points. Given the market structure, higher lows, and strong reaction from the support zones, I remain bullish and expect further growth from current levels. If you like my analytics you may support me with your like/comment ❤️
Disclaimer: As part of ThinkMarkets’ Influencer Program, I am sponsored to share and publish their charts in my analysis.
GOLD - Price may bounce up to $3375 level from support lineHi guys, this is my overview for XAUUSD, feel free to check it and write your feedback in comments👊
Initially, the price action was confined within a descending channel before a decisive bullish breakout occurred.
This first breakout triggered a strong upward impulse, setting the stage for the current market structure.
The price is now consolidating in a wide flat range, bounded by support near the $3285 level and resistance at $3375.
An ascending support line is providing dynamic support within this consolidation pattern, indicating underlying buying pressure.
I expect a brief retest of this support line, which should act as a launchpad for the price to move higher.
The primary target for this long setup is the $3375 resistance level, marking the top of the current flat range.
If this post is useful to you, you can support me with like/boost and advice in comments❤️
Disclaimer: As part of ThinkMarkets’ Influencer Program, I am sponsored to share and publish their charts in my analysis.
