Grasim positional long opportunityPharma sector is looking strong for coming days. So here I see a good buying opportunity in GRASIM.
Longopportunity

NASDAQ - In this area you can establish a long position!My last update:
"The Nasdaq is strong! The price continues to increase and we could see this movement continue up to 14225 points. Here I actually see the end of the wave and a correction up to the target should give us the opportunity to establish a position again. However, with that much power, we can also see a direct breakout. To do this, the price should stabilize above 14225 points. In this case, I also have to do a more aggressive count and adjust the targets upwards. In the overall view I see the Nasdaq around 15269.
I expect the current upward move around 14225 points to switch into a correction. However, if the Nasdaq holds levels above 14,225 points, another breakout must be expected.
Now the Nasdaq reacts clearly to the resistance at 14147 points, where the wave still have reached a good target. Should the market succeed in falling below the 13979 points sustainably, we can slowly focus on the target area around 13700 to 13500 points. Accordingly, the expectation of a direct breakout over 14225 points has been reduced to 40%. The intermediate correction would be very welcome, so that we can build up further long positions.
Conclusion: a small intermediate recovery is more likely and can start today with a fall below 13979 points."
Nasdaq daily market update:
In the Nasdaq I see the price primarily approaching my target area. This is between 13696 - 13554 points and offers a good opportunity for long positions. From there, the Nasdaq can gain new momentum for a bullish impulse over 14220 points in the direction of 14440 points. But in der overall view I expect even higher prices. Actually I see the index grow to over 15260 points. In this case it is important to stay above 12954 points.
H1:
H4:
For my followers to understand my analysis:
The topic is only described very roughly and is intended to give you a first overview of one of my analysis methods.
1. An impulse always moves in five sub-waves.
Waves 1, 3 and 5 of these are motive waves that move in the same direction as the overall trend.
Waves 2 and 4 are corrective waves, i.e. they correct the previous movement.
The following rules apply to an impulse:
-Wave 4 must not overlap with wave 1, except in a diagonal.
-Wave 3 is never the shortest wave.
-Wave 2 must not fall below the starting point of wave 1.
If one of these rules is broken, the chart analysis must be revised.
2. A correction wave moves in the opposite direction to the overall trend.
Corrective waves are three-part and basically consist of waves A, B and C.
Waves A and C are primarily impulse patterns of the corrective movement and drive the market in the opposite direction to the overall trend.
Wave B corrects the previous wave A and even has the potential to surpass the starting point of wave A.
3. The standard pattern consists of an impulse wave and a corrective wave.
These standard patterns repeat on a short-term basis as well as on a multi-year basis. In other words, every single wave consists of several sub-waves and in turn belongs to the larger picture. For example, wave 1 (an impulse) itself consists of five sub-waves.
This standard pattern continues and accordingly always merges into a higher level.
4. Relation Between Fibonacci and Elliott Wave Theory
Fibonacci Ratio is useful to measure the target of a wave’s move within an Elliott Wave structure. Different waves in an Elliott Wave structure relates to one another with Fibonacci Ratio. For example, in impulse wave:
Wave 2 is typically 38,2 %, 50% or 61.8% of wave 1
• Wave 3 is typically 161.8% of wave 1
• Wave 4 is typically 23.6%, or 38.2% of wave 3
• Wave 5 is typically inverse 1.236 – 1.618% of wave 4, equal to wave 1 or 61.8% of wave 1+3
You can use the information above to determine the point of entry and profit target when entering into a trade.

VETBTC great long oportunity! Hi guys!
VET is looking really good as it broke the previous down trend line, looks like it's aheading a new ATH!


AT&T - PRICE Prediction ENTRY LevelsAT&T's price is close to the major support. If we break it, we are going lower. I recommend BUY close to $28.44 with SL or wait for a lower price.
ENTRY LEVELS LONG:
$28.44 - be CAREFUL - we can go lower
$27.70
$26.50 - STRONG BUY

NIO long opportunity!NIO received a PT upgrade of 80.3 this morning by Nomura. It has a nice descending triangle on the 4h/Daily chart and it looks like today might be the day to breakout. NIO like Tsla has been cooling off for the last week or two. With EV market being what it is I think NIO can make a move back to 61 lvl in the next two weeks. I will be watching todays price action to swing $60 calls for 2/5 expiration.
- 4h chart is sitting nicely right overtop of 20 & 50 SMA
- we have resistance at the 59.05-59.17 lvls with 30m/1h/2h SMA's if we can clear those then I think we can begin a NIO rally
- We also have a nice LVN at the 59 lvl where the SMA's are, breaking through 59-59.20 lvl will serve as a catalyst through and on to 61-65 range
Will be looking to enter this trade with stop loss at 56.50. Depending on price action I would like to scale into the trade and with confirmation over the previously mentioned SMA's I would add more contracts.
*TSLA is reporting earnings january 27th, this NIO play can also benefit from some solid EV news. never know though because it's TSLA....
*Levels provided by EliteOptions

Tesco PLC. UK Groceries & General Retailer. 02 October 202002 October 2020
Tesco PLC. Price Could be Approaching
Potential Weekly Area of Demand.
One to Watch, For Long Bias.
Tesco PLC, is a British
Multinational groceries
and general merchandise retailer.
LSE:TSCO


USDCHF buy opportunity USDCHF reached 50% fib level and confluence with support area, buy opportunity

Gold Market says it's gonna keep going up, along with a bubble that will cause even worse Depression since the early 20th century and the destruction of the USD.
I say "yeah pretty much but first look at this".


BUY OPPORTUNITY - USDCADSupport level now reached, suggesting a bullish push into the 1.41000 level.

EURUSD - LONG 4HHoping for EURUSD to spike through the resistance level and reach 1.11500 as a long target. However, this also may retrace to 1.07000 if a reversal pattern occurs after this big bullish move.

Possibly a long set up in the making.I am expecting the stock price to up go a little bit and then a pullback. After, the real move might take place. Trade with caution!

IT'S NOW OR NEVERHey everyone,
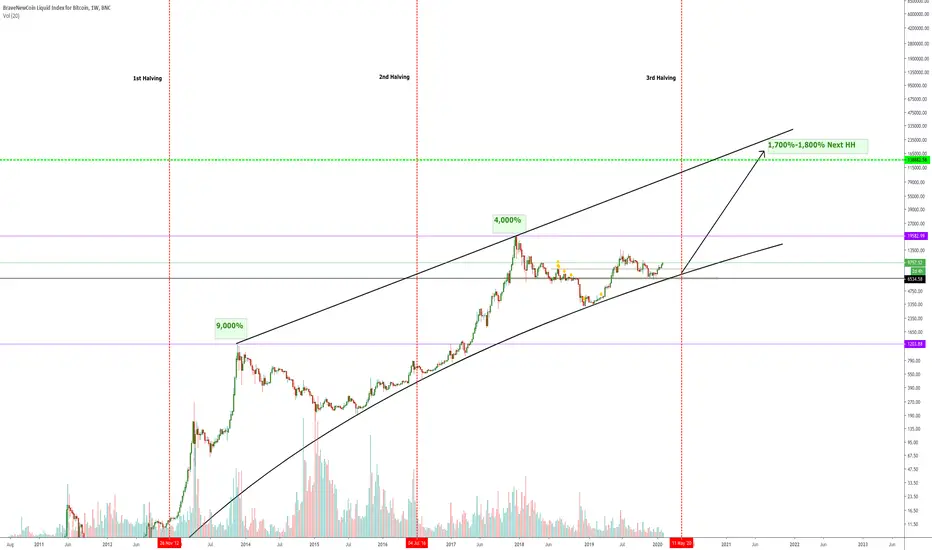
I just want to clarify that i'm not here to discuss the fundamental future of Bitcoin (like the regulated implementation of it in the real world), but instead, show you a very simple long term understanding of where the price might take us, especially after the 3rd consecutive block reward halving that will occur in May. You may have seen a similar type of analysis before, but I assure you, ignoring it will only leave you with regret in the following years to come!
First of, let's understand how the previous "halvings" affected the price of Bitcoin:
1st Halving - BTC goes up around 9,000% to create the new higher high.
2nd Halving - BTC goes up around 4,000% to create the new higher high.
9000/4000 gave us a 2.25 interval. Technically speaking, history within the markets tends to repeat itself. So, our estimation for next price increase (3rd halving), would have to be 4000/2.25 which would give 1,777! This is the number we should consider to determine the next bull run percentage increase from the day halving occurs.
In other words, a bull run is highly anticipated. Mining Bitcoin will become more difficult and there will be less Bitcoin available in supply, which ultimately makes it more scarce. Due to this fact, the demand will be much higher to acquire Bitcoin. The biggest changes in the crypto ecosystem this time, will be the higher public awareness around bitcoin and the interest of institutional investors (hedge funds, banks, pensions, etc.) taking part within the market. Increased public awareness could also lead to a wave of FOMO (fear of missing out) buying power, which could push the Bitcoins price higher and faster. When more financial institutions begin taking big positions, it could affect bitcoin in ways investors have never seen before.
Moving more into the technical side of the analysis, just pay attention to the curve line we see Bitcoin using as a respected support level. It has been respecting it from the very beginning of it's creation, and recently we bounced off the 6,500 price, which acted as the major and probably even the final level of support to acquire Bitcoin at. Looking at the chart today, we see that the curve line surpassed that level and is no longer expecting it to retest it, showing more buying pressure before halving!
We also have quite an important trend line to look out for, which formed itself within the lower high and the current higher high on the 1W time frame. It gives us a better clue as to where the next profit taking levels for Bitcoin would be.
So with all that being said, just note that at the moment we are exactly at the stages where you would be wanting to buy Bitcoin and hold it for a very long period of time, otherwise later would be too late. However, we are actually expecting a pullback to commence in the following weeks, which could ultimately send the price of Bitcoin to the 1st buying target at around 8,500, or the next target at 7,500, which will act as the key level of support to enter longs.
Hopefully this was useful guys. Please trade at your own risk and make sure to invest only as much as you're willing to lose!
Thanks.
XME (Metals & Miners) are BullishXME is the metal and miners ETF. See reference info here .
It is Not Yet bullish, nor rallying, But appears to need to close above 27.50 for the week for it to properly attempt a technical bullish rally...

NZD/JPY Wait for a good entry NZD/JPY is approaching a somewhat strong support level and an uptrend line.


EURUSD LONG TRADEEURUSD has re-tested the key support level and is potentially forming a double bottom pattern
on the 4hr timeframe. We could look to enter above the candle high with stops below the key level.
Targets would be the current swing highs.

YOYO/BTC Breaking Out?YOYO/BTC 4hr chart is showing a breakout here. Momentum is gaining as well.
There is low volume and you should wait to see it close above Kijun Sen before entering to make sure it does not act as resistance on the 4hr.
The Daily Kijun - red line - seems to be acting as a strong support as the 4hr has tapped it at least 5 times.
If this next 4hr closes and confirms a break above the kijun I would be looking for:
1. 175
2. 182
3. 189
These would be my targets and stop loss below the daily kijun at 156.
Learn with me and follow on Twitter: @coachkcrypto
Happy Trading,
Coach K
PS: Reminder wait for the 4hr to close above Kijun to enter this trade.

AUDNZD BUY OPPORTUNITYThe Aussie is showing us interest in a Long Move with it breaking above and retesting a highly respected price level.
