Continued recovery, positive after NFP news✍️ NOVA hello everyone, Let's comment on gold price next week from 08/04/2025 - 08/8/2025
⭐️GOLDEN INFORMATION:
Gold prices surged over 1.5% on Friday, climbing toward $3,350, as a weaker-than-expected U.S. Nonfarm Payrolls (NFP) report signaled a faster-than-anticipated slowdown in the labor market. Heightened geopolitical tensions between the U.S. and Russia further boosted safe-haven demand for the precious metal.
Following the disappointing July jobs data, markets began pricing in a potential interest rate cut by the Federal Reserve. While the Unemployment Rate held relatively steady, signs of labor market softness supported recent comments from Fed officials Michelle Bowman and Christopher Waller, who advocated for a 25-basis-point rate cut at the July 29–30 meeting.
Additional data added to the cautious sentiment: the ISM’s July report confirmed that U.S. manufacturing activity remains in contraction territory, while consumer confidence took a hit, according to the University of Michigan’s latest survey.
⭐️Personal comments NOVA:
Gold prices continue to be positively affected after last week's NFP news, market expectations of an early rate cut are rising
🔥 Technically:
Based on the resistance and support areas of the gold price according to the H4 frame, NOVA identifies the important key areas as follows:
Resistance: $3384, $3434
Support: $3331, $3307, $3268
🔥 NOTE:
Note: Nova wishes traders to manage their capital well
- take the number of lots that match your capital
- Takeprofit equal to 4-6% of capital account
- Stoplose equal to 2-3% of capital account
- The winner is the one who sticks with the market the longest
Longs

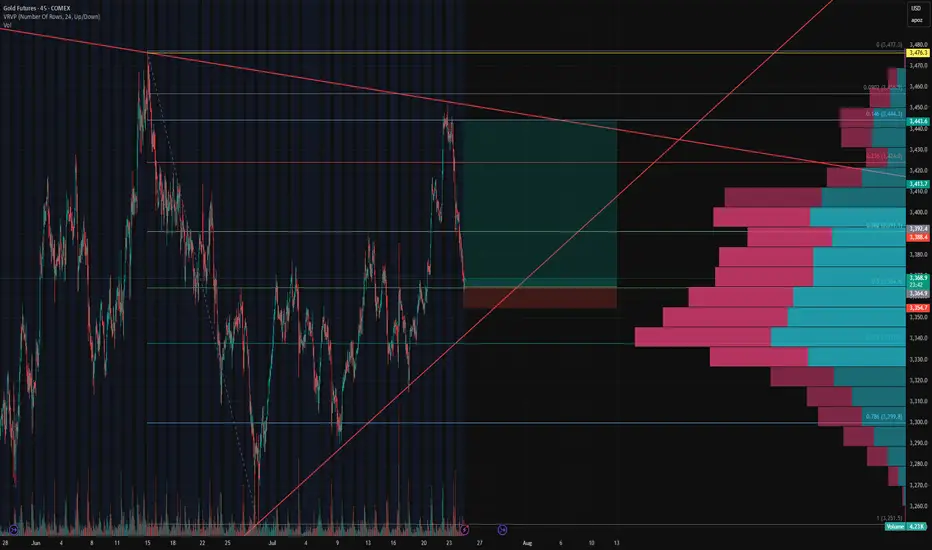
Gold Futures (GC1!) Long Setup – 0.5 Fib Bounce🟡 Gold Futures (GC1!) Long Setup – 0.5 Fib Bounce
After nailing the long from the bottom and perfectly shorting the top, we’re stepping back in for another calculated move.
📉 Price pulled back to the 0.5 Fibonacci retracement, aligning perfectly with the upward trendline support and a key HVN on the Volume Profile.
📈 Entered long at 3,365 with a tight stop below 3,354 (0.3% risk), targeting the descending trendline near 3,444 for a clean 7.7R setup.
🧠 Context:
Price reacted hard at resistance, but volume support and structure still lean bullish.
Clear invalidation if we break trend and lose 3,350 support cluster.
Let’s see if this bounce gets legs. 🚀
KALV FDA approval rallyKALV received FDA approval this week for a new drug, has $220mln in cash, and just bounced off the daily 21EMA (overlayed on this 4H chart).
Recently rejected off the monthly 100ema two times (overlayed on this 4H chart). Breakout beyond the monthly 100ema and first target is $20. Numerous price target increases, most notably, one at $27 and another increased from $32 to $40.

recovery, towards 3400, gold price⭐️GOLDEN INFORMATION:
Gold prices (XAU/USD) extended their gains to around $3,365 during the early Asian session on Monday, as investors flocked to safe-haven assets in response to an escalation in global trade tensions.
The move comes after US President Donald Trump intensified the trade war over the weekend, announcing a 30% tariff on imports from the European Union and Mexico, effective August 1. This followed last week’s declarations of a 35% duty on Canadian goods and a sweeping 15%–20% tariff proposal on most trading partners, in addition to a 50% tariff on copper imports. Mounting concerns over the economic fallout from these aggressive trade measures have fueled demand for gold, a traditional refuge during times of uncertainty.
⭐️Personal comments NOVA:
Continued price increase, tariff pressure helps gold to be positive again
⭐️SET UP GOLD PRICE:
🔥SELL GOLD zone: 3384- 3386 SL 3391
TP1: $3376
TP2: $3364
TP3: $3352
🔥BUY GOLD zone: $3308-$3310 SL $3303
TP1: $3319
TP2: $3328
TP3: $3340
⭐️Technical analysis:
Based on technical indicators EMA 34, EMA89 and support resistance areas to set up a reasonable BUY order.
⭐️NOTE:
Note: Nova wishes traders to manage their capital well
- take the number of lots that match your capital
- Takeprofit equal to 4-6% of capital account
- Stoplose equal to 2-3% of capital account

GBP/JPY Low Risk BUYS - SWINGLOW RISK TRADE
If you prefer not to swing you can scalp buys on the pullbacks throughout the week ahead.
GBP/JPY - BULLISH ENGULFING CONFIRMED
A+ SETUP since it has touched
and respected our area of interest.
SL - 185.599
TP1 - 190
TP2 - 192.799
TP3 - 194.681


Ethereum monthly cup and handleSoooo, this is my first post, and I'm not really too sure if I'm seeing this correctly, can somebody please explain to me why I'm wrong or if I'm right. Cuzzzzz this seems extremely bullish to me.
This is on the monthly timeframe, so this projection is for closer to November - February, IMO...
AM I SEEING THIS CORRECTLY, or is this my bullish personality shining through.

PREVIEW LONDON SESSION - Tue 24th June 2025 --- LONGWe had one demand filled day.
And I don't see it stopping. We have blown through 100 and 125 projections and I predict 150 will be reached soon. SO, after london open I will be looking for LONG discounts on the 5m/15m charts and targeting 6162.50 (poc strike) that coincides with 150 (PINS OFF) projection.

Trade Idea: Long XAUUSD (BUY STOP)1️⃣ Multi-Timeframe Structure
• 1 Hour (Macro):
• Trend: Bullish. 20 SMA is riding above the 50 SMA .
• Price has broken above the prior resistance at 3374.50 and is now retesting it as support.
• 15 Minute (Tactical):
• After a clear push down into 3340.37, price rallied back above 3374.50.
• SMAs have flipped back bullish, and volume during the retest shows absorption of selling pressure.
• 3 Minute (Entry Precision):
• Micro-green candle wicks show a small scratch of buyers stepping in just above 3374.50.
• Momentum is picking up to the upside, but we want confirmation of strength before committing.
⸻
2️⃣ Trade Execution
▶️ Entry: Buy Stop at 3379.50
• Wait for a clean 3 m/15 m push above the short-term swing high (~3379) to confirm buyers are in control.
✂️ Stop Loss: 3374.50
• Just below the broken resistance-turned-support level.
• True structural invalidation of this bullish thesis.
🎯 Take Profit: 3394.50
• Targets the next logical resistance cluster (round number area and prior swing highs) for ~15 pt gain.
Risk-Reward ≈ 1:3 (SL = 5 pts, TP = 15 pts)
⸻
3️⃣ Invalidation & Expiry
❌ Cancel the pending Buy Stop at 3379.50 if either:
1. A full 15 m candle closes below 3374.50 before entry.
2. It’s not triggered by 8:30 AM PST.

NAS/NQ 4H Buy IdeaLooking for price to break and retest the current high to continue higher
OR
Looking for price to go back and fill the imbalance left below current price to then continue higher

Trade Idea: XAUUSD Long (BUY STOP)Direction: Long
Order Type: Buy Stop
Entry: 3366.50 (above recent local resistance and reclaiming structure)
Stop Loss: 3352.00 (below M15/M3 structure and recent low)
Take Profit: 3402.00 (previous swing high zone and just under H4 resistance)
Risk-Reward Ratio: ~2.57R
⸻
🧠 Trade Rationale
H4
• Price bounced from a higher low around 3320–3330, still respecting the long-term uptrend.
• Price is now reclaiming the 20/50 SMA cluster, which could act as dynamic support.
• Momentum is neutral-to-positive with MACD poised for a bullish crossover.
M15
• Price reclaimed 20 SMA and is now curling back above the 50 SMA.
• Clean bullish engulfing structure forming, indicating buyer re-entry.
• RSI is mid-50s with room to expand upward.
M3
• Strong, steady micro uptrend forming higher lows and consolidating under resistance near 3366.
• Increasing volume on upward moves, suggesting healthy interest from buyers.
⸻
🛡️ Risk Management & Execution
• Entry confirmation: Only enter if price breaks above 3366.50 on strength — avoid premature triggers.
• Invalidation Window: Trade becomes invalid if price closes below 3350 on a 15-minute candle. This would break both M3 and M15 structure.
• SL to BE: Move SL to break-even after price reaches 3377 and forms a micro higher low on M3 or support-resistance flip.
FUSIONMARKETS:XAUUSD

Trade Idea:XAUUSD Short ( SELL LIMIT )📉 Multi-Timeframe Breakdown
🔹 H4 Chart (Macro Bias)
• Trend Context: Price is still broadly in an uptrend on the H4, but it’s testing the 50 SMA from above.
• MACD: Bearish crossover below the signal line suggests waning bullish momentum.
• Volume: Slight uptick in bearish volume as price pulls back from the recent highs.
• Bias: Neutral to Bearish Short-Term (H4 trend remains up, but weakening).
🔹 M15 Chart (Setup Zone)
• Structure: A sharp selloff broke both the 20 SMA and 50 SMA.
• Momentum: RSI ~16, oversold—but that can persist in strong trends.
• Volume: Large spike on the breakdown candle = strong bearish interest.
• ATR: 7.97 = elevated volatility.
• Bias: Bearish momentum, potential pullback retest opportunity.
🔹 M3 Chart (Execution Focus)
• Price Action: Freefall with clean rejections at the 20 SMA.
• Volume Spike: Bears in control, RSI also confirms momentum exhaustion but no reversal confirmation yet.
• Bias: Bearish with potential for bounce/pullback retest entry.
⸻
✅ Primary Trade Setup
Type: 🟥 Sell Limit
Rationale: Let price retrace into resistance before fading it, using structure for confirmation.
Entry Zone: 3270–3276 area (prior support becomes resistance near 20 SMA on M15 and 50 SMA on M3).
Stop Loss: Above structure high → 3283
Take Profit: Next key support zone ~3245–3250 (measured move + demand zone on M15/M3).
📌 Sell Limit Order
• Sell Limit @ 3273
• SL @ 3283
• TP @ 3248
FUSIONMARKETS:XAUUSD

Trade Idea: XAUUSD Long ( BUY LIMIT )✅ Bias: Long (Buy)
Rationale:
• 4H Chart shows price reclaiming the 20/50 SMA zone after the recent pullback — a bullish reset after a shallow correction.
• 15M Chart confirms trend resumption — clean higher highs and higher lows, with strong price support above the 20/50 SMA crossover.
• 3M Chart shows a breakout with higher volume and sustained move above recent consolidation. White 20 SMA is holding price well.
⸻
🎯 Trade Setup: Buy XAUUSD
• Entry: 3345.00 (wait for a small pullback or price base just above current level for better RR)
• Stop-Loss: 3332.00 (below last intraday swing low and the SMA base)
• Take-Profit: 3371.00 (near previous resistance zone)
Risk-Reward Ratio: ≈ 2:1
⸻
📍 Move SL to Breakeven When:
Price reaches 3358.00 (midway point = 1:1 RR) and:
• 3M chart shows no strong bearish engulfing or reversal candle.
• Volume on the move is rising or stable (not collapsing).
This protects capital without choking the trade.
⸻
🧠 Confluence Summary:
• Trend Alignment across all timeframes.
• 20/50 SMA bullish stack on 15M and 4H.
• Volume Expansion on breakout leg.
• RSI (15M) near 67 — strong but not overbought yet (room to run).
⸻
⚠️ Fundamental Notes:
• Gold has been rising with Fed pivot expectations and equity uncertainty — momentum is on the bulls’ side unless sharp risk-on news appears.
• Caution near major US data releases tomorrow or speeches from Fed members.
FUSIONMARKETS:XAUUSD

Trade Idea : XAUUSD LONG (BUY LIMIT)✅ Trade Bias: Long (Buy)
⸻
🔍 Technical Analysis Summary
📈 Daily Chart
• Trend: Strong uptrend with recent consolidation after an extended move higher.
• MACD: Bullish momentum cooling but still positive — histogram declining slightly.
• RSI: Neutral zone at 55.90, indicating room to the upside before overbought levels.
⏱ 15-Minute Chart
• Trend: Pullback followed by a strong bullish continuation. Price is making higher highs and higher lows.
• MACD: Strong bullish crossover; histogram expanding upward.
• RSI: 62.34 — not yet overbought, signaling continuation potential.
⏱ 3-Minute Chart
• Price Action: Bullish structure holding above short-term moving average.
• MACD: Bullish crossover in early stages with histogram turning positive.
• RSI: 66.22 — nearing overbought but not signaling immediate reversal.
⸻
🌐 Fundamental Context
• Gold is supported by:
• Persisting inflation concerns.
• Geopolitical risk premium.
• Expectations of rate cuts by the Fed in the coming quarters.
There are no immediate bearish catalysts. The macro backdrop favors gold strength, especially as the USD shows some weakness.
⸻
🎯 Trade Setup: Long XAU/USD
• Entry (Buy): 3320.00
• Slight pullback toward previous resistance-turned-support and short-term MA confluence.
• Stop Loss (SL): 3295.00
• Below recent intraday swing low and support zone; protects against false breakout.
• Take Profit (TP): 3370.00
• Previous high extension zone, aligning with momentum continuation projection.
FUSIONMARKETS:XAUUSD

Trade Idea: BTCUSD (SELL STOP)BTCUSD Trade Setup Analysis
FUSIONMARKETS:BTCUSD
1. Trend Analysis
- Price Action: BTC is in a strong uptrend, with recent highs near **105,819.00**.
- RSI (14): 72.88** (approaching overbought, but no divergence yet).
- MACD: Bullish but showing potential slowing momentum (histogram decreasing).
- **Key Levels:**
- Support: 82,447.57 (previous resistance turned support).
- Resistance: 105,819.00 (current high).
2. Entry Precision
- Price Action: Recent rejection from **108,104.70** (lower high) with a drop to **104,834.80**.
- RSI (14): 58.39 (neutral, slight bearish bias).
- MACD: Bearish crossover (249.955 → 241.911).
- **Key Levels:**
- Resistance:108,104.70 (recent high).
- Support: 104,834.80 (immediate level).
3. Confluence
- Price Action: Downtrend in shorter timeframe, with price below **106,237.30**.
- RSI (14): 50.6 (neutral, leaning bearish).
- MACD: Positive but weakening (41.156).
- **Key Levels**:
- Resistance: 106,237.30 (recent high).
- Support: 102,928.15 (next key level).
---
**Trade Idea: Short-Term Bearish Pullback**
Entry:
- Short near 105,820.00 (daily resistance confluence with 15M rejection).
Stop Loss (SL):
- 106,300.00 (above recent 3M high)
Take Profit (TP):
- TP1: 104,834.80 (15M support, 1:2 RRR).
- TP2: 102,928.15 (3M support, 1:4 RRR). (IDEAL)

Trade Idea: XAUUSD Long ( BUY LIMIT )🔍 Technical Summary
1. Daily Chart:
• Trend: Strong long-term uptrend, recent retracement.
• MACD: Still above zero but showing a decline in momentum—suggesting a pullback within a bullish structure.
• RSI (14): Neutral at ~50, signaling consolidation, not overbought or oversold.
• Price: Holding above major moving average, bullish structure intact.
2. 15-Minute Chart:
• Trend: Consolidation after downtrend, forming higher lows.
• MACD: Positive crossover forming, upward momentum building.
• RSI: ~60, showing moderate bullish momentum.
• Price Action: Consolidation potentially forming a base at support near 3240.
3. 3-Minute Chart:
• Trend: Clear short-term bullish breakout structure.
• MACD: Bullish crossover active.
• RSI: Trending upward but not overbought (~60), indicating room for upside.
• Price Action: Small breakout underway above short-term resistance.
⸻
🧠 Fundamental Backdrop (Gold):
• Inflation & Rate Cut Expectations: Potential for Fed rate cuts continues to support gold.
• Geopolitical Risk: Any flare-ups (e.g., Middle East or economic instability) tend to favor gold.
• USD Weakness: If the USD weakens due to dovish Fed tone, it benefits XAUUSD.
⸻
🏁 Trade Plan
✅ Trade Idea: LONG XAUUSD
• Entry: 3250.00
• Enter slightly below current price for a minor pullback.
• Stop Loss (SL): 3225.00
• Below recent local support and consolidation zone.
• Take Profit (TP): 3300.00
• Just below recent swing highs for a conservative but strong target.
FUSIONMARKETS:XAUUSD

Trade Idea: US30 Long (BUY LIMIT)Justification:
Technical Analysis:
1. Daily Chart:
• Strong bullish reversal from recent lows.
• MACD is crossing up sharply, showing fresh bullish momentum.
• RSI at 62.33 — rising but not yet overbought (room to run).
• Price reclaiming key moving averages.
2. 15-Minute Chart:
• Clear uptrend continuation.
• MACD and RSI confirm bullish momentum.
• Price consolidating at recent highs — potential breakout formation.
3. 3-Minute Chart:
• Short-term consolidation near highs with low RSI (38.84) — possible dip-buy opportunity.
• MACD near zero — primed for a new short-term wave.
Fundamental Analysis (as of early May 2025 context):
• Likely market optimism surrounding softer inflation data and potential rate cuts.
• Dow components (industrials, financials) benefit from economic soft-landing expectations.
• VIX (if tracked) remains subdued, confirming risk-on sentiment.
⸻
Trade Plan (Long):
• Entry: 42,360
Near current consolidation zone on lower timeframes.
• Stop Loss (SL): 41,850
Below recent swing lows and key moving average support (approx. 510 pts risk).
• Take Profit (TP): 43,380
Targeting previous resistance area on the Daily chart (approx. 1020 pts reward).
FUSIONMARKETS:US30

Trade Idea: BTCUSD Long ( BUY LIMIT )1. Trade Direction: Long
• Trend Alignment:
• Daily: Strong uptrend resumption with higher highs, higher lows, and price reclaiming above key moving average. RSI > 70 indicates strong momentum.
• 15-Min: Bullish breakout from consolidation, steep EMA slope, MACD rising, momentum increasing.
• 3-Min: Intraday momentum continuation pattern. Clean bullish price structure.
• MACD (All Timeframes): Strong bullish crossover, rising histogram — confirming trend strength.
• RSI (All Timeframes): RSI not yet overextended on lower timeframes, suggesting room for more upside.
• Price Action: Recent breakout with healthy retracement structure and no major bearish divergence.
• Fundamentals (Contextual):
• BTC crossing $100K is a psychological milestone likely to invite more inflows.
• Macro environment remains supportive for digital assets (inflation hedge, fiat debasement narrative).
• Strong market sentiment and volume suggest continuation potential.
⸻
2. Trade Setup
Entry:
• Entry Zone: $102,800
• Price is consolidating above previous resistance (~$102,000), now acting as support.
Stop Loss:
• SL: $101,200
• Below most recent intraday swing low and EMA on lower timeframes, giving it enough room.
Take Profit:
• TP: $106,800
• Near the next psychological level and extension target from recent measured moves.
FUSIONMARKETS:BTCUSD

Trade idea: XAGUSD long (BUY LIMIT)1. Technical Analysis Summary:
Daily Chart (Long-Term Trend)
• Trend: Strong bullish structure, recent consolidation after breakout above $30.
• MACD: Histogram tapering but still positive — momentum cooling but bullish bias intact.
• RSI (48.70): Neutral zone, not overbought or oversold — room for upside continuation.
• Price Action: Holding near previous resistance-turned-support around $32.40.
15-Min Chart (Intraday Context)
• Trend: Pullback from recent highs, but signs of base forming near $32.40.
• MACD: Still bearish, but histogram is flattening — suggesting downside momentum weakening.
• RSI (42.98): Near oversold territory — early sign of bounce potential.
3-Min Chart (Entry Timing)
• MACD: Just flipped bullish (signal line crossover), bullish divergence spotted.
• RSI (61.34): Rebounding strongly — confirmation of short-term bullish momentum.
• Price Action: Higher lows forming; reclaiming the 20 EMA.
⸻
2. Fundamental Backdrop (as of May 2025):
• Dovish Fed stance and expectations of interest rate cuts continue to support metals.
• Global macro uncertainty (inflation, geopolitical tensions) keeps demand for silver intact.
• Industrial demand for silver remains strong due to green energy initiatives.
⸻
3. Trade Setup (Long Position):
Bias: LONG XAGUSD
• Entry: 32.43 (current price, confirming breakout on 3M chart)
• Stop Loss (SL): 31.90 (below recent intraday low and structure support)
• Take Profit (TP): 33.80 (previous swing high from April, daily resistance zone)
FUSIONMARKETS:XAGUSD

Trade Idea: BTCUSD Long (BUY LIMIT)Technical Analysis:
Daily Chart
• Trend: Strong uptrend with a recent bullish recovery from a pullback.
• MACD: Bullish crossover, MACD line above Signal line, histogram positive.
• RSI (14): 66.21 — momentum is strong but not overbought.
15-Minute Chart
• MACD: Positive histogram and crossover confirming short-term bullish momentum.
• RSI (14): 53.89 — mid-range, confirming no immediate exhaustion.
• Price Action: Higher lows and higher highs indicate short-term trend alignment with the Daily.
3-Minute Chart
• MACD: Bearish divergence, indicating a possible short-term pullback.
• RSI (14): 43.43 — recent dip offering a better long entry on minor weakness.
• Price: Currently consolidating near $97,000 after rejecting a local high.
⸻
Fundamental Context:
• Macro: Institutional inflows into BTC ETFs and upcoming monetary easing expectations are long-term bullish drivers.
• Market Sentiment: Risk-on behavior across equities is spilling into crypto.
⸻
Trade Setup (Long Position)
• Entry: $96,800
• Minor pullback support zone on M15/M3, aligns with moving average and volume node.
• Stop Loss (SL): $95,400
• Below recent swing low and structural support.
• Take Profit (TP): $100,200
• Near Daily resistance and psychological round number FUSIONMARKETS:BTCUSD

Trade Idea: US30 Long (BUY LIMIT)Technical Overview
Daily Chart (Macro View):
• Trend: Recent bounce from major support near ~37,600 after a sharp selloff.
• MACD: Still bearish but showing early signs of momentum reversal (histogram rising).
• RSI: Neutral (~53.8), coming up from oversold territory—indicative of potential recovery.
• Price: Holding above 41,000, a key psychological level and previous consolidation zone.
15-Minute Chart (Swing/Short-Term View):
• Price: Forming higher lows after a significant bounce.
• MACD: Nearing a bullish crossover.
• RSI: Moderately bullish at ~56.87.
3-Minute Chart (Entry Precision):
• Price: Recently broke above short-term moving average.
• MACD: Bullish with strong histogram momentum.
• RSI: Slightly overbought (~52.90), but not extreme.
⸻
Fundamental Context (as of May 2025):
• Market sentiment is cautiously bullish after Fed pause hints and solid tech earnings.
• Inflation pressures are easing slightly, supporting risk-on sentiment.
• Recent volatility due to rate expectations and macro data; however, markets are recovering from sharp selloffs.
⸻
Bias: Long Position
US30 shows a strong recovery setup with macro support, bullish lower-timeframe confirmation, and neutral-to-bullish momentum indicators.
Entry (Buy Limit):
40,960 – small retracement near the short-term EMA and previous breakout on the 3-min chart.
Stop Loss (SL):
40,700 – below the recent swing low and psychological round level.
Take Profit (TP):
41,560 – retest of minor resistance from earlier consolidation area, offering a solid risk-reward.
FUSIONMARKETS:US30

Trade Idea: Long (MARKET)Technical Confluence:
Daily Chart:
• Strong bullish engulfing recovery from recent support (~37,700).
• MACD starting to curl back up from deeply negative levels — possible trend reversal.
• RSI recovering above 50 (currently 52.49), suggesting bullish strength resuming.
15-Min Chart:
• Sustained uptrend with pullbacks respecting the moving average.
• MACD crossing positive territory.
• RSI at 64.77 with room to move higher before hitting overbought levels.
3-Min Chart:
• Tight consolidation after a sharp breakout to 40,766 — forming a potential bull flag.
• RSI at 58.89 — mid-level with upward momentum potential.
• MACD histogram shrinking — possible continuation breakout imminent.
⸻
Fundamental Context:
• Market Sentiment: U.S. markets are generally supported due to strong earnings reports and decreasing recession fears. Treasury yields have stabilized, and risk appetite is returning.
• Upcoming Events: FOMC rate decision is key — bullish bias if they hold or soften tone.
⸻
Trade Details:
• Entry: 40,770
• Price is consolidating just under this resistance. Enter on breakout with volume confirmation.
• Stop Loss (SL): 40,350
• Below recent support on the 15M chart and under the moving average. Conservative SL with volatility in mind.
• Take Profit (TP): 41,450
• Measured move from the flag pattern and aligns with Fibonacci extension and historical resistance.
FUSIONMARKETS:US30

Trade Idea: US30 Long (BUY LIMIT)Technical Analysis Summary
Daily Chart (Macro View)
• Price has bounced off a key support near 37,700 and reclaimed the psychological level 40,000.
• MACD is starting to reverse higher from oversold conditions, showing early bullish divergence.
• RSI is recovering from below 30, now near 49, indicating a potential trend reversal.
• Trend: Medium-term recovery from a correction; possible continuation to recent highs around 44,000.
15-Minute Chart (Tactical Entry Zone)
• Price has broken a downtrend and is now consolidating above previous resistance at 40,000.
• MACD is bullish (histogram rising), and signal lines are above zero.
• RSI at 62.6, suggesting bullish momentum but not yet overbought.
• White MA shows clear upward curvature.
3-Minute Chart (Precision Entry)
• Recent pullback retested the MA and bounced.
• RSI at 66, nearing overbought, but price is in clear short-term uptrend.
• MACD just crossed bullish again after a small consolidation.
⸻
Fundamental Context
• Recent Fed signals suggest potential rate pause or cuts, which is bullish for indices.
• Earnings season has generally surprised to the upside, especially among large caps.
• Macro backdrop: Slowing inflation + strong labor market = supportive of equities.
• Risk appetite is increasing, as seen in tech and industrials rebounding.
⸻
Trade Setup
• Position: Long US30
Entry
• Buy: 40,200 (current price action confirms upward momentum)
Stop Loss (SL)
• SL: 39,700 (below recent 15-min swing low & psychological level)
Take Profit (TP)
• TP1: 41,200 (recent intraday high and near resistance)
FUSIONMARKETS:US30
