Lighten Up! After a rounding bottom where it looked as though the bulls were forming a base, we now see a long bearish red candle hinting at the bears denying a bullish breakout. I wouldn't close positions here, but I would lighten up on longs. Follow me for more simple to understand expert analysis. Thank you for reading. Now get out there and trade! :)
Longs

Novo Nordisk's The recent drop in Novo Nordisk's stock price is attributed to several factors. A key issue is the company’s struggle to meet the surging demand for its weight-loss drugs, such as Wegovy. Although demand remains strong, investors are concerned about Novo Nordisk's ability to scale up production and deliveries, which is creating downward pressure on the stock.
Additionally, some recent financial results failed to meet Wall Street expectations. Despite revenue growth in key product categories, overall revenues in some reports came in below forecasts. This underperformance has contributed to a negative investor sentiment.
However, analysts emphasize that Novo Nordisk's core products remain in high demand, and the company has significant long-term growth potential if it addresses its supply chain and production challenges

Trade Idea: US30 Long ( BUY LIMIT )Technical Analysis Summary:
Daily Chart:
• The US30 is bouncing off a recent sharp correction with a bullish engulfing candle forming at support (around 37,675).
• RSI is recovering from oversold territory, now at 46.14 – momentum is shifting.
• MACD still bearish but histogram is shrinking, indicating weakening downward momentum.
15-Minute Chart:
• Strong recovery after a double-bottom near 38,200.
• RSI at 74.55 shows near overbought but still trending up – strong momentum.
• MACD showing a strong bullish crossover and rising histogram – confirmation of intraday trend.
3-Minute Chart:
• Strong breakout to the upside with consolidation at highs.
• RSI around 58 – room to move higher.
• MACD bullish, histogram expanding – short-term continuation likely.
⸻
Fundamental Context (as of April 2025):
• Recent correction in US indices is likely a pullback within a broader bull market (based on Q1 earnings optimism and easing inflation expectations).
• No major Fed tightening signals – bullish for equities.
• Dow Jones (US30) often rebounds strongly after panic drops, especially when technicals align with macro calm.
⸻
Trade Setup (Buy):
• Entry: 39,700 (current consolidation after breakout)
• Stop Loss (SL): 39,150 (below last minor pullback structure and below 3M EMA support)
• Take Profit (TP): 40,800 (near previous structure on the Daily and round number psychological level) FUSIONMARKETS:US30

Trade Idea: US30 Long ( MARKET )Technical Justification:
Daily Chart:
• Oversold Conditions: RSI is at 35.90, approaching oversold.
• MACD is deeply negative (-905.428 / -831.781), signaling extended downside and a potential for a mean reversion bounce.
• Price recently bounced sharply off a support area around 37,800–38,000, forming a possible bullish rejection wick.
15-Min Chart:
• Bullish Divergence visible in RSI and MACD.
• RSI rebounded from sub-30 to 52.10, signaling strengthening momentum.
• MACD histogram has reduced in negativity, suggesting decreasing bearish pressure.
3-Min Chart:
• Clear short-term uptrend forming after a strong intraday drop.
• RSI 62.56 and MACD turning positive show bullish momentum building.
• Price just reclaimed a key intraday level (~38139) with follow-through.
⸻
Fundamental Bias:
Recent oversold market conditions, combined with potential short-term relief rally due to earnings optimism, Fed rate pause speculation, or geopolitical cooling, support a tactical long bias.
⸻
Trade Setup:
• Entry (Buy): 38,150
• Above the minor resistance turned support zone and confirmation of bullish momentum.
• Stop Loss (SL): 37,800
• Below the recent strong support zone from Daily and intraday.
• Take Profit (TP): 38,750
• Just below the next major resistance zone on the 15-min/1H chart. FUSIONMARKETS:US30

surpassing the old peak, gold price will reach above 3400 soon⭐️GOLDEN INFORMATION:
Gold price (XAU/USD) resumes its upward momentum, climbing to a fresh all-time high around $3,375 during Monday’s early Asian session, as markets reopen following the extended holiday weekend. The surge comes amid renewed investor appetite for safe-haven assets, fueled by ongoing geopolitical tensions and lingering uncertainty surrounding US President Donald Trump’s aggressive tariff agenda.
With fears mounting over the broader economic fallout from escalating trade conflicts, gold has soared over 25% year-to-date. “In today’s environment of intensifying tariff ambiguity, slowing global growth, sticky inflation, and rising geopolitical risks, the strategic case for increasing gold exposure has never been stronger,” noted analysts at UBS, emphasizing a shift toward diversification away from US assets and the US Dollar.
⭐️Personal comments NOVA:
Big increase, gold price continues to rise thanks to tariff momentum
⭐️SET UP GOLD PRICE:
🔥SELL GOLD zone : 3404- 3406 SL 3409 scalping
TP1: $3395
TP2: $3380
TP3: $3370
🔥SELL GOLD zone : 3415- 3417 SL 3422
TP1: $3405
TP2: $3390
TP3: $3370
🔥BUY GOLD zone: $3357 - $3355 SL $3350
TP1: $3365
TP2: $3380
TP3: $3405
⭐️Technical analysis:
Based on technical indicators EMA 34, EMA89 and support resistance areas to set up a reasonable BUY order.
⭐️NOTE:
Note: Nova wishes traders to manage their capital well
- take the number of lots that match your capital
- Takeprofit equal to 4-6% of capital account
- Stoplose equal to 2-3% of capital account

Trade Idea: US30 Long ( BUY LIMIT ) Technical Analysis Summary
Daily Chart:
• Trend: Recent strong rejection from the 36893 zone followed by a sharp V-reversal; currently recovering, but still under prior highs.
• MACD: Deeply negative but showing signs of reversal (momentum slowing).
• RSI: At 46.22 — mid-range, suggesting room to go higher.
• Bias: Recovery from oversold — bullish short-term momentum within a larger corrective phase.
15-Minute Chart:
• Trend: Strong impulse move up from 37092 area to 40395.
• MACD: Positive cross and momentum flattening — indicating potential short-term consolidation or continuation.
• RSI: 45.36 — still not overbought. Room to push higher.
• Bias: Bullish continuation with potential pullback entries.
3-Minute Chart:
• Trend: Recent micro consolidation with minor pullbacks.
• MACD: Near zero but ticking up, signaling possible small continuation wave.
• RSI: 45.87 — similar mid-range, no bearish divergence.
• Bias: Short-term bullish scalp opportunity.
⸻
Fundamental Outlook (Macro Context)
• Recent Fed tone remains data-dependent, but no immediate rate hike expectations.
• Inflation cooling and market anticipating a potential rate cut later this year supports equities.
• US earnings season began; early sentiment is optimistic.
• Risk-on sentiment may support indices like US30 to grind higher short-term.
⸻
Trade Idea: Long Position
Entry:
Buy Limit @ 40220
• Just below current price, near recent minor support and EMA bounce zone (15M + 3M confluence).
Stop Loss:
SL @ 39870
• Below minor support & key structure zone on 15M chart.
Take Profit:
TP @ 40990
• Next resistance based on Daily chart supply zone and prior rejection area.
FUSIONMARKETS:US30

TRADE IDEA: US30 LONG ( BUY LIMIT )
Daily Chart:
• RSI: At 24.33, it’s in oversold territory — potential for a reversal.
• MACD: Strong bearish momentum, but the histogram may be bottoming out, signaling a potential bullish divergence forming.
• Price Action: Testing key support zone near 38300, which was previously a resistance-turned-support area.
15-Minute Chart:
• RSI: At 60.68, indicating early bullish momentum.
• MACD: Bullish crossover recently occurred; histogram rising — confirming short-term upward trend.
• Price Action: Clear bounce from recent lows with higher highs and higher lows forming.
3-Minute Chart:
• Momentum clearly shifting up.
• Price moving above short-term moving average, showing intraday strength.
⸻
Fundamental Context:
• US economic data has recently shown mixed signals, but dovish Fed tone and potential rate cuts in the near future favor equity indices recovery.
• No major bearish macro headlines present at this time to sustain the steep drop.
⸻
Trade Parameters:
• Entry: 38,390 (current price zone, confirming strength above local consolidation)
• Stop Loss (SL): 38,000 (below recent lows and psychological level)
• Take Profit (TP): 39,190 (previous supply zone, daily EMA resistance area)
• Risk: 390 points
• Reward: 800 points
• RRR: 2.05:1
FUSIONMARKETS:US30

OptionsMastery: Demand Zone for STNG! If we get a break above 38.59 with volume this week on STNG, look for a potential leap trade. Liquidity areas are TP's. (Not financial advice).

Trade Idea: US30 Long ( BUY STOP )
Technical Analysis:
1. Daily Chart:
• US30 is in a pullback phase after a strong uptrend.
• The MACD is negative, but price is nearing key support, signaling a potential reversal.
• The RSI is at 43.74, close to oversold territory, indicating limited downside risk.
2. 15-Minute Chart:
• The MACD is strongly positive, confirming short-term bullish momentum.
• A strong bounce from recent lows suggests buyers are stepping in.
• The RSI is 55.40, indicating neutral momentum with room to push higher.
3. 3-Minute Chart:
• The MACD is slightly negative, but showing signs of bottoming out.
• RSI is 49.62, neutral but ready to turn up.
• Price is consolidating after a strong move up, suggesting a continuation higher.
Fundamental Analysis:
• The Dow Jones (US30) has recently rebounded from key support levels, aligning with a strong US economy and moderate Fed policies supporting equity markets.
• Global economic conditions remain stable, and institutional buyers are likely stepping in at this level.
⸻
Trade Execution:
• Entry: 41,900 (Confirmation of bullish momentum after consolidation)
• Stop-Loss (SL): 41,750 (Below recent low, protecting against further downside)
• Take-Profit (TP): 42,250 (Targeting recent resistance, maintaining a 2:1 RRR) FUSIONMARKETS:US30

Trade Idea: US30 Long ( BUY LIMIT ) Technical Analysis:
1. Daily Chart (Long-Term View):
• The price has recently pulled back but remains in a long-term uptrend.
• The MACD is negative, indicating past selling pressure, but it is starting to turn, which suggests momentum may shift bullish.
• The RSI is at 47.54, close to neutral, meaning there is room for upside movement without being overbought.
2. 15-Minute Chart (Intraday Trend):
• The price is recovering after a dip.
• MACD is deeply negative, suggesting it may be at a bottom, and a reversal could happen.
• The RSI at 48.27 is near neutral, indicating a potential bullish move.
3. 3-Minute Chart (Entry Timing):
• A small uptrend has started, and the price is crossing above the short-term moving average.
• The MACD is turning positive, signaling a potential bullish push.
• RSI is above 50 (56.24), confirming strength in the short term.
⸻
Fundamental Analysis:
• Market sentiment remains bullish overall for US indices due to strong economic data.
• Dow Jones remains in an uptrend on the higher timeframes, and recent dips are likely just corrections before another push higher.
• Liquidity conditions and central bank policy support equities.
⸻
Trade Setup:
Entry: 42,400 (current price area where price is stabilizing)
Stop Loss (SL): 42,250 (below recent support, keeping risk low)
Take Profit (TP): 42,800 (previous resistance level) FUSIONMARKETS:US30

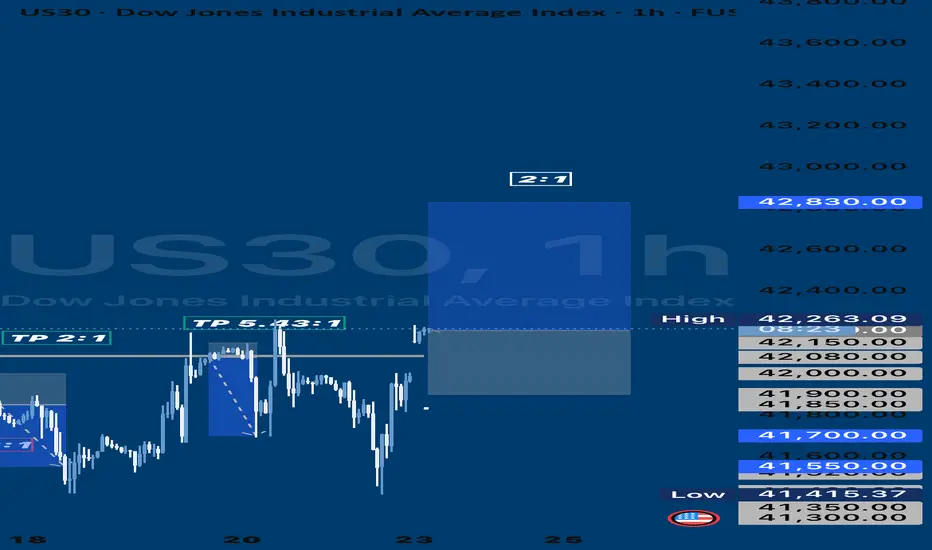
Trade Idea: US30 Long ( BUY LIMIT )1. Technical Analysis Breakdown:
Daily Chart:
• Trend: Bullish overall, but showing signs of pullback.
• MACD: Bearish, indicating weakening momentum.
• RSI: At 45.23 — neutral but leaning toward oversold territory.
• Support level: Around 41,500.
• Resistance level: Recent high near 42,890.
15-Min Chart:
• Trend: Strong intraday upward momentum.
• MACD: Bullish crossover with momentum building.
• RSI: 69.09 — nearing overbought but still has room.
• Support: Around 41,760.
• Resistance: 42,208 (current price), next major level at 42,500.
3-Min Chart:
• Trend: Short-term bullish with a slight consolidation.
• MACD: Flat, showing a pause but no reversal yet.
• RSI: 53.19 — mid-range, suggesting more upside potential.
⸻
2. Fundamental Analysis:
• US economy shows resilience (strong job data, improved GDP).
• Fed’s stance on rates remains balanced, leaning dovish, supporting equities.
• Geopolitical tensions slightly cooling, risk appetite growing.
⸻
3. Trade Plan — Long Position (Buy)
• Entry: 42,210 (after a clean break above consolidation).
• Stop Loss (SL): 41,900 (below recent intraday support).
• Take Profit (TP): 42,830 (previous daily high). FUSIONMARKETS:US30
Start adjusting before April tariff policy ! XAU ✍️ NOVA hello everyone, Let's comment on gold price next week from 03/24/2025 - 03/28/2025
🔥 World situation:
Gold prices decline for the second consecutive day but remain on track to close the week in positive territory, despite a stronger US Dollar (USD) and profit-taking ahead of the weekend. XAU/USD is currently trading at $3,019, down 0.81%.
Market sentiment remains cautious, though US equities are paring earlier losses. Meanwhile, bullion stays on the defensive as the USD regains momentum, with the US Dollar Index (DXY) edging up to 104.05, marking a 0.24% increase.
🔥 Identify:
Gold prices are in a short-term downtrend in the H4 frame, adjusting at the end of March, accumulating before tax policies in early April 2025.
🔥 Technically:
Based on the resistance and support areas of the gold price according to the H4 frame, NOVA identifies the important key areas as follows:
Resistance: $3057, $3080
Support : $2982, $2910
🔥 NOTE:
Note: Nova wishes traders to manage their capital well
- take the number of lots that match your capital
- Takeprofit equal to 4-6% of capital account
- Stoplose equal to 2-3% of capital account
- The winner is the one who sticks with the market the longest

Why Invest in CONMED Corp (CNMD)?Why Invest in CONMED Corp (CNMD)?
Strong Earnings Growth – CONMED has experienced a remarkable increase in earnings, with EPS surging by 104% year-over-year and net income rising by 105% YoY. This indicates strong financial performance and profitability momentum.
Attractive Valuation – The stock is currently trading at a P/E ratio of 13.79, which is significantly lower than its historical averages. This suggests that CNMD may be undervalued relative to its past performance and industry peers.
Consistent Revenue Growth – The company reported revenue of $1.31 billion for the last year, marking a 5% increase compared to the previous period. This steady growth highlights CNMD’s ability to expand its market presence.
Improving Margins and Efficiency – CONMED has seen an increase in operating income (+66% YoY), operating margin (+58% YoY), and return on assets (+104% YoY), demonstrating better cost management and operational efficiency.
Dividend and Low Payout Ratio – The company pays a dividend of $0.80 per share, yielding approximately 1.35%, with a conservative payout ratio of 18.6%. This allows room for future dividend increases while maintaining financial flexibility.
Healthcare Sector Stability – As a medical technology company specializing in surgical devices, CONMED operates in a defensive sector that tends to be resilient during economic downturns. This provides investors with a level of stability.
Solid Balance Sheet and Liquidity – The company has a current ratio of 2.3, indicating strong short-term liquidity. Additionally, its quick ratio of 0.94 suggests it can cover its immediate liabilities effectively.
Final Thoughts:
CONMED presents a compelling investment case due to its strong earnings growth, attractive valuation, improving profitability, and stable position in the healthcare sector. However, potential investors should always consider market conditions and individual risk tolerance before making investment decisions.

Reasons to Invest in CVS Health (CVS)Reasons to Invest in CVS Health (CVS)
Strong Market Position
CVS Health is a leading healthcare company with a diversified business model, including retail pharmacies, insurance, and healthcare services. Its extensive network provides a competitive advantage.
Attractive Valuation
CVS is currently trading at a P/E ratio of approximately 12.23, which is lower than its historical average of 17.55. This suggests the stock may be undervalued compared to its long-term performance【41】.
Consistent Free Cash Flow (FCF)
The company generates significant free cash flow, which allows it to invest in growth, reduce debt, and return capital to shareholders.
Dividend and Shareholder Returns
CVS has a stable dividend policy with a payout ratio that allows for sustainable growth while reinvesting in the business【40】.
Resilient Business Model
The healthcare industry is defensive, meaning CVS can perform well even in economic downturns. The company benefits from consistent demand for prescriptions and healthcare services.
Future Growth Potential
CVS is expanding its healthcare services through acquisitions and technology-driven solutions. Investments in Medicare, pharmacy benefits, and digital health are expected to drive long-term growth.
Would you like a deeper fundamental comparison between CVS and its competitors?

EURCHF LONGSEURCHF has been on a bullish run so I'll continue looking for buys as long as price continues to form bullish structure (Higher highs & higher lows). Price is currently at a resistance so I'd wait until price breaks above this resistance before placing any buys.

EUR/USD BUYThis trade is cloaed, just another trade diary for me.
This analysis is based on the provided image and should not be considered financial advice. Trading involves risks, and it is essential to conduct your own research and consult with a financial advisor before making any trading decisions.

GBP/USD BUYThis trade is closed now but it is me logging it for anyone and everyone.
This analysis is based on the provided image and should not be considered financial advice. Trading involves risks, and it is essential to conduct your own research and consult with a financial advisor before making any trading decisions.

Trade Idea: XAUUSD LONG (BUY LIMIT)Technical Analysis:
1. Trend Analysis:
• 1H Chart: Clear uptrend with a pullback and price stabilizing near 2918.
• 15M Chart: Price has been consolidating after a recovery from a dip.
• 3M Chart: Market is forming higher lows, showing strength.
2. Indicators:
• MACD:
• 1H Chart: Bullish momentum, MACD line above signal line.
• 15M Chart: MACD recovering from a dip.
• 3M Chart: Weakening bearish momentum, signaling potential reversal.
• RSI:
• 1H Chart: 53.84 (neutral, with room for upside).
• 15M Chart: 50.50 (balanced, indicating neither overbought nor oversold).
• 3M Chart: 57.78 (leaning bullish).
3. Support & Resistance Levels:
• Support: 2910, 2895
• Resistance: 2928, 2946
Fundamental Analysis:
• Gold’s recent movement is supported by:
• Dollar weakness due to expectations of Fed rate cuts.
• Geopolitical uncertainty keeping gold as a safe-haven asset.
• U.S. Treasury Yields stabilizing, giving gold more upside room.
Trade Execution:
• Entry: 2918
• Stop Loss (SL): 2908 (10 points)
• Take Profit (TP): 2938 (20 points)
• Risk-Reward Ratio: 2:1
Rationale for Trade:
• Momentum is bullish across timeframes.
• Good confluence of technical and fundamental factors supporting upside.
• Risk is well-managed with a strong RRR of 2:1.
FUSIONMARKETS:XAUUSD

Trade Idea: XAUUSD Long ( BUY LIMIT )Technical Analysis:
1. Trend Analysis:
• H1: Uptrend resuming after a pullback. MACD histogram turning positive, indicating bullish momentum. RSI at 59.21, showing strength but not overbought.
• M15: Price recently broke above resistance and is holding above it. MACD near zero but turning positive, supporting bullish continuation. RSI is neutral at 50.36, leaving room for further upside.
• M3: Strong breakout and consolidation. MACD is positive, and RSI at 52.73 shows bullish strength.
2. Support & Resistance:
• Key support: 2900
• Key resistance: 2945
3. Moving Average Confirmation:
• On all timeframes, the price is holding above the moving average, signaling bullish continuation.
Fundamental Analysis:
• Gold is benefiting from safe-haven demand amid global uncertainties.
• US Dollar Index (DXY) has been weakening, which supports gold’s upside.
• Upcoming economic data (if dovish) may further push gold higher.
Trade Execution:
• Entry: 2915 (Current price)
• Stop-Loss (SL): 2900 (Below key support)
• Take-Profit (TP): 2945 (Key resistance level)
FUSIONMARKETS:XAUUSD

Trade Idea: XAUUSD LONG (BUY LIMIT) Technical Analysis
1. 1H Chart (Higher Timeframe Trend)
• Downtrend Reversal: Price was in a strong downtrend but is now bouncing off a key support near 2827-2830.
• MACD: Histogram is reducing bearish momentum, suggesting a possible trend reversal.
• RSI (14): Rising from oversold conditions (~54.89), indicating bullish momentum building up.
2. 15-Min Chart (Intraday Confirmation)
• Reversal Pattern: A sharp recovery from lows around 2849, forming higher lows.
• MACD: Bullish crossover with histogram turning positive, confirming bullish momentum.
• RSI (12): Nearing overbought levels (~68.23), but still has room for continuation.
3. 3-Min Chart (Entry Timing)
• Pullback to Support: Price is consolidating after a strong breakout above 2862.
• MACD: Still showing bullish structure but a minor pullback is visible.
• RSI (10): Neutral at 50.89, meaning price is neither overbought nor oversold, ideal for a continuation entry.
Fundamental Analysis
• Gold Demand: Potentially rising due to economic uncertainty, with investors looking for safe-haven assets.
• USD Weakness: If upcoming economic data (e.g., inflation, job reports) indicate a slowing U.S. economy, gold could gain strength.
• Market Sentiment: If risk-off sentiment continues, gold could push higher.
Trade Execution
Position: Long XAU/USD
• Entry: 2865 (After minor pullback confirmation)
• Stop Loss: 2855 (Below recent pullback low)
• Take Profit: 2890 (Near previous resistance level)
• Risk-Reward Ratio (RRR): 2.5:1
Rationale
• The uptrend reversal is forming on the 1H and 15M charts.
• Momentum indicators (MACD & RSI) support a bullish move.
• Strong demand and potential USD weakness could fuel further upside.
FUSIONMARKETS:XAUUSD

#GALAUSDT is breaking resistance – expecting a moveBYBIT:GALAUSDT.P is trading near the key $0.02490 level, forming a consolidation zone before a potential breakout. Volume is increasing, and price is holding above POC $0.02255, confirming strong buyer activity. A breakout above $0.02495 could trigger an accelerated move toward $0.02520 – $0.02565.
📈 LONG BYBIT:GALAUSDT.P from $0.02495
🛡 Stop Loss: $0.02460
⏱ 1H Timeframe
✅ Overview:
➡️ BYBIT:GALAUSDT.P is approaching $0.02495, a key resistance level.
➡️ Price remains above POC $0.02255, confirming strong buyer interest.
➡️ Increasing volume supports the potential bullish move.
⚡ Plan:
🔵 Holding above $0.02495 increases the chance of an uptrend.
🔵 Main support at $0.02460 – losing this level invalidates the setup.
🔵 Target zones – $0.02520, $0.02540, and $0.02565, where profit-taking is expected.
🎯 Take Profit:
💎TP1: $0.02520 – first profit-taking zone.
💎 TP2: $0.02540 – strong resistance level.
💎 TP3: $0.02565 – final upside target.
📢 Recommendations:
✅ Bullish confirmation requires a strong close above $0.02495.
✅ If price slows down at $0.02520, partial profit-taking is recommended.
✅ A drop below $0.02460 invalidates the setup.
🚀 BYBIT:GALAUSDT.P is breaking resistance – expecting a move to $0.02565!
📢 Holding above $0.02495 opens the door for further gains. Watch volume closely – if it weakens, price may consolidate.
📢 Entry above $0.02495, targets at $0.02520 – $0.02565.
📢 Partial profit-taking recommended at $0.02540.
📢 If price drops below $0.02460, the setup is invalidated.
📌 Strategy: Resistance Breakout + Profit Targeting at Key Levels.

#SWELLUSDT longsignal📉 LONG BYBIT:SWELLUSDT.P from $0.01928
🛡 Stop Loss: $0.01890
⏱ 1H Timeframe
✅ Overview:
➡️ BYBIT:SWELLUSDT.P is showing a strong upward movement after breaking out of consolidation. The price has broken key resistance levels and is now forming a retest zone, confirming bullish strength.
➡️ POC (Point of Control) is located at $0.01175, far below the current price, indicating a shift to a new accumulation phase.
➡️ Trading volumes have increased significantly, which could further strengthen the upward impulse.
⚡ Plan:
➡️ Enter LONG at $0.01928 after confirming the breakout level.
➡️ Stop-Loss set at $0.01890 to protect against false breakouts.
➡️ Primary targets – $0.01967, $0.02013, and $0.02065, where partial profit-taking is possible.
🎯 TP Targets:
💎 TP1: $0.01967
🔥 TP2: $0.02013
⚡ TP3: $0.02065
🚀 Expectation: If the current trend holds, BYBIT:SWELLUSDT.P may continue its upward movement towards $0.02065 and beyond.

ATOM LONG PART IIConsidering that we are below the 12/21 EMA on the daily timeframe, the trend remains downward.
The EMAs may continue to decline before the price temporarily moves above them, creating a false impression of a trend reversal.
After that, we could see a drop below $3.8.
