XAUUSD breaks out – bullish bias returnsGold has bounced from the bottom of the descending channel, initiating a clear upward move with a series of strong bullish candles. On the H2 chart, price has broken above the upper boundary of the medium-term downtrend channel and filled the nearest fair value gap, signaling a resurgence in buying pressure.
Current price action is approaching a previous resistance zone, aligned with recent swing highs. The chart suggests a potential consolidation before further upside, provided that the current bullish structure remains intact.
From a macro perspective, while the stronger-than-expected U.S. PMI data supports the USD in the short term, weak labor market figures and ongoing global geopolitical tensions continue to fuel demand for gold as a safe-haven asset. This environment is helping sustain XAUUSD’s current recovery structure.
Longsetup

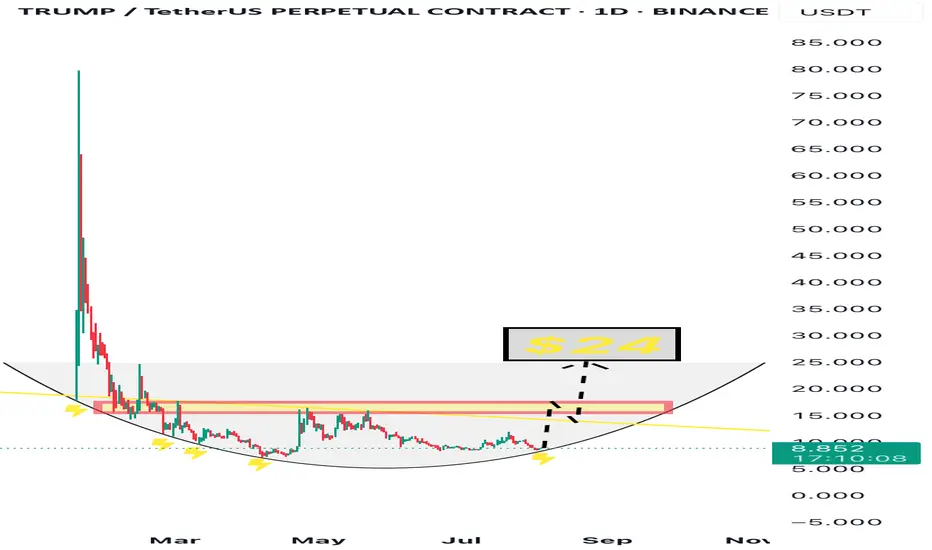
$TRUMP - Rounding Bottom + Strong Narrative We’re currently witnessing a classic rounding bottom formation on the $TRUMP chart.
The price has touched the base 4 separate times, each followed by a bounce — clearly indicating strong support and accumulation.
Now, once again, $TRUMP is testing this base, and structurally the chart suggests a potential breakout toward $24, the top of the cup.
But it’s not just a technical story — the fundamentals are stronger than ever:
• 🎲 A Trump-themed Monopoly game has been officially confirmed by Bill Zanker and the project’s team
• 💸 Justin Sun has publicly announced he will purchase $100 million worth of $TRUMP tokens
• 🛡 Eric Trump revealed that $TRUMP will be added to WLFI’s strategic reserves
This is no longer just speculation — it’s momentum backed by real players.
All eyes on the $24 breakout.
BTC accumulates, slightly adjusts down💎 BTC PLAN UPDATE – START OF THE WEEK (04/08)
🔍 1. Current Technical Structure
Price Pattern: The chart shows BTC is forming a falling wedge pattern, with converging support and resistance lines.
False Break: There was a false break below the strong support zone around ~112,000, followed by a sharp rebound. This indicates buyers are actively defending this level, showing potential buying pressure.
Fibonacci Retracement: From the recent low to high, the 0.5 (115,559) and 0.618 (116,361) Fibonacci levels are acting as key resistance zones.
Key Price Levels:
• Strong support: 111,800 – 112,300
• Near resistance: 115,500 – 116,500
• Next resistance: downtrend line and previous high around 118,000 – 119,000
🔄 2. Possible Trend Scenarios
✅ Main scenario (bullish):
BTC made a false break below the wedge → rebounded toward Fibonacci resistance → potential:
• Continue rising to the 115,500 – 116,500 zone
• If it breaks and holds above this zone, BTC could break out of the wedge pattern and target 118,000 – 120,000
• A longer-term target could be the 1.618 Fibonacci Extension around ~123,159
❌ Alternative scenario (bearish):
If BTC fails to break above 116,000 and gets rejected:
• It may retest the 112,000 support zone again
• A breakdown below this support would bring back the downtrend
🔄 3. Bullish Supporting Factors:
• The false break signals a shakeout of weak sellers.
• A potential inverse head-and-shoulders pattern is forming, supporting a bullish reversal.
• Moving Averages (MA): Price is nearing the 200 MA (red) – a possible bullish crossover with shorter-term MAs may occur, signaling a buy.
🧭 Suggested Trading Strategy
• Safe buy zone: Around 113,500 – 114,000 if there’s a pullback.
• Take profit in stages: 116,500 – 118,000 – 120,000
• Stop-loss: Below 112,000 in case of a confirmed breakdown

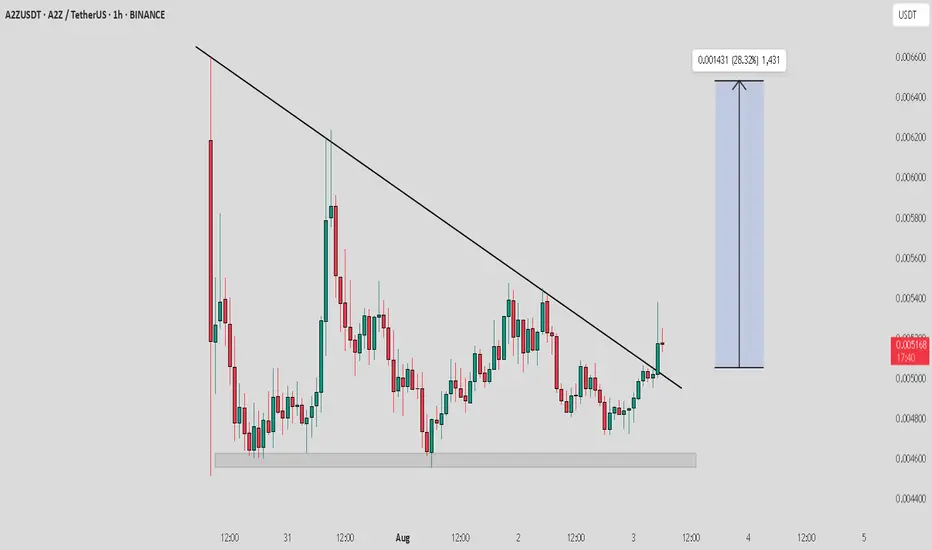
A2Z / USDT : Keep a close watch on retest proccessA2Z/USDT has broken out of a key trendline resistance and is now retesting the breakout zone.
This retest phase is critical — a successful hold here could trigger a sharp bullish move of 20-30% in the short term.
Volume confirmation and strong bullish candle on lower timeframes will add more confidence.
Keep it on your radar — next move could be quick.
SOPH / USDT :Broke out from trendline resistance SOPH/USDT Breakout Watch
SOPH/USDT has just broken the trendline resistance and is showing strong bullish potential. With a successful retest, we could see a 13 - 15% rise soon!
Key Point: Keep an eye on the retest for confirmation. A solid hold will trigger a strong upward move. Be ready for the breakout!

GOLD 4H – Potential Bullish Reversal After Falling Wedge BreakouPrevious Price Action,
There was a clear downtrend inside a descending channel
Price respected the channel with multiple touches on both upper and lower trendlines.
Eventually, there was a strong bullish breakout from the channel, signaling a potential trend reversal.
Bullish Breakout Confirmation,
After the breakout, the price made a sharp impulsive move up, followed by a minor consolidation.
Fibonacci retracement levels are drawn over the bullish leg possibly to identify pullback support zones.
Watch For.
A potential retest of the breakout zone or 50% Fib area.
Consolidation near current price (TP3) — might cause short-term resistance.
Price needs to hold above 3349 zone to maintain bullish structure.

MAGIC / USDT : Bullish breakout alert
MAGIC/USDT has recently broken its descending trendline, signaling potential for a 35 - 50% upside move in the coming weeks. This breakout could lead to significant growth if the bullish momentum continues!
Key Point: A solid retest above the breakout zone will confirm the uptrend, targeting a potential rise of up to 0.25. Stay alert!

NZDJPY Long Setup: Institutional Flow Signals Upside to 89.690🗓 Seasonal Outlook
- JPY Seasonal Weakness: Historical trends show July and August tend to be bearish months for the Japanese Yen, reinforcing weakness across JPY pairs.
- NZD Seasonal Strength: July typically supports bullish momentum for NZD, while August may present challenges. However, strength in NZD versus relative JPY softness suggests continued upside potential into early August.
💼 Institutional Positioning (COT Analysis)
- JPY: Commercial traders remain net short, suggesting expectations of further depreciation.
- NZD: Also shows commercial net shorts, yet the price structure aligns more with bullish continuation, hinting at speculative flow favoring NZD upside.
🧠 Technical Analysis
- Liquidity Dynamics:
- Price has cleared multiple buy-side liquidity levels near prior swing highs.
- Sell-side zones continue to hold, indicating strong bullish intent and failed bearish follow-through.
- Market Structure:
- Higher lows and sustained bullish reactions post-liquidity sweeps reinforce an upward trajectory.
- Current structure suggests accumulation and breakout patterns toward the proposed target.
🎯 Target Projection: 89.690

XRP ANALYSIS🔮 #XRP Analysis - Update 🚀🚀
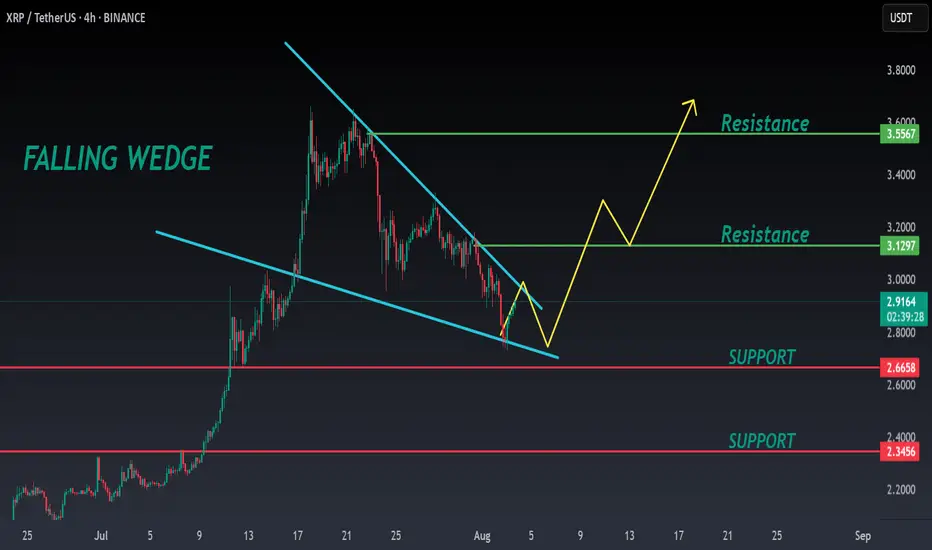
💲 We can see that there is a formation of Falling Wedge Wedge Pattern in #XRP and we can see a bullish movement after a good breakout. Before that we would see a little retest and and then a bullish movement.
💸Current Price -- $2.9130
📈Target Price -- $3.1290
⁉️ What to do?
- We have marked crucial levels in the chart . We can trade according to the chart and make some profits. 🚀💸
#XRP #Cryptocurrency #Breakout #DYOR
SAHARA ANALYSIS🔮 #SAHARA Analysis 💰💰
📊 #SAHARA is making perfect and huge rounding bottom pattern in daily time frame, indicating a potential bullish move. If #SAHARA retests little bit and breakout the pattern with high volume then we will get a bullish move📈
🔖 Current Price: $0.1043
⏳ Target Price: $0.1062 and above
⁉️ What to do?
- We have marked crucial levels in the chart . We can trade according to the chart and make some profits. 🚀💸
#SAHARA #Cryptocurrency #Pump #DYOR


#PENGU #PENGUUSDT #PENGUINS #LONG #AMD #PO3 #Analysis #Eddy#PENGU #PENGUUSDT #PENGUINS #LONG #AMD #PO3 #Setup #Analysis #Eddy
PENGUUSDT.P Scalping Long Setup
This Setup & Analysis is based on a combination of different styles, including the volume style with the ict style. (( AMD SETUP )) "PO3"
Based on your strategy and style, get the necessary confirmations for this scalping setup to enter the trade.
Don't forget risk and capital management.
The entry point are indicated on the chart along with their amounts.
The responsibility for the transaction is yours and I have no responsibility for not observing your risk and capital management.
Note: The price can go much higher than the specified target and have a very good pump.
Be successful and profitable.

PEAQ Network about to make another pea(q) ? Bottom can be IN!
// ==================================
// ====THE===========================
// ========MACHINE=============^^====
// ===============NEEDS===TALK=======
// ====================TO============
// ==================================
Is this the time?
Chart Recap
🔍 Pattern:
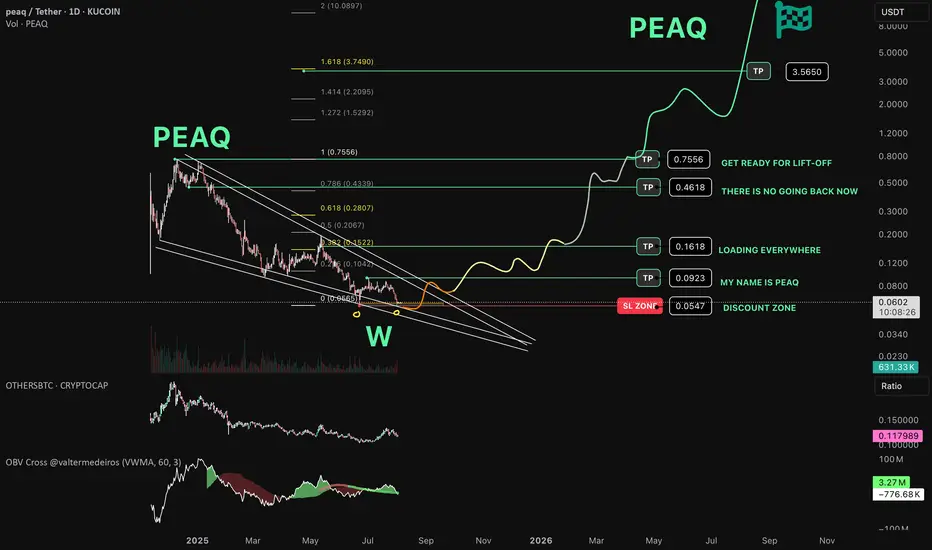
Price formed a falling wedge pattern, which typically signals a potential bullish reversal.
A large W-shaped double bottom pattern is highlighted at the wedge's base, adding strength to the bullish thesis. Can this be the awaited bottom?
🟢 Accumulation & Support Zone :
"DISCOUNT ZONE" is marked near $0.0547, aligned with the wedge support.
Repeated touches at this level suggest strong buyer interest — also called "MY NAME IS PEAQ" and "LOADING EVERYWHERE"
🚀 Bullish Scenario & Targets:
If the wedge breakout plays out:
TP1: $0.0923 – early target near the local range high.
TP2: $0.1618 – aligns with the 0.382 Fib level.
Labeled as “LOADING EVERYWHERE”
TP3: $0.4618 – near the 0.618 retracement.
“THERE IS NO GOING BACK NOW”
TP4: $0.7556 – previous swing high.
“GET READY FOR LIFT-OFF”
TP5: $3.5650 – long-term Fib extension target (1.618).
Ultimate moonshot-level target.

Continued recovery, positive after NFP news✍️ NOVA hello everyone, Let's comment on gold price next week from 08/04/2025 - 08/8/2025
⭐️GOLDEN INFORMATION:
Gold prices surged over 1.5% on Friday, climbing toward $3,350, as a weaker-than-expected U.S. Nonfarm Payrolls (NFP) report signaled a faster-than-anticipated slowdown in the labor market. Heightened geopolitical tensions between the U.S. and Russia further boosted safe-haven demand for the precious metal.
Following the disappointing July jobs data, markets began pricing in a potential interest rate cut by the Federal Reserve. While the Unemployment Rate held relatively steady, signs of labor market softness supported recent comments from Fed officials Michelle Bowman and Christopher Waller, who advocated for a 25-basis-point rate cut at the July 29–30 meeting.
Additional data added to the cautious sentiment: the ISM’s July report confirmed that U.S. manufacturing activity remains in contraction territory, while consumer confidence took a hit, according to the University of Michigan’s latest survey.
⭐️Personal comments NOVA:
Gold prices continue to be positively affected after last week's NFP news, market expectations of an early rate cut are rising
🔥 Technically:
Based on the resistance and support areas of the gold price according to the H4 frame, NOVA identifies the important key areas as follows:
Resistance: $3384, $3434
Support: $3331, $3307, $3268
🔥 NOTE:
Note: Nova wishes traders to manage their capital well
- take the number of lots that match your capital
- Takeprofit equal to 4-6% of capital account
- Stoplose equal to 2-3% of capital account
- The winner is the one who sticks with the market the longest

USDCHF Short term bullish?As dxy looks like it wants to run higher, USDCHF will likely also go higher for a short-term buying for a retracement to then continue its down trend. this pair looks good.

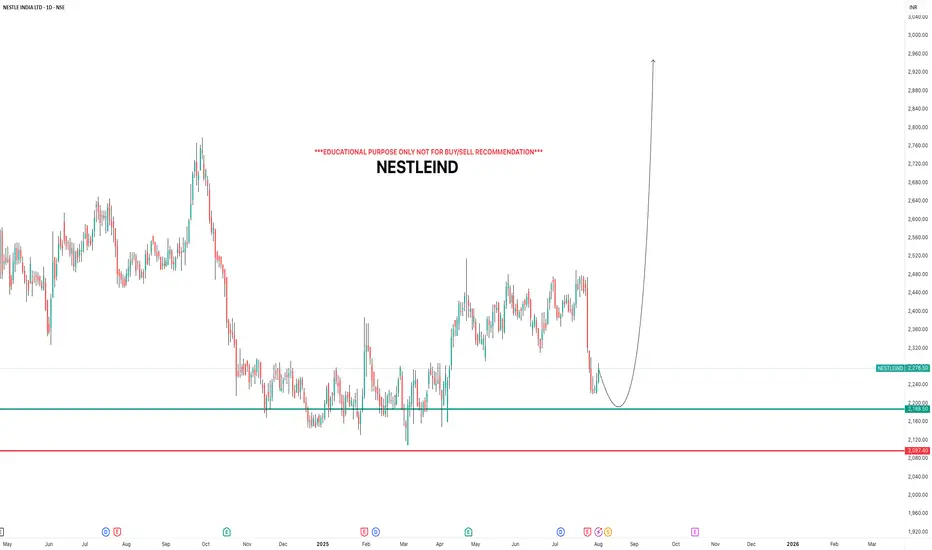
NESTLEINDIAi Observed these Levels based on Price Action and Demand & Supply which is my own Concept "PENDAM CONCEPTS"... Please don't take any trades based on this chart/post... Because this chart is for educational purpose only not for Buy or Sell Recommendation... Thank Q
Bitcoin: New All-Time High — What’s Next?Bitcoin had an incredible run, breaking the old all-time high ($111,980) with strong bullish momentum and setting a fresh ATH at $123,218 (Binance). We just witnessed the first major corrective move of ~6% and a decent bounce so far — but the big question is:
What’s next? Will Bitcoin break higher over the summer or form a trading range here?
Let’s dive into the technicals.
🧩 Higher Timeframe Structure
May–June Range:
BTC was stuck between $110K–$100K, forming an ABC corrective pattern. Using trend-based Fib extension (TBFE) from A–B–C:
✅ C wave completed at $98,922 (1.0 TBFE)
✅ Upside target hit at $122,137 (-1 TBFE)
Full Bull Market TBFE:
➡️ 1.0 → $107,301 → previously rejected
➡️ 1.272 → $123,158 → recent rejection zone
Pitchfork (log scale):
➡️ Tapped the upper resistance edge before rejecting.
Previous Bear Market Fib Extension:
➡️ 2.0 extension at $122,524 hit.
2018–2022 Cycle TBFE:
➡️ 1.618 at $122,011 tapped.
Macro Fibonacci Channel:
➡️ Connecting 2018 low ($3,782), 2021 ATH ($69K), 2022 low ($15,476) →
1.618–1.666 resistance band: $121K–$123.5K.
✅ Conclusion: Multiple fib confluences mark the $122K–$123K zone as critical resistance.
Daily Timeframe
➡️ FVG / Imbalance:
Big daily Fair Value Gap between the prior ATH and $115,222 swing low.
BTC broke the prior ATH (pATH) without retest → a pullback to this zone is likely.
Lower Timeframe / Short-Term Outlook
We likely saw a completed 5-wave impulse up → now correcting.
The -6% move was probably wave A, current bounce = wave B, next leg = wave C.
➡ Wave B short zone: $120K–$121K
➡ Wave C target (1.0 TBFE projection): ~$113,326
➡ Confluence at mid-FVG + nPOC
Trade Setups
🔴 Short Setup:
Entry: $120,300–$121,000
Stop: Above current ATH (~$123,300)
Target: $113,500
R:R ≈ 1:2.3
🟢 Long Setup:
Entry: Between Prior ATH and $113,000
Stop: Below anchored VWAP (~$110,500)
Target: Higher, depending on bounce confirmation.
🧠 Educational Insight: Why Fibs Matter at Market Extremes
When markets push into new all-time highs, most classic support/resistance levels disappear — there’s simply no historical price action to lean on. That’s where Fibonacci extensions, channels, and projections become powerful tools.
Here’s why:
➡ Fibonacci extensions (like the 1.272, 1.618, 2.0) help estimate where trend exhaustion or profit-taking zones may appear. They are based on the psychology of crowd behavior, as traders anchor expectations to proportional moves from previous swings.
➡ Trend-Based Fib Extensions (TBFE) project potential reversal or continuation zones using not just price levels, but also the symmetry of prior wave moves.
➡ Fibonacci channels align trend angles across multiple market cycles, giving macro context — like how the 2018 low, 2021 ATH, and 2022 low project the current 1.618–1.666 resistance zone.
In short:
When you don’t have left-hand price history, you lean on right-hand geometry.
That’s why the $122K–123K zone wasn’t just random — it’s a convergence of multiple fib levels, cycle projections, and technical structures across timeframes.
⚡ Final Thoughts
Bitcoin faces major resistance around $122K–$123K backed by multiple fib and structural levels. A retest of the prior ATH zone (~$112K–$113K) looks probable before the next big directional move. Watch lower timeframe structure for signs of completion in this corrective phase.
_________________________________
💬 If you found this helpful, drop a like and comment!
Want breakdowns of other charts? Leave your requests below.

USDJPY: Breaking Out With Macro Backing 🟢 USDJPY | Breakout Opportunity Above Resistance
Timeframe: 1H
Bias: Bullish
Type: Break and Retest
📊 Technical Setup
USDJPY is currently consolidating at a key 4H resistance zone (147.75–147.90). A clean breakout and retest of this area will confirm bullish continuation.
• Entry: Above 147.90 (after confirmed candle close + retest)
• SL: Below 147.30
• TP: 148.90 / 149.60
• RR: ~1:2.5
• Indicators: RSI showing strong upside momentum, holding above 50
🧠 Fundamentals + Macro Confluence
• USD Strength: Strong macro & delayed rate cuts support USD upside
• JPY Weakness: BOJ remains dovish; risk-on sentiment weighing on JPY
• COT + Conditional Score: USD score increased to 17, JPY dropped to 8
• Risk Sentiment: VIX at 14.2 = RISK ON → bearish JPY bias
🧭 Gameplan
“Wait for confirmation above resistance before entering”
🔔 Set alerts around 147.90 and monitor lower timeframes for retest and bullish candle structure.

Reddit breaks out for bullish run I have been watching Reddit for a couple of weeks and identified that we had put in the .786 low from the correction since February and then formed a range that was well respected for the past 4 months .
In this video I highlight zones where i expect price to gravitate too and where a nice entry will be if you are looking to long reddit.
Tools used Fib suite , trend based fib , tr pocket , 0.786 + 0.382 and fixed range .

New targets for Reddit RDDT In this video I recap the previous reddit analysis where we looked for the long which is playing out really well .
I also look at the current price action and simulate what I think could be a target for the stock moving forward using Fib expansion tools as well as levels below for price to draw back too.
Welcome any questions below the chart . Thanks for viewing

GBPJPY holds momentum, waiting for the final pushThe GBPJPY pair is moving sideways between 197.400 and 199.000, while maintaining its position inside the ascending price channel. Each pullback is quickly absorbed near the lower support, indicating that buying pressure is quietly building.
💡 Bullish factors supporting the trend:
– UK Services PMI beats expectations, strengthening economic outlook.
– BOJ maintains negative interest rates, weakening the JPY.
– Risk-on sentiment drives capital back into the GBP.
🎯 Suggested strategy:
Buy near 197.400 or on a breakout above 199.000.
Target: 201.500 | Stop-loss: below 196.800.

IPH 40% move coming?IPH has recently emerged from a descending wedge pattern, supported by bullish divergences in both the RSI and OBV, along with several divergences observed in shorter time frames. A pullback to the $5 level is anticipated, as the stock appears weaker on these smaller time frames. If IPH can maintain its position above the recent low of $4.40, it will indicate a structural shift, establishing higher highs and higher lows. My initial target is in the $6.50 range, followed by a potential move just above $7, representing a 40% increase. Good luck and happy trading 🍀
