TSLA: Uptrend channel bounce, trading between 50 and 200-day SMAHey guys/gals!
So we all know that Tesla took a massive drop last week. It fell about 14%, and was down even 3% after hours at one point. I think we can all agree this crash wasn't technicals driven - it was clearly headline impacted. This was a clear black swan even t, and even in my case, nothing like this has ever happened to me as a trader. It was unforeseeable, forced me to hedge overnight and I'm still having nightmares (lol). Definitely one to remember as I don't think something like this would happen with any other stock. Tesla is truly unique in this sense.
But looking at the bigger picture, the bounce that we experienced on Friday must've been technicals driven, and psychologically influenced, as I am almost certain that the crash was a massive overreaction. People woke up the next day and thought this was severely discounted over a couple social media tweets (I won't go into the politics of things).
As you see on the chart, Tesla may in a new upward channel. At first I figured this may be a bear flag, however due to the upcoming catalyst like the Robotaxi launch - this would likely only be a bear flag if prices crashes below the lower support trend line.
As long as price is within the channel, I'd say things are holding up. We'd likely see a jump towards the upper side of the channel - however it's important to note that $300 and £360 are major resistance points. Robotaxi launch and any future tweets will definitely move price, and I think those will be a factor in determining whether price goes up or crashes below the trend line.
Another thing to point out is that price is currently trading between the 50-day and 200-day moving averages. The 50-day SMA is acting as vital support, whereas the 200-day SMA is the resistance. If there is a break above the 200-day SMA, price will likely go higher. The opposite may happen if price crashes below the 50-day SMA.
Either way, headlines and technicals mentioned above will continue to influence price.
Note: not financial advice.
Longsetup

GBPUSD - Technical analysis 2HGood morning, traders, dear TradingView. It's Nika.
I want to share this trading idea, for a reason we have very important resistance level breakout!
I think the price of this pair will continue growing and will reach level 1.37097!
So some of you can just open long now, or wait and enter after a little correction.
Thank you.
Have a profitable day.

$INJ - Inverted head and shouldersCRYPTOCAP:INJ
BINANCE:INJUSDT.P
The price recently broke out from the inverted head and shoulders pattern; now, the price is going to retest the pattern's neckline.
If the price hits and bounces above the white line zone, or if the 4H candle hits and closes above the upper white line, it will be a good long opportunity.
TP: YELOW LINES
SL: 12.052 / 4H CC BELOW
NFA, DYOR
FOLLOW FOR MORE AND SHARE WITH YOUR COMMUNITY.
DON'T FORGET TO HIT THE BOOST BUTTON.

HYPE Precision Trading — Pattern, Patience, ProfitHYPE has shown strong performance since early April, maintaining a clear uptrend. Currently, the market is consolidating in a range between $30 and $40 and it’s setting up for something interesting. Let’s break it down and map the next high-probability trade setup.
Potential Gartley Harmonic Pattern Forming
A valid Gartley pattern may be developing, with point D potentially forming around the $29 level. This zone offers solid confluence for a high-probability long setup.
🟢 Long Setup – Gartley Harmonic Pattern Completion at around $29
Confluences around $29–$28.3:
0.786 Fib retracement of XA
Trend-based Fib Extension 1:1
Negative -0.618 Fib as take-profit level for prior short
Anchored VWAP (0.666 band multiplier) acting as dynamic support
200/233 EMA/SMA support on the 4H TF
FVG + liquidity pool resting just below $30
Setup Details:
Entry Zone: Trend-based Fib Extension 1:1 or laddered between $30–$28.3
Stop Loss: Below $27.5 (adjust depending on where point D forms)
Target: 0.618 of CD leg ≈ $34.4
R:R ≈ 1:3.5
🔴 Short Setup – look for rejection at $36
0.618 Fib retracement from previous move (ideal short entry)
Invalidation: Break above $38.2 (above point C)
Take Profit: $30-$29
R:R ≈ 1:3
🧠 Educational Insight:
Harmonic patterns offer precise entries and targets by aligning Fibonacci levels with market structure. When combined with tools like Anchored VWAP and liquidity analysis, they become powerful tools for swing trading.
Summary:
HYPE continues to respect structure beautifully, offering repeated swing setups in the 10%–20% range. With clear fib symmetry and predictable behaviour, it remains one of the more technically sound altcoins.
Stay patient. Wait for the pattern to complete. As always — don’t chase. Let the trade come to you.
_________________________________
If you found this helpful, leave a like and comment below! Got requests for the next technical analysis? Let me know.

APE/USDT"APE coin could potentially reach the current resistance level first, and then move toward the next targets. Let me know what you think!"

AUD/NZD - Weekly Time frame Analysis📌 Technical Breakdown:
✅ Liquidity Sweep just occurred below previous lows, clearing weak long positions — a classic reversal signal.
🔂 Price tapped into a major weekly demand zone around the 1.04150 – 1.05000 range.
🔁 Strong reaction after hitting the 71% Fibonacci retracement, showing institutional buying.
🧱 Previous imbalance has been filled; structure now favoring a bullish continuation.
📈 The target: Buy-side liquidity above 1.10200 where price previously reversed with imbalance.
📊 Volume confirmed by a spike post-sweep — buyers are stepping in.
🎯 High-Probability Trade Setup:
Entry Zone: 1.0500 – 1.0600
Stop Loss: Below 1.0390 (beneath liquidity zone and fib invalidation)
Take Profit Target: 1.1000 – 1.1050
Risk-to-Reward: ~1:4+ depending on entry confirmation
🔮 Expectation:
Price may form a higher low retest around 1.0600 before launching.
A confirmed break above the imbalance at 1.0830 would unlock clean momentum toward buy-side targets.
🧠 Final Note:
This is a classic demand + liquidity + fib reversal setup on the weekly — ideal for a mid-to-long-term swing position with fundamental and technical alignment. Confirmation from daily/4H time frames can optimize your entry timing.

GBP/JPY - 8H Analysis - High Probability SetupGBP/JPY 8H Analysis – High Probability Trade Setup
This chart shows a classic 5-wave bullish Elliott Wave structure, with price currently breaking out of the wave (4) consolidation.
🔍 Bias: Bullish breakout continuation (Wave 5 in progress)
📌 Key Confluences:
Wave (4) respected both demand zone and trendline support.
Price has now cleared the Swing Range resistance, turning structure bullish.
Supported by the Ichimoku cloud base and a rising trendline.
Strong bullish volume picking up — confirms breakout strength.
🎯 Trade Idea:
Buy GBP/JPY at 195.50–195.90
Stop Loss: Below 192.50 (under swing low and cloud)
Take Profit: 200.00 – 202.00 (1:2+ RR to wave (5) target)
⚠️ Risk Note: Wait for a candle close above 196.00 for added confirmation if cautious. Ideal for momentum continuation traders.
This setup offers a textbook Elliott Wave 5 opportunity, backed by structure, volume, and breakout confirmation — a clean bullish trade with strong technical backing.

Gold Update – Will Buyers Drive It to 3,485 USD?Great to see all traders again in today’s gold price discussion at the end of the trading session. LyngridTrading here!
Yesterday, gold dropped sharply, with the metal falling by 600 pips during the US session. However, by this morning, it quickly regained its upward momentum, supported by buying pressure around the 3,340 USD support zone.
Specifically, gold regained its momentum after the latest data on the US labor market was just released, showing that the number of initial state unemployment claims rose to 247,000 (seasonally adjusted) by the end of May 2025, according to the announcement from the U.S. Department of Labor. This figure is higher than expected, reflecting a weakening US labor market, which has increased expectations that the Fed will soon cut interest rates to support the economy.
From a technical perspective, as previously analyzed, gold holds a strong short-term technical advantage from the support zone around 3,340 USD. If buying pressure continues, there will be nothing stopping it from rising to 3,485 USD, in line with the idea scheduled at the same time yesterday.

XAUUSD: Bullish Structure Still Intact?Dear friends,
To begin this post, I want you to understand why I want to connect with the global TradingView community. Simply put, I want to share the value I have and listen to more perspectives from all of you. This helps build a stronger, more united community.
And what about you. What do you think of OANDA:XAUUSD hovering around 3,370 USD?
Let’s explore it together!
OANDA:XAUUSD is moving within a very clear ascending channel, with price action consistently respecting both the upper and lower boundaries. This indicates that the bullish structure is still being maintained and the buyers remain in control. The recent upward momentum further reinforces the belief that this trend could continue.
The price is currently approaching a key support zone, marked by the lower boundary of the channel and a previous demand area. If this zone holds, it could offer a strong re-entry opportunity for buyers. The projected bullish target is 3,485 USD, which aligns with the upper boundary of the channel and represents a reasonable upside objective. This is the area I will closely monitor to find a trend-following buy entry, as long as bullish momentum remains intact.
Of course, I do not dismiss the opposite scenario. Failure to hold this dynamic support may suggest that bullish momentum is weakening and could shift the short-term trend to neutral or bearish.
Let me know your thoughts or if you see it differently!

Maintain price increase, NF will help gold price above 3400⭐️GOLDEN INFORMATION:
He stated that U.S. and Chinese negotiators would soon convene at a yet-to-be-determined location, a development that lifted market sentiment and weighed on gold prices as risk appetite strengthened. This shift occurred despite underwhelming U.S. economic data, which further fueled expectations for a Federal Reserve rate cut later this year.
According to the U.S. Bureau of Labor Statistics, signs of labor market weakness emerged as jobless claims rose, signaling a potential cooling in employment conditions. Meanwhile, the U.S. Bureau of Economic Analysis reported a narrower trade deficit in April, largely attributed to a decline in front-loaded imports ahead of anticipated tariffs.
⭐️Personal comments NOVA:
anxiously awaiting NF news today, there is pressure to weaken the dollar, NF figures that investors are worried about continue to be negative for DXY
⭐️SET UP GOLD PRICE:
🔥SELL GOLD zone : 3449- 3451 SL 3456
TP1: $3436
TP2: $3420
TP3: $3405
🔥BUY GOLD zone: $3303- $3301 SL $3296
TP1: $3320
TP2: $3330
TP3: $3340
⭐️Technical analysis:
Based on technical indicators EMA 34, EMA89 and support resistance areas to set up a reasonable BUY order.
⭐️NOTE:
Note: Nova wishes traders to manage their capital well
- take the number of lots that match your capital
- Takeprofit equal to 4-6% of capital account
- Stoplose equal to 2-3% of capital account

Tesla Update Longs and shorts At the start of the video I recap my previous video and then bring us up to date with the present price action .
In this video I cover Tesla from the higher time frame and breakdown both a long term bullish scenario as well as a local bearish scenario .
Both of these scenarios present longs and short entries for day trade opportunities and swing positions .
Tools used Fibs , TR pocket , Volume profile , Pivots , and vwap .
Any questions ask in the comments
Safe trading and Good luck

Jindal stainless ltdJindal Stainless Ltd has been forming higher lows and has now broken through the key resistance level at 660. With this congestion breakout, the stock signals a continued bullish move, potentially heading towards the target of 740.
Please conduct your own technical analysis and apply proper risk management before taking any trade. This is solely my personal view.
#jsl #bestbreakout #uptrend #longteam

TESLA PRICE ACTION JUNE 5TH 2025Welcome to Tesla weekly &there is a news about Elon going against the bill from trump.
I will never buy their news as they are manipulating retailers.
I am buying & I have discussed all the important levels here,
If you have any doubts, feel free to leave your comments here.

NBIS : Long worth TryingNebius group stocks are technically strong.
The downtrend since November 9, 2021 has been broken and the price is trading above the 50 and 200-period moving averages.
When we draw a medium-term Fibonacci level, we can take the take profit point at 0.618 and the stop-loss point at 0.382.
This gives us a Risk/Reward Ratio of 3.00.
A small position size is ideal.
Risk/Reward Ratio : 3.00
Stop-Loss : 43.46
Take-Profit : 60.00

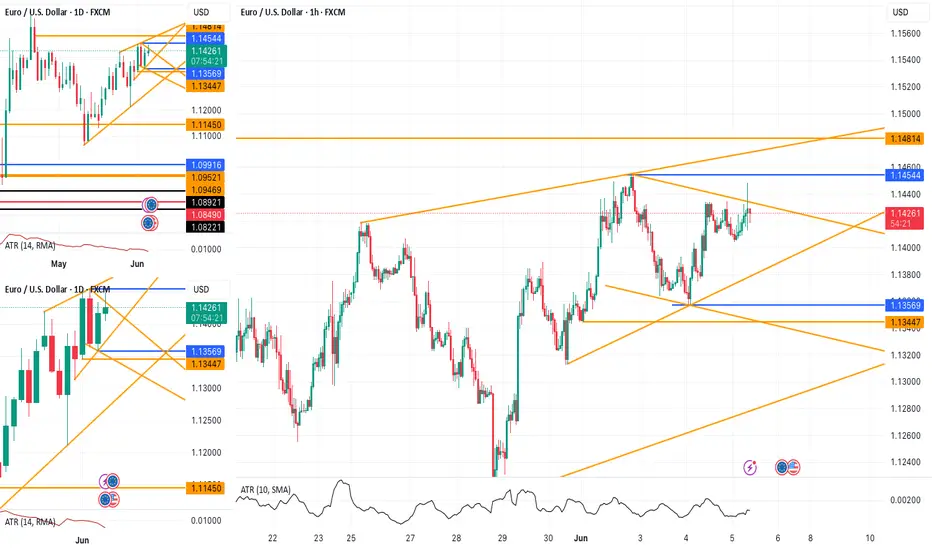
EURUSD Long Setup Above 1.14544 – Trendline in FocusFX:EURUSD is showing a potential long setup if price breaks above the 1.14544 level . The trade's potential is influenced by an ascending trendline around 1.14710 . If the market hesitates at this level, it may be wise to close the position or move the stop loss to breakeven .
US500 potential buyUS500 is setting up for a classic Wyckoff spring. This is a high probability set up with high risk to reward (5R+)
Here is what needs to happen
For situations 1 and 2,
a. price should break blue support (traps sellers and shakes out weak hands)
b. price should then close above any of the 2 blue supports with high volume
c. enter at the close of that bar or retest of the blue line
d. T.P @ recent high.
What do you think? how would you approach this better?

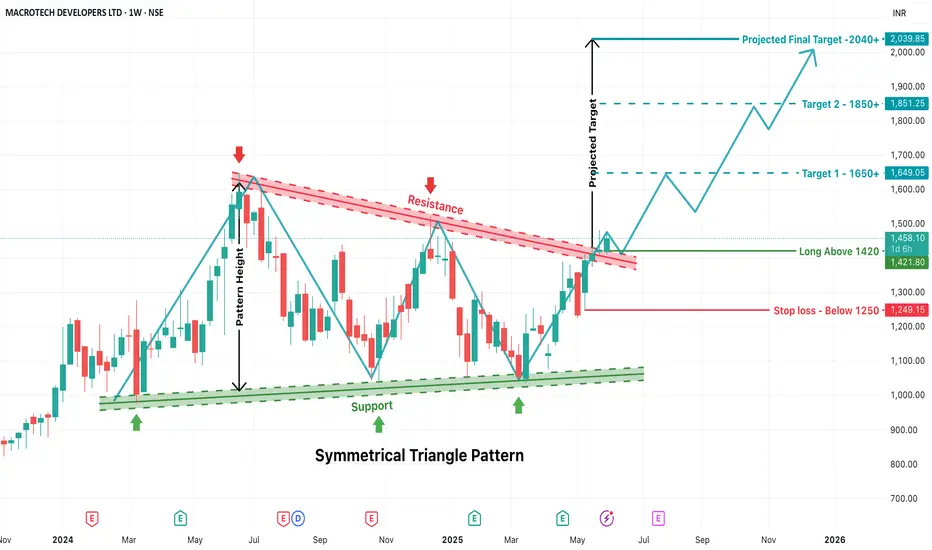
LODHA - Symmetrical Triangle Breakout Trade SetupAbout Pattern:
A Symmetrical Triangle Pattern is a continuation chart pattern formed when price action creates lower highs and higher lows, converging toward a point. It reflects indecision and compression in price before a breakout occurs. The breakout can be on either side, but here, a bullish breakout has occurred.
Support Line: Formed by connecting the swing lows (green arrows), which are gradually increasing.
Resistance Line: Formed by connecting the swing highs (red arrows), which are gradually decreasing.
This convergence of support and resistance forms the triangle.
Breakout Confirmation
Breakout Level: ₹1420
The stock has clearly broken out above the resistance trendline, indicating a strong bullish signal on the weekly timeframe.
Entry and Stop Loss Strategy
Entry Point: Enter the trade only above ₹1420 after confirmation of breakout. This acts as a psychological and technical barrier.
Stop Loss (SL): Set below ₹1250, which is well below the previous swing lows and triangle support. This acts as a safety net in case of a false breakout or reversal.
Target Calculation – Based on Pattern Height
Pattern Height:
Calculated from the highest swing high inside the triangle to the lowest swing low.
This vertical distance is then added to the breakout point (₹1420) to estimate the price targets.
Target 1: ₹1650+
This is the first resistance zone post-breakout and a psychologically important round number.
Target 2: ₹1850+
Based on the full extension of the pattern height and intermediate resistance zone.
Final Projected Target: ₹2040+
This is the complete projection of the triangle pattern height.
This setup is suitable for:
Swing traders looking for positional opportunities
Investors seeking breakout confirmation for fresh entries
Trend followers waiting for consolidation breakouts
Once price sustains above ₹1420, the stock is expected to follow a bullish trajectory toward ₹1650–2040+ over the coming weeks/months.
XAUUSD – Mild Pullback Before Breakout?Gold is currently experiencing a short-term pullback after U.S. jobless claims forecasts came in lower than previous levels. This suggests that the labor market remains resilient, reducing the likelihood of the Fed cutting interest rates soon. As a result, the U.S. dollar finds support, putting mild downward pressure on gold.
However, on the H4 chart, XAUUSD remains within a clearly defined ascending channel. The current dip may simply be a retest of the support zone around 3,356 — the intersection of the channel’s lower boundary and the 34 EMA. If this area holds firm, gold could rebound with the next target at 3,429.

[LONG IDEA] $BULL Falling Wedge - Reversal Any Day Now!!NASDAQ:BULL has been consolidating in a tight bearish range over the past few days. A potential long entry is at $10.47 with a stop loss at $9.00, offering a favorable risk-to-reward setup.
However, if the price closes below $9.50, consider switching bias and taking a short position.

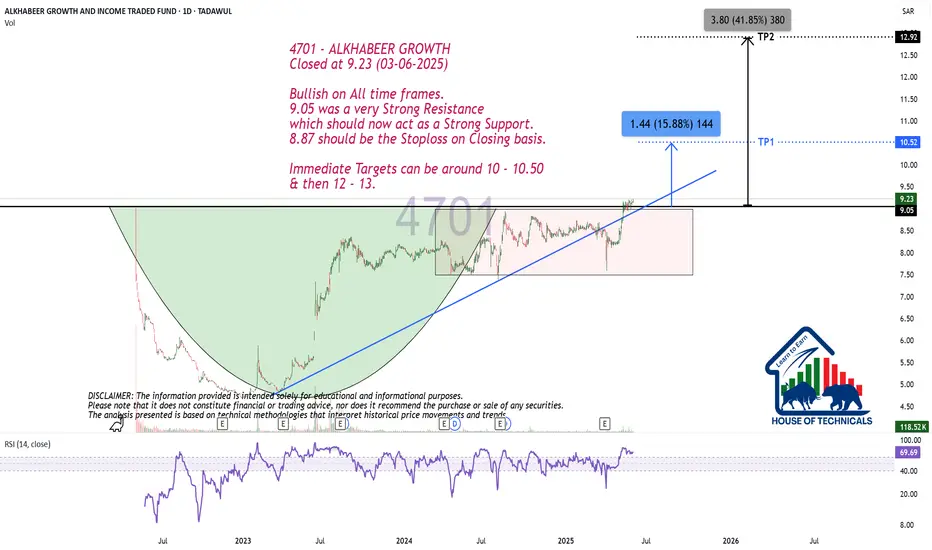
Bullish on All time frames.
Closed at 9.23 (03-06-2025)
Bullish on All time frames.
9.05 was a very Strong Resistance
which should now act as a Strong Support.
8.87 should be the Stoploss on Closing basis.
Immediate Targets can be around 10 - 10.50
& then 12 - 13.
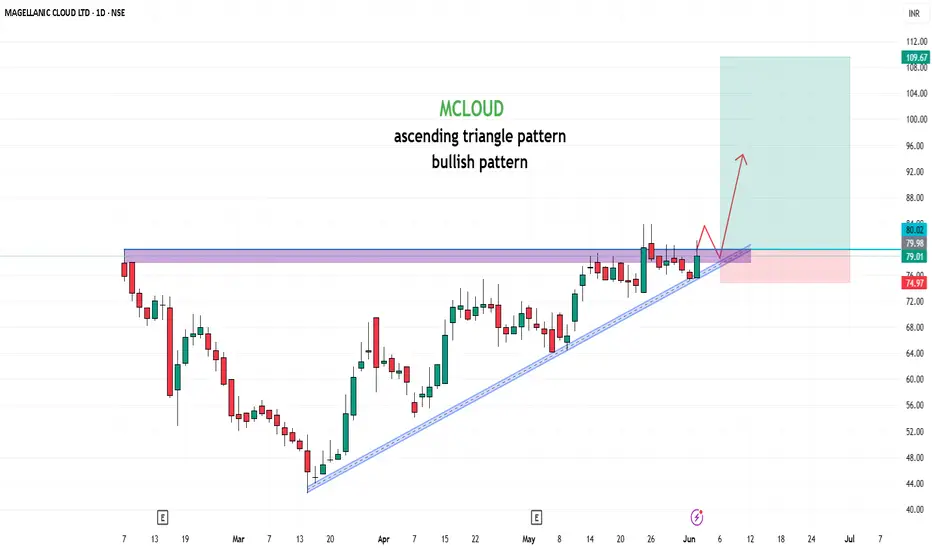
MCLOUD📊 Stock Analysis: MCLOUD
The stock has been consolidating within a ascending triangle pattern and is nearing a critical Buy Above level at ₹80 , signaling a potential breakout. The target is set at ₹179, offering a potential gain of 123.75%. Key insights:
Trend: A breakout above the wedge could indicate renewed bullish momentum.
Support Levels: Strong support around ₹75 , making this a low-risk entry point.
Volume Buzz: The recent increase in volume shows rising investor interest.
🔔 Keep an eye on this setup! Always analyze your risk tolerance before making any decisions.
📢 Disclaimer: This post is for educational purposes and not financial advice. Conduct your research or consult a financial advisor before investing.
What are your thoughts? Share them below! 📝
#StockTrading #TechnicalAnalysis #BreakoutTrading #MCLOUD
DOTUSDAlligator Strategy Buy Call
Risk Rewar TP 1 1:1 and T2 1:3
Open Two trades one for TP1 other for TP2.
For TP 2 make sure to move your SL to Entry point once price crosses TP1. So that you can ride Tp2 with zero loss.

RELIANCEi Observed these Levels based on Price Action and Demand & Supply which is my own Concept "PENDAM CONCEPTS"... Please don't take any trades based on this chart/post... Because this chart is for educational purpose only not for Buy or Sell Recommendation... Thank Q
