PLUG 1D Investment Long Aggressive Trend TradeAggressive Trend Trade
- short impulse
+ volumed TE / T1 level
+ support level
+ biggest volume 2Sp-
+ weak test
+ first buying bar close level
Calculated affordable stop limit
1 to 2 R/R take profit
Monthly Trend
"+ long impulse
+ support level
+ T2 level
+ biggest volume reaction bar
= below 1/2 correction"
Yearly CounterTrend
- short impulse
Longsetup

USDJPY – Supportive news, price may break resistance soonUSDJPY is supported by positive U.S. economic data, as the PCE index remains elevated—reinforcing expectations that the Fed will keep interest rates higher for longer. This has boosted bond yields and the USD, driving USDJPY upward.
On the H3 technical chart, USDJPY has rebounded from the support zone around 143.680. Both the EMA 34 and EMA 89 lie below the price, reinforcing the recovery momentum. The pair is now expected to approach the 146.000 resistance area—where it intersects with the long-term descending trendline that has rejected price at least twice before.
If buying pressure holds and 146.000 is decisively broken, a short-term bullish trend will likely be confirmed. However, another rejection could lead to a retest of the previous support zone. Overall, the current trend slightly favors the buyers.

EURUSD – Bullish trend at risk amid PCE and technical pressureEURUSD has just reached the 1.13860 resistance zone – a confluence with the previous peak and former supply area. A weak rebound and a rounding top pattern are gradually forming, indicating weakening buying momentum. The 34 and 89 EMAs on the H4 chart add further pressure from a technical perspective.
If the price continues to be rejected at 1.13860, it may drop toward 1.12670 – which aligns with the ascending trendline support. A break below this level would confirm a clearer bearish trend.
The upcoming Core PCE data is forecasted to rise – indicating inflation remains elevated. This raises the likelihood that the Fed will maintain high interest rates for longer, supporting the USD and weighing on EURUSD.

SOL/USDT"Solana, like the other two coins, is also poised for growth and is currently in the best possible position. What do you think, my friend? Do you think Solana can go up?

EUR/USD - BUY BUY BUY!Here in my personal Opinion I can see a few potential reasons to buy with high confidence.
Firstly- Weekly timeframe is showing a Bullish movement with us closing last week with a strong volume candle.
Secondly- On the Daily time frame we can see this is a high possibility of a 5th leg of elliots wave to finish this Bullish run.
Thirdly- The Daily has pushed out of the 71% level from the first demand zone. Following this on the 4H Time frame we can notice this previous push has also giving a strong Liqudity Grab into the new 71% level telling me Buyers are still highly in control.
I will be looking to trade into Buy side Liquidity after this Volume gap has been filled
Follow along for more updates

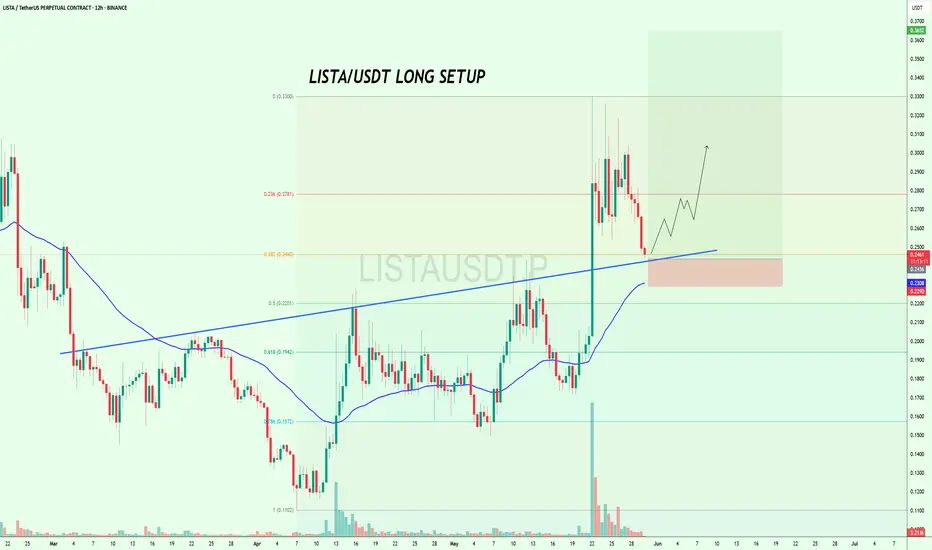
$LISTA at Key Support – Long Opportunity Loading?$LISTA looks good to long here with a short SL🚀
It is approaching a key confluence support zone right at the 0.382 Fib level (~0.2460), the rising trendline, and the 100EMA on the 12H chart.
This level held well in the last move and could once again act as the launchpad for a bullish breakout toward $0.30–$0.33.
But if it breaks below this support zone, short-term momentum could shift.
Watch how the price reacts here👀
BINANCE:LISTAUSDT
$BUSDT Ready to Explode? Breakout Could Send It Flying#BUSDT is demonstrating strong potential for a pennant breakout.
A successful breakout could trigger a +60% bullish rally in the coming days. 🚀
#Altseason2025

AADHARHFCi Observed these Levels based on Price Action and Demand & Supply which is my own Concept "PENDAM CONCEPTS"... Please don't take any trades based on this chart/post... Because this chart is for educational purpose only not for Buy or Sell Recommendation... Thank Q

BNB/USDT"Binance, like Ethereum, is in its best condition right now. Do you think it will go up or down?"

BTC breakout soon and return to ATH💎 Update Plan BTC (May 29)
Notable news about BTC:
The overall cryptocurrency market capitalization has remained relatively stable over the past 24 hours, hovering near the $3.42 trillion level. Digital assets appear largely indifferent to the recent rally in equities, as gains in traditional markets are driven by corporate earnings and tariff-related developments rather than shifts in monetary policy or liquidity conditions. Meanwhile, the US Dollar is strengthening for a third consecutive session, adding further pressure.
Bitcoin (BTC) has pulled back from the upper end of its recent trading range near $110,000, settling closer to the $107,000 mark. This pause near previous highs has helped ease short-term market overheating. As institutional participation in Bitcoin deepens, its price behavior is increasingly mirroring that of traditional financial instruments like equities and commodities—marked by more tempered momentum and fewer fear-driven surges.
Technical analysis angle
It is still a 107k bumper area that brings profits to Buyer. But the worrying thing here is that the vertices of BTC are lower.
We will have two scenarios for BTC:
) First within the next 1 week, the organizers still go in this flag model and gradually narrow towards the top. If the price line follows this model, it will be negative for BTC and investors
) Secondly: BTC price will breakout area 109k, the target will go straight to 113k-115k and lower boundary if Breakout area 107k will return to 102k-100k
🔥BTC 4H is currently in the adjustment phase, this time will cause a lot of traders, Future - Margin to lose money, this rhythm will last long
At this time, whether new or old, should spend more time to practice, load more knowledge about the PTKT, as well as find knowledge posts at the channel ..., to strengthen the solid foundation, as well as avoid losing money at this time offline
==> Comments for trend reference. Wishing investors successfully trading

BTCUSDT – Risk of trend break, bearish signs emergingBTCUSDT is trading right at the lower boundary of its ascending channel, around the 108,800 mark. After several bounces from this trendline, price action now appears to be stalling—indicating that buying pressure is weakening. If the price breaks below the 107,500–106,500 support zone (marked by the 34 EMA and recent swing low), the short-term uptrend could be invalidated.
A confirmed break below 106,500 could trigger a further correction toward the 89 EMA around 102,800.
On the news front: Latest data shows Bitcoin’s dominance is slightly decreasing as capital rotates back into altcoins. Additionally, market uncertainty surrounding the Fed's monetary policy outlook is making investors more cautious about riskier assets like crypto.

USDJPY – Rejected at 146.00, downside risk growsUSDJPY reacted strongly at the 146.00 resistance area – a level where price was previously rejected. After a sharp rally, the pair has turned lower and is now heading toward the 144.00 support zone, which aligns with the EMA 34–89 on the H3 chart.
The chart shows a small double top pattern forming around the recent highs. If USDJPY continues to struggle below 146.00 and breaks through the 144.00 support, a short-term downtrend may be confirmed, with the next target around 142.50.
On the news side: The Japanese Yen is gaining some ground again after the BOJ signaled readiness to adjust its easing policy if inflation consistently exceeds its target. Meanwhile, the USD is under pressure as expectations grow that the Fed may keep interest rates steady in the upcoming meeting, due to cooler consumer data.
Suggested strategy: Consider selling if bearish signals appear around the 145.80–146.00 area, with a short-term target at 144.00.

EURUSD – Technical rebound, but bearish pressure still loomsAfter a sharp drop to the support zone around 1.12255, EURUSD has made a mild recovery and is now retesting the 1.13360 resistance area – which aligns with both the 34 and 89 EMAs. This confluence zone could trigger renewed selling pressure if price fails to break above.
The 3-hour chart shows a zigzag-like recovery forming, but each new high is still lower than the previous one – indicating that the downtrend remains intact. If EURUSD continues to struggle at this resistance, it is likely to reverse and retest the 1.11910 support area.
On the news front, markets are awaiting CPI data from both the Eurozone and the U.S. this week. If U.S. inflation comes in higher than expected, the dollar may continue to strengthen – increasing short-term downside pressure on EURUSD.

NQM2025 outlook for the week ahead 05/19/2025Hello World.
for the week ahead i have a bullish bias im looking to target the bearish fvg created on mon 24 feb 2025 ( daily TF) i expect the fvg formed on tue 13may2025 (Daily TF) reject the price higher, if the bullish fvg didnt hold maybe we will se a drop to the V.I bellow.
i will give updates

XAUUSD – Weakening signals, growing risk of breakdownGold is trading around $3,273 after a clear drop from the $3,314 resistance zone. On the H8 chart, price has approached the long-term ascending trendline and is hovering near the EMA 89 – a very critical confluence area.
At the moment, price is forming a sideways pattern just above the trendline, but the recovery momentum remains weak. If gold breaks below this zone, the uptrend will officially be invalidated, and the next target could be the $3,135 technical support.
On the news front: The market is closely watching the upcoming U.S. Core PCE data this weekend. This is the Fed’s preferred inflation metric, and if the reading comes in stronger than expected, expectations of prolonged high interest rates could return – which would put significant pressure on gold.

Unity Software (U) – Strong Earnings and Bullish FlowsFundamental Overview
Unity Software has been consolidating within a defined range for approximately a year following a significant decline in its stock price. Despite previous challenges, the company has consistently surprised investors with its earnings over the past year, maintaining strong performance. Historically, Unity tends to perform well during the May–June period. Looking ahead, projections suggest a decline in net margin, though net income is expected to increase, reinforcing the company's strong execution.
Additionally, Unity has exceeded expectations for four consecutive earnings reports, underscoring its resilience and growth trajectory.
Technical Outlook
- Momentum & Price Action: The stock exhibits solid momentum and is currently situated in a buy zone.
- Options Flow: Bullish sentiment is evident in options activity, signaling strong institutional interest.
- Analyst Ratings:
- Needham analyst Bernie McTernan maintains a Buy rating but lowers the price target from $33 to $30.
- Barclays analyst Ross Sandler maintains an Equal-Weight rating and lowers the price target from $26 to $25.
Given the current trends, bullish options flows, and favorable seasonality, Unity Software appears poised to test $25 in the upcoming weeks, particularly if momentum continues to drive price action.

BSOFTi Observed these Levels based on Price Action and Demand & Supply which is my own Concept "PENDAM CONCEPTS"... Please don't take any trades based on this chart/post... Because this chart is for educational purpose only not for Buy or Sell Recommendation... Thank Q

TEXRAILi Observed these Levels based on Price Action and Demand & Supply which is my own Concept "PENDAM CONCEPTS"... Please don't take any trades based on this chart/post... Because this chart is for educational purpose only not for Buy or Sell Recommendation... Thank Q

S/L Moved to "3,291.00"I've now moved my stop loss (that was initially at "3,294.00") to "3,291.00" due to me seeking a close above a support area on the 1 Hour chart. OANDA:XAUUSD

PLUG 1H Long Swing Conservative Trend TradeConservative Trend Trade
+ long impulse
+ 1/2 correction
+ volume zone
- strong approach
+ ICE level
+ support level
+ volumed Sp
Calculated affordable stop limit
1 to 2 R/R take profit
Daily Trend
"- short impulse
+ volumed TE / T1 level
+ support level
+ biggest volume 2Sp-
+ weak test"
Monthly Trend
"+ long impulse
+ support level
+ T2 level
+ biggest volume reaction bar
= below 1/2 correction"
Yearly CounterTrend
- short impulse
Will add more after successful test on 1H and / or after test completes on 1D.

BTC ANALYSIS🔆#BTC Analysis : Channel Following ⛔️⛔️
As we can see that #BTC is following ascending channel on 4h time frame. We can see a bullish formation here. And if it trade with good volume then we can see a proper bullish move in #BTC
🔖 Current Price: $108700
⏳ Target Price: $115300
⁉️ What to do?
- Keep your eyes on the chart, observe trading volume and stay accustom to market moves.🚀💸
#BTC #Cryptocurrency #ChartPattern #DYOR

DOTUSD📊 30m Analysis – DOTUSD
Strategy: 🐊 Alligator Strategy
Trend: 📈 Strong Uptrend
📝 Trade Plan
🎯 Entry Point (EP): 4.603
🛡️ Stop Loss (SL): 4.530
💰 Take Profit 1 (TP1): 4.680
💰 Take Profit 1 (TP1):4.75
Risk Reward 1:1 TP1
Risk Reward 1:2 TP2

