ETH — Bull Flag or Trap? Trade Plan with TargetsETH is setting the stage for its next major move — and the chart is packed with clues.
After completing Wave 3 at $2738.50, ETH has entered a corrective phase, forming what looks like a bullish flag. But beneath the surface, smart money levels are aligning: VWAP, Fibs, key levels, and liquidity traps are all converging around one high-probability zone.
This analysis breaks down both the long and short setups, backed by real confluence and clean R:R opportunities. Whether you’re planning to snipe the reversal near support or fade the rally at resistance, you’ll walk away with a clear trade plan and deeper insight into how price reacts at precision levels.
Let’s get into it.
🟢 Bullish Scenario: Long Setup with Deep Confluence
After a fakeout pump into the golden pocket of this minor downtrend (typical for a Sunday), ETH rejected cleanly at the upper resistance of the bull flag channel.
We're now watching for the swing low at $2406.63 to be swept, setting up a potential SFP (Swing Failure Pattern) at a highly confluent support zone:
🔍 Confluence at the $2390–$2360 Zone:
Anchored VWAP from the Wave 3 origin at $1752 is sitting at $2390
Trend-Based Fib Extension 1:1 of the correction lands at $2386.84
Liquidity pool just under the recent swing low
0.382 Fib retracement of the entire Wave 3 at $2361.66
0.618 Fib Speed Resistance Fan intersects this zone
Lower bull flag support line also aligns
This makes the $2390–$2362 zone a high-probability bounce area.
📌 Plan:
Laddered long entries between $2390–$2362, watching closely for a clean SFP or reversal signal.
Target 1: $3000 psychological level
Target 2: 0.618 Fib retracement at $3067.71 (potential Wave 5 top)
Stop-loss: Below previous yearly open (can be tightened after confirmation)
R:R: 1:5 or better after SL adjustment
🔴 Bearish Scenario: Short Setup at Key Rejection Zone
If ETH makes a move up to complete the 5th wave, we monitor $3067.71 — the 0.618 retracement of the entire corrective leg — as a key resistance.
If price rejects here with momentum loss or bearish structure:
📌 Plan:
Short on confirmed rejection of $3067.71
Stop-loss: Above $3211 (above 0.666 Fib)
Target: Previous high near $2700 or lower
R:R: 1:2 or better depending on entry and structure
🧠 Educational Insight: Why Confluence Increases Probability
Many traders chase setups based on single indicators. Real edge comes from stacking independent tools: VWAPs, Fibs, FVGs etc... When they align, the setup isn’t random — it’s high conviction.
This strategy gives you a framework to anticipate where price is likely to move and why, rather than reacting emotionally.
Patience and preparation will always outperform panic and reaction. Trade the plan — not the impulse.
___________________________________
If you found this helpful, leave a like and comment below! Got requests for the next technical analysis? Let me know.
Longsetup

HBAR Masterclass: Fib Precision + ConfluenceHBAR has been a dream to chart lately — beautifully technical, clean reactions, and a strong respect for structure. When a chart follows fibs this precisely, charting becomes fun — like solving a puzzle that pays. You stop forcing trades and start enjoying the process.
Let’s break down where the next high-probability trade setup lies — and why.
Elliott Wave Context
HBAR recently completed a 5-wave impulse structure and is now unfolding a ABC correction:
✅ Wave A: Broke below Wave 4's low
✅ Wave B: Rejected cleanly at the 0.618 retracement of Wave A
🔄 Wave C: Currently unfolding, with price structure hinting at a Head & Shoulders forming to the downside
Interestingly, HBAR has been bouncing between golden ratios like a Fibonacci pinball machine. — reinforcing how well this asset respects technical structure.
🟢 Long Opportunity: The Golden Pocket Zone
By pulling Fibonacci retracement from the entire 5-wave leg (from $0.16941 to $0.22885), we uncover the golden pocket:
0.618 Fib → $0.19212
0.666 Fib → $0.18926
But what really strengthens this zone is the confluence:
📍 21-Day EMA → $0.19361
📍 21-Day SMA → $0.19229
📍 Anchored VWAP from the $0.15396 low → ~$0.19135
📍 4/1 Gann Fan support (if reached between May 15–17)
Together, they form a tight support band between:
🎯 $0.195 – $0.18926
📐 How We Projected the 1.618 Target
Here’s where the magic of planning comes in.
If Wave C finishes within this golden pocket, we can anticipate the next move by applying a trend-based Fibonacci extension. This gives us a realistic projection for the next impulsive move:
📈 1.618 extension lands at → $0.28654
This level also aligns with the yearly level and previous key high — forming an ideal final target
📘 Educational Insight: Why Golden Pockets Matter
In trading, the “golden pocket” — the 0.618-0.666 Fibonacci retracement zone — is often where high-probability reversals take place. It’s a zone where buyers (or sellers) return with conviction after a correction. When this area also aligns with EMAs, anchored VWAPs, Gann levels etc. and previous structure, it becomes more than just a level — it becomes a decision zone.
This is where confluence transforms a trade idea into a trade setup.
🟢 Long Trade Setup:
Entry: Laddered between $0.195 – $0.18926
Stop-Loss: Below $0.185
Take-Profit: $0.28654
R:R: ~10:1
Potential Gain: ~+50%
🔴 Short Setup (If Rejected at Extension):
If price hits $0.28654 and shows exhaustion or bearish reversal patterns (SFP, engulfing candle, volume spike), a short could be considered:
Entry: ~$0.286
Stop-Loss: $0.2967 (better above $0.3)
Target: $0.2622
R:R: ~2:1
HBAR is giving us a textbook case of structure, rhythm, and precision. Whether it’s the golden pocket, the 1.618 extension, or the alignment of multiple tools — this is how clean setups are built.
Set your alerts. Trust the plan. Let the chart come to you.
In trading, silence is a skill — knowing when not to act is as powerful as knowing when to strike.
____________________________________
If you found this helpful, leave a like and comment below! Got requests for the next technical analysis? Let me know.

NEAR’s Pullback Zone Found — Is $4 Next?NEAR just pulled off a +50% rally from the 0.618 Fibonacci retracement at $2.224 — a strong show of force from the bulls. After that explosive move, price is now cooling off in a consolidation phase, preparing for the next leg higher.
🟢 Long Setup — Dip Before Lift?
The next high-probability long zone lies between:
$3.026 – $2.94
Possible but less likely of a deeper dip to $2.78 (0.5 Fib of the recent move)
Long entries can be laddered between $3.00 and $2.90 (even $2.80 if volatility kicks in).
Stop-Loss: Below the daily 21 EMA ($2.7344) and 21 SMA ($2.6739)
Target: $4.00
R:R: ~4:1 — clean and structured
This setup aligns with standard continuation behaviour after strong impulses — consolidation, retrace, and resume.
🔴 Short Setup (on Rejection at $4.00)
Entry: ~$4.00
Stop-Loss: Above $4.25
Target: Yearly open (~$3.65)
R:R: ~1.5:1 — not ideal, but valid on confirmation
🎯 Summary
NEAR is consolidating after a strong move — either ready to continue higher or retest deeper into Fib support
Long zone: $3.00–$2.90 (poss. $2.80)
Short zone: $4.00 (on rejection only)
Simple structure, clean risk, and nothing forced — exactly how it should be.
Sometimes, less is more. Let price show the next move. Stay ready. 📈
___________________________________
If you found this helpful, leave a like and comment below! Got requests for the next technical analysis? Let me know.

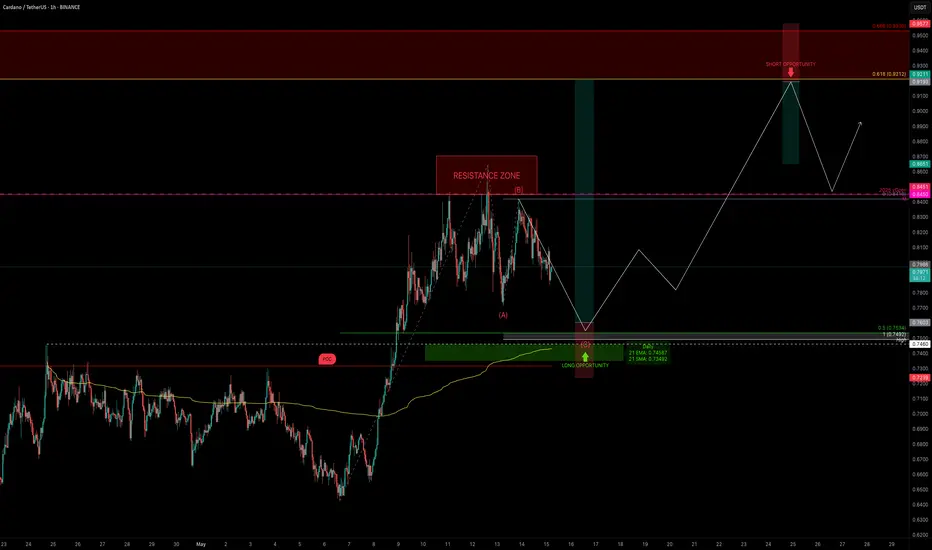
ADA Correction Nearing Completion — Trade It Like a ProADA is respecting structure beautifully and currently consolidating after completing a 5-wave impulse move. The key question now is: where are the next high-probability trade setups?
Let’s break it down step by step.
Market Structure & Elliott Context
ADA has completed a full 5-wave bullish sequence, and—as expected—is now in a correction phase. This appears to be forming a classic ABC correction.
Using the Fibonacci retracement tool:
0.5 retracement of the entire move sits at → $0.7534
This aligns perfectly with the previous swing high at $0.746 — a level that has yet to be retested
The 1:1 trend-based Fib extension of a potential ABC correction puts Wave C at → $0.7492
Confluence Check:
This entire support zone (~$0.75) is stacked with technical alignment:
✅ Previous swing high: $0.746
✅ 0.5 Fib retracement: $0.7534
✅ 1:1 extension: $0.7492
✅ Daily 21 EMA: $0.7455
✅ Daily 21 SMA: $0.7347
✅ Point of Control (POC): ~$0.7318
✅ Anchored VWAP: Also sitting in this zone
✅ Pitchfork golden pocket: Aligns as dynamic support
All of these support indicators point to one thing: this ~$0.75 zone is a high-probability long entry area.
🟢 Long Setup
Entry zone: Ladder between $0.77 – $0.75
Average entry: ~$0.76
Stop-loss: Below $0.7318 (under POC)
Target: $0.9212 (0.618 retracement of the recent down wave)
R:R: ~5:1
Potential upside: +22%
🔴 Short Setup (on Rejection Only)
Entry: $0.9212 (0.618 Fib retracement of downtrend)
Stop-loss: Above 0.666 Fib → ~$0.958
Target: previous swing high or yearly open
R:R: ~1.4:1 (it can be adjusted tighter upon confirmation)
This short setup isn’t ideal in terms of R:R unless we see clear rejection. But with confirmation — like an SFP, bearish engulfing, or divergence — the stop can be tightened, making the risk-to-reward much more favourable.
📘 Educational Insight: Why Structure Beats Emotion
In trading, the strongest setups occur where multiple tools converge—Fib levels, EMAs, VWAP, volume zones, and past price action. When these align, it’s not about guessing—it’s about preparing.
The key is to wait for structure to come to you, not the other way around. Patience allows clarity. Clarity allows precision. And precision pays.
💡 Final Thoughts
The plan is clear. Levels are set. Now it’s just observation and discipline.
Good trades don’t chase attention — they present themselves to those who wait.
___________________________________
If you found this helpful, leave a like and comment below! Got requests for the next technical analysis? Let me know.
PEAQ — Fibonacci Meets Wyckoff Structure +100% SetupAfter more than 70 days of sideways action, PEAQ is finally showing signs of life — with a well-defined structure that suggests accumulation is giving way to a potential new trend.
What we’re seeing aligns closely with a classic Wyckoff Accumulation pattern. A local bottom formed around the psychological $0.10 level, followed by a clean breakout — marking a potential Sign of Strength (SOS).
Now comes the real opportunity.
Wyckoff Accumulation Structure
Following the long consolidation range:
🔹 Phase D: Breakout from range = Sign of Strength (SOS)
🔄 Current: Pullback = potential Last Point of Support (LPS)
The recent correction has now retraced into the 0.786 Fib zone of the impulse wave — a deeper but still healthy retracement for Wyckoff structure. Notably, this level also coincides with the previous highs that PEAQ broke out from, now flipping into support. A perfect test of demand.
🔍 Confluence Zone Breakdown
0.786 Fibonacci retracement: ~$0.1312
Previous highs: ~$0.14
Monthly open: $0.1289 (ideal invalidation level)
These overlapping signals create a tightly packed support zone that defines the next high-probability long setup.
🟢 Long Setup — 0.786 ($0.1312)
Entry: $0.1312
Same stop-loss: $0.125 (below mOpen)
Targets: $0.2589 and 1.618 Trend-Based Fib Extension target at $0.2694
R:R: ~16:1+
Potential upside: +100%+
📘 Educational Insight: Wyckoff Meets Fibonacci
This setup is a combination of Wyckoff theory and Fibonacci structure:
SOS breakout signals strength
LPS pullback into 0.786 Fib = high-probability continuation zone
Previous highs now acting as support
When structure, confluence, and psychology align — you don't chase. You wait.
📌 Summary
✅ 70+ days of accumulation
✅ SOS confirmed
🔁 Now retracing to LPS around $0.131
🔒 Monthly open provides clear invalidation
🎯 Targets: $0.2589 and $0.2694
💰 Potential R:R: 16:1+
Each chart is a lesson. Read it with patience, trade it with purpose.
___________________________________
If you found this helpful, leave a like and comment below! Got requests for the next technical analysis? Let me know.

XRP Correction Complete? — Long Setup Aligned with Fib & OBXRP has completed a 5-wave impulse move. As expected, XRP is now in a corrective phase, pulling back after rejecting from a key resistance — and it’s doing so with technical precision.
The question now: where is the next high-probability long setup? Let’s break it down.
🧠 Market Structure & Key Zones
Using Fibonacci retracement from the base of the 5-wave impulse, we now have a potential golden pocket target aligned with major confluence.
🔽 Support Zone
🔹 0.618 Fib retracement: $2.2982
🔹 Daily Bullish Order Block: $2.2949
🔹 Daily 21 EMA: $2.329
🔹 Daily 21 SMA: $2.301
🔹 Liquidity pool
🔹 0.786 Fib Speed Fan (only if price drops between May 17–18)
This creates a high-confluence support cluster at ~$2.3 — a prime candidate for a long re-entry.
🟢 Long Trade Setup
Entry: Ladder between $2.32 and $2.28
Stop-loss: ~$2.21
Target: $2.7175 (0.618 Fib retracement of the corrective downtrend)
R:R: ~5:1
🔴 Short Setup (Conditional)
Trigger: Rejection at $2.7175
Entry: ~$2.7175
Stop-loss: Above $2.8033 (0.666 Fib) → set at ~$2.811
Take Profit: ~$2.56 or lower
R:R: ~2:1+ (dependent on entry confirmation and PA behaviour)
Shorts only valid if a clear rejection or SFP pattern emerges. If momentum is strong, this level may break — so wait for structure to confirm.
📘 Educational Insight: Why Confluence Matters
Too often, traders chase single-indicator signals. But real edge comes from confluence — when multiple tools (Fibs, MAs, Order Blocks, Liquidity, VWAPs, FVG, Speed Fans etc.) agree on the same zone. This alignment not only increases confidence in your entry, but also sharpens your risk management.
Think of it as building a case — the more aligned evidence you have, the stronger your trade thesis becomes.
📌 Summary
XRP is in a corrective phase after a 5-wave impulse
Clean rejection from weekly resistance → continuation of bearish trend
Long zone: ~$2.3
SL: ~$2.21 | TP: $2.7175 | R:R ~5:1
Optional short: $2.7175 rejection → SL $2.811 | TP $2.56
Precision isn’t about predicting — it’s about being ready when the chart speaks with clarity. Patience makes probability powerful.
___________________________________
If you found this helpful, leave a like and comment below! Got requests for the next technical analysis? Let me know.

BTCUSDT – Mild Pullback, Support Holds FirmBTCUSDT remains in a clear uptrend with a structure of higher highs and higher lows, after breaking out of a prolonged consolidation pattern since early May.
The price has surged from the 106,000 resistance zone and approached the technical target around 112,000 – an area that is currently triggering a slight pullback.
At the moment, the support zone around 106,700–107,800 aligns with a demand area and the EMA34, likely serving as a springboard for the next upward move.
If BTC continues to consolidate around this zone without breaking below 106,700, the 112,000 level could be breached, paving the way for a move toward higher targets.

GBPUSD – False Breakout Alert at Channel TopOn the D1 timeframe, GBPUSD continues to maintain a clear bullish structure within an ascending price channel, with steadily rising highs and lows.
Currently, price is approaching the resistance zone near 1.35919 — which is the upper boundary of the channel and also a zone that previously saw strong reactions. As illustrated in the chart, a likely scenario is a false breakout above this zone, followed by a pullback towards the support area at 1.33270–1.32500 to retest the EMA34 region.
If this support holds, price could bounce back in line with the upward channel structure, opening the door to the next target zone.

VIRTUAL TA Masterclass — Elliott Wave Meets Gartley HarmonicVIRTUAL has been on fire! Printing a clean 5-wave Elliott impulse with a +431% run in just 33 days. But after every strong trend comes a healthy correction, and that’s where we likely are now. Trading below key resistance and showing signs of exhaustion. The question: Where is the next high probability trade setup?
Let’s break down what the chart is telling us.
🧠 Structure Overview
Wave 5 peaked at $2.2169
Wave A dropped -25%
Wave B bounced +30%
Currently: VIRTUAL's trading under the $2 psychological level and weekly open ($2.0358) → signs of momentum cooling
A corrective Wave C is likely underway, and all signs point toward a very specific zone.
⚠️ Liquidity Dynamics
The longer VIRTUAL grinds sideways near $2.00 without showing real momentum, the more vulnerable late long positions become:
Retail traders are buying resistance
SLs are likely clustered just below Wave A’s low
This creates a liquidity pocket waiting to be swept — perfect fuel for Wave C
🔍 The $1.58–$1.47 Support Cluster: 14 Layers of Confluence
This zone isn’t guesswork — it’s loaded with technical overlap:
1️⃣ 1:1 Trend-Based Fib Extension of Wave A → $1.573
2️⃣ Monthly Open → $1.5354
3️⃣ 0.382 Fib Retracement of the entire rally → $1.5295
4️⃣ Bullish Fair Value Gap → $1.57–$1.53
5️⃣ Anchored VWAP from ATH → ~$1.46
6️⃣ Anchored VWAP from Wave 3 → ~$1.46
7️⃣ 0.618 Fib Speed Fan Support (~end of May timing)
8️⃣ 4H 233 SMA → ~$1.52
9️⃣ 4H 200 EMA → ~$1.52
🔟 Daily 200 SMA → $1.5251
1️⃣1️⃣ Weekly 21 SMA → $1.462 (reinforces the VWAP zone)
1️⃣2️⃣ Declining Daily Volume → momentum weakening
1️⃣3️⃣ Liquidity Pool below Wave A → likely to be swept
1️⃣4️⃣ $2 = Golden Pocket Resistance + Psychological Barrier
🔴 Short Trade Setup (Active as Long as SFP Holds)
For those favouring downside continuation toward the Wave C target, a short setup is in play:
Entry: Weekly open retest around $2.0358
Stop-loss: Above SFP high at $2.143
Target: 1:1 Trend-Based Fib Extension of Wave A → $1.573 or the Swing Low of Wave A at $1.647
R:R ≈ 1:4 — a solid, well-structured short opportunity
As long as price remains below the SFP and the $2.00 golden pocket resistance, bears maintain control.
🟢 Long Trade Setup
Entry: Ladder between $1.58–$1.47
Avg. Entry: ~$1.53
SL: Below $1.40
TP1: $1.88 (local resistance) → R:R ≈ 1:2.5
TP2: $3.33 (0.618 Fib of entire bear market) → R:R ≈ 1:12
👉 Bonus TP for Harmonic Setup: 0.618 Fib of CD leg
✨ Bonus Confluence: Potential bullish Gartley Harmonic in Play
VIRTUAL is also forming a valid Gartley harmonic pattern — one of the most reliable reversal setups in classical trading theory.
🔸 XA: B retraced to 0.602 → ✅ (criterion: ~0.618)
🔸 AB: C retraced 0.87 → ✅ (valid range: 0.382–0.886)
🔸 CD: Projected to complete at 0.786 of XA → ~$1.474
• CD is a 1.356 expansion of BC
• AB ≈ CD symmetry is valid
• TP = 0.618 retracement of CD leg
This adds even more weight to the $1.47–$1.53 buy zone.
📘 Educational Takeaway
The best setups don’t rely on one method — they align multiple disciplines. Here, we have Elliott Waves, Fibonacci retracements, anchored VWAPs, volume structure, moving averages, time symmetry, and now a harmonic pattern — all pointing to the same opportunity. Most traders never wait for alignment. That’s why most lose.
💬 Final Words
✍️ Smart trading isn’t about always being in a trade — it’s about being in the right one at the right time.
While others FOMO at $2, you wait for the right opportunity to come to you — where structure, liquidity, and probability all shake hands.
The patient are rewarded. Always.
___________________________________
If you found this helpful, leave a like and comment below! Got requests for the next technical analysis? Let me know.

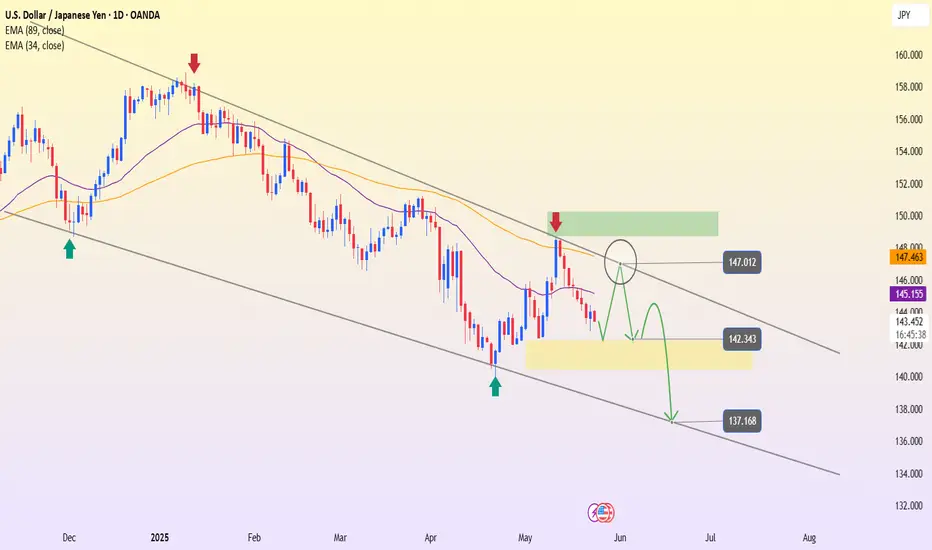
USDJPY – The downtrend continues, channel still leads the wayLooking at the D1 chart, USDJPY remains firmly within the descending channel that has persisted since the end of 2024. Every time the price approaches the upper boundary of the channel, selling pressure reappears – and the recent touch around the 147.012 area is no exception.
After being rejected at this strong resistance zone, the price has turned lower and is now forming a pullback structure within the prevailing trend. EMA34 and EMA89 continue to slope downward, reinforcing the bearish momentum.
If the price gets rejected again around the 145–146 region, the correction pattern may complete, opening up room for a drop toward the support zone at 142.343, or even deeper toward the channel bottom near 137.168.
In summary, the primary trend remains bearish – and the preferred strategy now is "sell on rally" when the price nears the upper resistance of the channel. Patience and watching for price action will be key.
EURUSD – Consolidation below trendline hints at breakout aheadHello traders! EURUSD is currently forming a rather interesting consolidation pattern right below the descending trendline – a level that has rejected price twice in the past.
After a mild pullback from the 1.1382 zone, price has quickly recovered and is now hovering around the EMA34 and EMA89. This is an important confluence area and is acting as short-term support around 1.1263.
If EURUSD continues to hold above this support and forms sideways accumulation, the probability of a trendline breakout will increase. In that case, the next target will likely be the previous high at 1.1382.
U.S. bond yields are fluctuating sharply, and geopolitical tensions – such as trade uncertainty or regional instability – may serve as catalysts that support the euro.
Keep an eye on the breakout zone – if price breaks out decisively, it could be a strong confirmation of a new bullish trend!

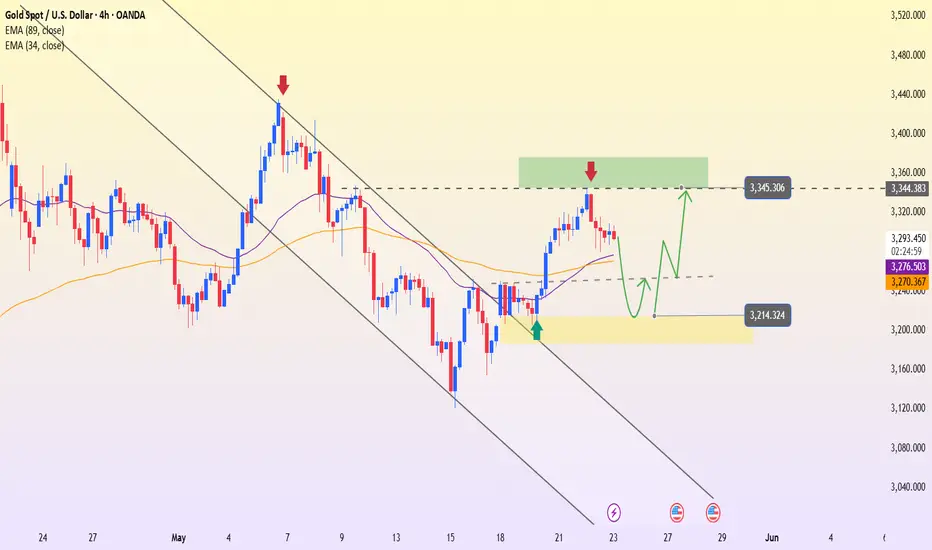
After a sudden drop, is gold "loading up" for a breakout?Hey everyone! At the start of today’s Asian session, gold is moving sideways around the $3,300 level, following yesterday’s sharp swing. Looking back, the price had climbed for three consecutive sessions earlier this week, then suddenly spiked to a two-week high of $3,345 during the Asian session on Thursday—only to quickly drop and close near $3,294.
This sharp reversal reflects the ongoing tug-of-war between a strengthening US dollar, volatile US bond yields, and unstable geopolitical factors. However, on the 4H chart, the bullish structure still holds, with price currently retesting the support zone around the EMA34.
Key price scenarios to watch:
If the support area around $3,214 holds → gold could bounce back toward the $3,345 region.
On the other hand, if $3,214 breaks → the bullish scenario will be temporarily invalidated and gold might revisit a deeper accumulation zone.
Right now, watching the price reaction around yesterday’s low is crucial—this could be the key to catching the next wave.
$MAGIC Loading Up for a Breakout After 32 Days of Silence!OMXTSE:MAGIC has been forming this symmetrical triangle pattern for over 32 days, that's more than a month of consolidation!
Price is squeezing tighter inside the range, and a breakout is getting closer.
If it breaks above the upper trendline with volume, we could see a move toward $0.22–$0.28 🚀
This setup is worth watching closely, long consolidation often leads to strong moves.
Retweet if you're bullish !!
#MAGIC #Alts

#ChillGuy Breakout Confirmed – Long Setup Active!#ChillGuy has broken out of a symmetrical triangle and is currently holding above horizontal support in the short term, which looks strong !
We can consider a long position at the current market price (CMP) with a stop-loss at $0.0857.
If the market plays out as expected, we could see a solid move from here.
DYOR, NFA

$BRETT Bull Flag breakout Done!!$BRETT Bull Flag breakout Done ✅
Looks ready to take off anytime.
I bought it at CMP with SL $0.07083
DYOR, NFA
BYBIT:BRETTUSDT PYTH:BRETTUSD

$SNOW $200 target, sooner than laterHello. Not much analysis here besides a monster gut feeling. NYSE:SNOW has earnings May 21. I’m looking to get in $200c for May 16 expiration. For some reason this name can’t scorch $200 and I believe it should. If NASDAQ:CRWD moves the way it does so can $SNOW. I think it’s made a strong support and mental level at $150. I was apart of the latest push to $180-$190 before its most recent earnings which jolted it from $150s to $180 AND it got sent back to that $150 to $160 level. I think this is a high conviction swing especially into earnings; premiums can go up off the IV.
NFA.
WSL.

New BTC ATH, National FOMO💎 Update Plan BTC (May 22)
Notable news about BTC:
Gold prices climbed over 0.50% on renewed safe-haven demand, holding firm above the $3,300 threshold as investor anxiety grows ahead of the U.S. tax bill vote and mounting geopolitical tensions in the Middle East. At the time of writing, XAU/USD trades around $3,317, rebounding from an intraday low of $3,285.
Sentiment remains fragile, with U.S. equity markets slipping into negative territory and Treasury yields ticking higher. All eyes are on the impending vote on President Trump’s tax reform proposal, which the Congressional Budget Office (CBO) estimates could inflate the national debt by approximately $3.8 trillion. Uncertainty around the fiscal outlook continues to fuel demand for gold as a defensive asset.
Technical analysis angle
The question that investors most interested now is when BTC will have 120k?
After the breakdown of channel structure increases around the 108k area, the 113k landmark is the most expected milestone before the price approaches 120k
We still expect a slight adjustment to 108k to continue Long and Target are still 113k and 120k
🔥BTC 4H is currently in the adjustment phase, this time will cause a lot of traders, Future - Margin to lose money, this beat will last until 23-25/5
At this time, whether new or old, should spend more time to practice, load more knowledge about the PTKT, as well as find knowledge posts at the channel ..., to strengthen the solid foundation, as well as avoid losing money at this time offline
==> Comments for trend reference. Wishing investors successfully trading

SUI — Breakout or Breakdown? Long & Short SetupsSUI has been trapped in a trading range for the past 6 days, consolidating between key levels and building up liquidity for the next big move. When price goes quiet like this after an impulsive structure, it’s not time to trade—it’s time to observe, analyse, and prepare.
So, where’s the next high-probability setup?
Let’s break it down:
🔹 Elliott Wave Context
From my previous SUI analysis, I identified a completed 5-wave impulse structure. After such a move, a corrective ABC pattern is typically next.
SUI has been respecting technical levels with surprising accuracy throughout this cycle—especially Fibonacci levels and key horizontal zones.
📉 ABC Correction in Progress?
Wave A appears to be completed, and Wave B was rejected at the yearly level in perfect confluence with the golden pocket (0.618–0.666) retracement of Wave A. This strongly suggests that Wave C is now unfolding.
Using the 1:1 trend-based Fib extension, the projected Wave C target lands at:
➡️ $3.6413
Let’s dig deeper—does this level hold up under further scrutiny?
🔍 Multi-Layered Confluence at $3.56–$3.64
Here’s what aligns at this potential support zone:
1:1 Fib extension (Wave A = Wave C) → $3.6413
0.55 Fib retracement (from $3.1132 to $4.2967) → ~$3.64
Volume Profile POC from prior range → ~$3.59
0.618 Fib retracement → $3.5653
Weekly level → $3.5594
21-Day EMA → $3.5537
21-Day SMA → $3.6319
0.75 Fib Speed Fan (if hit on May 16) → aligns with zone
This stack of levels gives us a tightly packed, high-conviction support area between:
📍 $3.56 – $3.646
___________________________________
🟢 Long Setup Idea:
Entry Zone: Ladder entries between $3.56 and $3.75
Stop-Loss: $3.4546 (beneath confluence zone)
Take-Profit Target: $4.588 (0.786 Fib retracement + -0.236 Fib extension)
R:R: ~5:1
🚫 Invalidation: If SUI reclaims the yearly level at $4.1152 before revisiting this support, the setup is invalidated.
🔴 Short Setup Idea:
If SUI pushes into the 0.786 Fib retracement at $4.588 and shows clear rejection (e.g., SFP, bearish engulfing, high-volume reversal), a short can be considered.
Entry: On rejection at $4.588
Stop-Loss: ~$4.714
Targets:
TP1: $4.325 (recent highs)
TP2: $4.1152 (yearly level)
🧠 Final Thoughts:
This is where trading becomes a game of patience. I’ve mapped both long and short setups based on structure, confluence, and price behaviour. Now it’s about waiting for price to come to your levels.
⏰ Alarms set.
📈 Let the chart do the work.
More updates to come as the range resolves. Stay sharp!
___________________________________
If you found this helpful, leave a like and comment below! Got requests for the next technical analysis? Let me know.

$SPY Calls - May 30 - $600Entered on the trend line confirmation, with a price target of $600.
Stop loss behind the trend line.

XAUUSD – Testing resistance zone, will there be a breakout?Gold continues its impressive recovery on the 3H timeframe, after bouncing strongly from the support zone around $3,300. Currently, the market is approaching a key resistance area at $3,400 – a level that previously triggered strong selling pressure.
EMA34 and EMA89 have crossed upwards, indicating that short-term bullish momentum is gaining strength. However, since this is a former resistance zone, a pullback to the $3,300 area before continuing the upward move is entirely possible.
On the news front, rising jobless claims and weakening manufacturing PMI have lowered expectations for the strength of the USD. However, a slight uptick in the services PMI keeps market sentiment cautious – resulting in a tug-of-war, though still leaning in favor of the buyers.
What do you think? Will gold break out further or take a breather first?

BTC Back to $100K — The Final Dip Before All-Time Highs?Bitcoin has been trading slowly and steadily just below its all-time high at $109588. The key question now is:
💭 Is BTC ready to break through and print a new all-time high? Or does it need one more dip before liftoff?
Let’s break it down.
Elliott Wave Structure & Market Context
BTC recently completed a clean 5-wave impulsive structure, with Wave 5 topping out into a major resistance zone. That confluence included:
Value Area High (VAH)
Weekly resistance
Daily multi-level clusters
Final resistance zone before price discovery
After multiple rejections from this zone, BTC lacked the momentum for a breakout — so a retracement was expected.
And that’s what we’re now seeing: a textbook ABC correction.
📉 ABC Correction Breakdown
✅ Wave A: Dropped sharply, nearly tapping the psychological $100K level
✅ Wave B: Retraced into the prior resistance band between $106133 and $104464 — rejected perfectly off the 0.786 Fib of Wave A
🔄 Wave C: Now unfolding
To project the potential bottom of Wave C, we use the trend-based Fib extension (Wave A = Wave C). The 1:1 extension lands at:
🎯 $99875 — Right at the $100K psychological magnet
Add this confluence:
🟢 Key swing high at $99475
✅ 0.5 Fib retracement of the entire 5-wave rally
🔍 Psychological Level: $100K
🔑 Liquidity and demand zone
This makes the $99K–$101K area a strong, high-conviction support zone.
🟢 Long Trade Setup
Entry zone: Ladder between $101K – $99K
Stop-loss: Below GETTEX:97K
Target: New all-time high at $109588
R:R: ~3:1+
Structure: Correction into high-confluence zone + psychological level = high probability setup
📌 Summary:
BTC likely finishing Wave C of ABC correction
$100K = confluence of Fib, structure, psychology, and liquidity
Setup is simple: Wait for price to retest this zone and trigger your plan
If this level holds, BTC may be ready to attempt a breakout into price discovery
Let the chart come to you — and trade the reaction, not the anticipation. 📉🔁📈
____________________________________
If you found this helpful, leave a like and comment below! Got requests for the next technical analysis? Let me know.

recovery, gold price traded above 3300 mark⭐️GOLDEN INFORMATION:
Beth Hammack of the Cleveland Federal Reserve emphasized that current U.S. government policies have made it increasingly challenging for the Fed to steer the economy effectively and fulfill its dual mandate of price stability and full employment. She also warned that the risk of a stagflationary environment—marked by stagnant growth and persistent inflation—is on the rise. In contrast, St. Louis Fed President Alberto Musalem recently argued that the current monetary policy stance remains appropriately calibrated.
Despite elevated U.S. Treasury yields, gold has struggled to gain traction, suggesting that higher yields alone are not enough to drive safe-haven demand under current conditions.
However, global monetary easing could provide a tailwind for the precious metal. In the latest moves during the Asian session, the People’s Bank of China (PBoC) cut its benchmark rate, followed by the Reserve Bank of Australia (RBA), which unexpectedly reduced its Cash Rate from 4.10% to 3.85%—actions that typically support non-yielding assets like gold.
⭐️Personal comments NOVA:
Gold prices recover due to military instability in the Middle East, growth momentum above 3300
⭐️SET UP GOLD PRICE:
🔥SELL GOLD zone : 3354- 3356 SL 3361
TP1: $3345
TP2: $3332
TP3: $3320
🔥BUY GOLD zone: $3252 - $3250 SL $3245
TP1: $3260
TP2: $3270
TP3: $3280
⭐️Technical analysis:
Based on technical indicators EMA 34, EMA89 and support resistance areas to set up a reasonable BUY order.
⭐️NOTE:
Note: Nova wishes traders to manage their capital well
- take the number of lots that match your capital
- Takeprofit equal to 4-6% of capital account
- Stoplose equal to 2-3% of capital account

$ARB time to fly $1 this bull run 2025 and it's Last Wave...AMEX:ARB Time to Fly and Touching $1 this Quarter. I guess it will be happened and gain bonuses $1+ and $2+ if big investor entry on this token.
My Magic Indicator Say ARB Price have touch Yellow line. Previous Day, Bounce back to above Yellow Line and It's Bull Run 2025 for ARB .
From News: ARB Eyes Trend Reversal With Breakout Signal Above $0.45 This Week
Arbitrum is trading at $0.41 inside a falling wedge and a breakout above $0.45 might confirm a wide shift from its yearlong downward trend.
Arbitrum has formed a falling wedge with lower highs and higher lows now compressing price at $0.41.
If the price moves above $0.45 with strong volume this could confirm a new bullish pattern for $ARB.
The wedge has been forming since 2024 and a breakout may signal the start of a strong trend reversal.
The descending wedge pattern forming on the Arbitrum chart spans nearly one year, beginning from its 2024 highs near $2.50. Several failed rallies marked by red arrows define the top boundary, while green arrows at the base represent support retests. This structure has now tightened into a narrow apex where breakout probability increases significantly.
#Write2Earn #BinanceSquareFamily #Binance #BTC☀ #SUBROOFFICIAL
Disclaimer: This article is for informational purposes only and does not constitute financial advice. Always conduct your own research before making any investment decisions. Digital asset prices are subject to high market risk and price volatility. The value of your investment may go down or up, and you may not get back the amount invested. You are solely responsible for your investment decisions and Binance is not available for any losses you may incur. Past performance is not a reliable predictor of future performance. You should only invest in products you are familiar with and where you understand the risks. You should carefully consider your investment experience, financial situation, investment objectives and risk tolerance and consult an independent financial adviser prior to making any investment.
