$ARB time to fly $1 this bull run 2025 and it's Last Wave...AMEX:ARB Time to Fly and Touching $1 this Quarter. I guess it will be happened and gain bonuses $1+ and $2+ if big investor entry on this token.
My Magic Indicator Say ARB Price have touch Yellow line. Previous Day, Bounce back to above Yellow Line and It's Bull Run 2025 for ARB .
From News: ARB Eyes Trend Reversal With Breakout Signal Above $0.45 This Week
Arbitrum is trading at $0.41 inside a falling wedge and a breakout above $0.45 might confirm a wide shift from its yearlong downward trend.
Arbitrum has formed a falling wedge with lower highs and higher lows now compressing price at $0.41.
If the price moves above $0.45 with strong volume this could confirm a new bullish pattern for $ARB.
The wedge has been forming since 2024 and a breakout may signal the start of a strong trend reversal.
The descending wedge pattern forming on the Arbitrum chart spans nearly one year, beginning from its 2024 highs near $2.50. Several failed rallies marked by red arrows define the top boundary, while green arrows at the base represent support retests. This structure has now tightened into a narrow apex where breakout probability increases significantly.
#Write2Earn #BinanceSquareFamily #Binance #BTC☀ #SUBROOFFICIAL
Disclaimer: This article is for informational purposes only and does not constitute financial advice. Always conduct your own research before making any investment decisions. Digital asset prices are subject to high market risk and price volatility. The value of your investment may go down or up, and you may not get back the amount invested. You are solely responsible for your investment decisions and Binance is not available for any losses you may incur. Past performance is not a reliable predictor of future performance. You should only invest in products you are familiar with and where you understand the risks. You should carefully consider your investment experience, financial situation, investment objectives and risk tolerance and consult an independent financial adviser prior to making any investment.
Longsetup

SOLUSD Long1D Analysis:
SOLUSD is in a strong uptrend with a second Higher High (HH) in place. A bullish divergence is visible, and price has retraced into the golden zone (0.5–0.618 Fib) — signaling a high-probability long setup. Instant buy is Suggested.
Bull Score: 2 vs 0 (Uptrend (Dow Theory, Bullish Divergence vs 0)
🛡 Risk Management
📍 Entry (EP): 170.50 (Instant Buy)
🛑 Stop Loss (SL): 140.55
🎯 Take Profit 1 (TP1 - 1:1): 199.40
🎯 Take Profit 2 (TP2 - 1:2): 228.78
💰💸 Trade smart, manage risk, and let the trend print

XAUUSD – Short-term bounce, major trendline still in play!Hey everyone, looking at the chart, we can see that gold is still moving within a larger uptrend. However, it's now testing a key resistance trendline that has repeatedly caused price to reverse in the past.
The recent bounce from the $3,170 zone looks strong on the surface, but in reality, it's just retesting the $3,400 resistance area – where selling pressure could reappear. Price behavior is also showing signs of losing steam as it approaches previous highs.
If the price fails to break through the upper trendline, a pullback to the $3,400 support zone is the first likely scenario. A deeper move toward the $3,170 area – which previously triggered strong buying – could also unfold.
Summary: Price is currently testing a strong resistance zone. If it fails to break above, the likelihood of a corrective reversal increases. Watch the trendline reaction closely and plan accordingly!

SOL Trade Blueprint: Waiting for the High-Conviction EntryAfter printing a SFP at the key high of $180.52 followed by a sharp -8% rejection, SOL made a second attempt to breach the major resistance zone between $180–$185 — but once again, bulls fell short. Since then, price has been in a corrective phase. So the big question is: where’s the next high-probability trade setup? Let’s zoom out and break it down.
📏 Zooming Out: Structure, FVG & Fib Confluence
Back on May 8th, SOL broke through the April 25th swing high at $157 with strong momentum, leaving behind an untested Fair Value Gap (FVG) — a key displacement area that’s yet to be filled. When we draw the Fibonacci retracement from the low of that move to the current high, the 0.618 retracement lands precisely at $157.34 — right on the old breakout high. That’s a beautiful confluence.
Timing-wise, if SOL pulls back to that level between May 21–22, the 0.75 Fib speed fan also kicks in — adding dynamic trendline support to the static Fib level.
📉 What About the $164 Golden Pocket?
There's a golden pocket forming around $164 from a recent mini-impulse, and while it may look tempting, context matters. This pocket isn't supported by enough confluence — no major structure, volume shelf, or EMA alignment. For a quick scalp? Yes. But for a high-conviction swing? It's not ideal.
Remember, in trading we're not here to chase every candle — we're here to wait for the setups that stack the most reasons to say yes.
📍 The Zone to Watch: $157
Now let’s talk about that $157 zone — and why it’s standing out as the highest-probability long setup:
0.618 Fib retracement of the major impulse
Retest of the breakout swing high
Untested Fair Value Gap (FVG)
233 EMA + 233 SMA on the 4H timeframe lining up as dynamic support
1.5 outer pitchfork support line crossing through
1:1 trend-based Fib extension confluence
Prior area of interest
This is what we call a “stacked setup.” The more layers of confluence, the more conviction we have in the trade. Add to that the potential for a liquidity sweep (SFP) just below the current low at $159.44 — and it becomes a zone worth watching closely.
🎯 Long Setup:
Entry: $157–$159.44 (watch for SFP confirmation)
Stop-Loss: Below $154
Target: $200
R:R: Approx. 1:12 — a setup worth being patient for
🧠 Educational Note: Why Confluence Is King
High-probability trades don’t come from guessing. They come from stacking confluence: structure, Fibonacci, moving averages, time-based levels, pitchforks, VWAPs, volume profiles — the more that lines up, the less you need to hope and the more you can trust your edge. Think like a sniper, not a machine gun.
The market rewards patience and precision — not noise and FOMO.
🔻 Short Setup (Alternative Play)
While we’re primarily bullish, there’s a valid short opportunity at the psychological $200 mark — but only if price shows clear rejection and confirmation (e.g. SFP, bearish engulfing, high volume reversal).
Entry: $200 rejection
Stop-Loss: Above $205
Target: $185–$180
R:R: Approx. 1:3+
🔥 Final Words: Trade With Purpose
This is what trading is about — not chasing green candles, but waiting for structure, clarity, and alignment. Whether you’re trading long or short, focus on high-conviction setups backed by logic and levels, not emotion.
Don’t trade for action. Trade for precision. The market will always reward the patient ones who are willing to wait for that clean entry, stacked with reasons to act.
Trust the process, stay disciplined, and let the charts do the talking. 💪📈
___________________________________
If you found this helpful, leave a like and comment below! Got requests for the next technical analysis? Let me know.

XAU/USD (Gold) – Long Opportunity from Ascending Triangle 🟡 XAU/USD (Gold) – Long Opportunity from Ascending Triangle Breakout
Gold is showing a strong bullish structure with a well-formed ascending triangle on the chart, often a signal of continuation in an uptrend.
🔸 Key Technicals:
Rising trendline of higher lows indicates strong buyer interest.
Horizontal resistance at $3,255 has been tested multiple times.
Volume and structure suggest a potential breakout above resistance.
🔸 Trade Idea:
Entry: Upon breakout and retest of the $3,255 zone.
Stop-Loss: Below recent support and trendline (~$3,223).
Take Profit 1: $3,322 – Move SL to breakeven once hit.
Take Profit 2: $3,388 – Based on the height of the triangle projected upward.
This setup offers a clean 4% move with solid risk-to-reward. Ideal for swing traders watching Gold’s reaction to macroeconomic events.
📌 Always wait for breakout confirmation and manage risk wisely.
Let’s see if the bulls have what it takes to push through! 🚀

NEARUSDT NEARUSDT – Bullish Reversal Trade Setup
Entry: $2.78
SL: $1.81
TP1: $3.90
TP2: $4.96
Trail for Extension: $5.50–$6.00
Structure & Logic:
Previous Lower Low (LL) and Lower High (LH) sequence broken.
Higher High (HH) now confirmed — signaling trend reversal.
Strong Bullish Engulfing + Hammer at Higher Low area.
Dow Theory shift in play, signaling long opportunity.
Trade Plan:
Partial at TP1
TP2 for full target
Trail SL above TP2 for potential $5.5–6.0 move
Risk-managed entry: ~1:1 , 1:2

XAUUSD – Is the “Death Triangle” About to Break Down?Hey everyone, looking at the 8H chart, we can see that gold is tightening inside a narrow triangle – a sign of both consolidation and a potential major breakout coming soon. However, what's worth noting is that the price structure leans toward a bearish breakout, as gold continues to form lower highs and gets repeatedly rejected around the $3,250 resistance zone – which also aligns with the upper edge of the triangle.
Below, the long-term ascending support line is under significant pressure. If sellers maintain control and push the price below this trendline, the next potential target could be the $3,080 zone – aligning with the most recent swing low and acting as a possible support area.
Summary:
The $3,250 zone is the “checkpoint” to watch for selling pressure. If the price fails to break above this level, the downtrend is likely to continue.
The lower edge of the triangle is the “lifeline” for buyers. If it breaks, the likelihood of a deeper drop increases significantly.
What’s your take on this setup? Let’s share our views and spot the best trading opportunities together!

Is Gold About to Enter a Sharp Downtrend?Hey traders, looking at the chart, it’s quite clear that gold is currently undergoing a clean technical pullback – with the main objective being to fill the GAP around the $3,200 zone. This area is a strong confluence with the EMA34, and also marks a level where decisive selling pressure was previously observed.
Technically speaking, the overall structure remains bearish. Gold is still neatly confined within the descending channel, and recent rebounds appear to be nothing more than setups for sellers to "reload." The EMA34–EMA89 continue to serve effectively as dynamic resistance, and price action is already showing signs of fading bullish momentum as it approaches this key barrier.
The market is also responding to growing concerns over new U.S. tax policies, combined with a waning sense of defensive positioning. From my observations and feedback from various sources, the general sentiment leans toward gold continuing to weaken in the short term – not because of any sudden shock, but due to a lack of compelling bullish catalysts.

Rising wedge on SPY - Melt up? or Next leg down? Immediate Bias (Tomorrow):
Scenario 1 – Bullish Continuation (Low Probability unless there's a macro catalyst):
Breaks above ~$596–$598 cleanly
Retests that zone as support (watch 595.50 intraday)
Then targets:
600 psychological
604–608 upper resistance channel
Possible end-of-month blow-off top: 612–618
Scenario 2 – Pullback / Rejection (More Probable Setup):
Rejected at ~596–597 zone (which aligns with upper wedge resistance)
Breakdown below $590 intraday
Then targets:
587.80 EMA cluster (20/50)
If lost → 576.44 next EMA + demand level
Followed by major support at 565.87 / 563.43
🔥 Week Ahead Trade Plan (May 20–24)
✅ Bullish Possibility:
If NVDA earnings, FOMC minutes, or macro data surprise to the upside
Watch for breakout above the red wedge and hold above 600
Target range: 604 → 612 max upside
🚨 Bearish Scenario:
Wedge breakdown below ~$590
Momentum cracks down to:
587
576 (watch for bounce)
If panic selling → 565–563 (larger time frame buying zone)
Volume divergence and overbought EMAs support a potential cool-off.
📅 Monthly Projection (End of May):
If wedge breaks down → consolidation range between 563 – 587
If wedge breaks out → blow-off rally up to 612–620, but likely to fade quickly
Fed commentary and NVDA earnings on May 22 will be major catalysts
📌 Key Levels
Type Price Notes
Resistance (R3) 612–618 Final upside blow-off zone (channel top)
Resistance (R2) 604 Overhead channel line
Resistance (R1) 595–598 Wedge top + major resistance
Support (S1) 587 EMA cluster + strong local demand
Support (S2) 576 Clean structure + prior breakout
Support (S3) 565–563 Confluence of long-term EMAs + trendline
🎯 Trade Setups
📉 Bearish (Favored if no breakout tomorrow):
Short 595–597 with stop above 600
Targets: 587 → 576
Optional: Add below wedge break (~590)
📈 Bullish (Confirmation-based):
Break + retest of 597–600
Target: 604, then scale out at 612
Avoid front-running long unless you see volume + price close outside wedge

“Gold Buy Setup | Demand Flip with 3R Potential”XAU/USD’s Gold Silver price has exhibited a notable increase from the demand zone of 3,230-3,234 after the price experienced a sharp decline amidst the liquidity grab. The price has shown strong rejection and bullish price action from this zone, which may potentially suggest an intent of smart money and change of order flow.
📈 Why This Zone Matters:
This area has facilitated as a damp for most of the previous upward movements and current candlestick patterns indicate that this area is being respected. Therefore, if price bounces from here, there is high probability that market participants or buyers will step in vigorously defending this zone which will strongly suggest a bullish price movement.
🎯 Trade Plan:
Entry Zone: 3,230 - 3,234
Stop Loss: 3,227 (Sturucture invalidation)
Take Profit:
TP1: 3,238 (first reaction zone)
TP2: 3,241 (liquidity zone nad prior high)
⚠️ Invalidation Point:
If price drops below 3,227 and holds below this threshold, the demand zone is deemed breached, ending the bullish premise. A reassessment will be necessary.

Trading around 3200 at the beginning of the week⭐️GOLDEN INFORMATION:
Gold (XAU/USD) is staging a recovery from recent losses, trading around $3,230 per troy ounce during Monday’s Asian session, as investors seek refuge in safe-haven assets amid growing anxiety over the US economic outlook and fiscal sustainability.
The rebound comes on the heels of Moody’s decision to downgrade the US credit rating by one notch, from Aaa to Aa1, citing mounting debt and a rising burden from interest payments. This follows earlier downgrades by Fitch in 2023 and S&P in 2011. Moody’s now projects US federal debt to surge to roughly 134% of GDP by 2035, up from 98% in 2023, driven by ballooning debt-servicing costs, expanding entitlement programs, and weakening tax revenues—all of which have intensified investor concerns and lent fresh support to gold prices.
⭐️Personal comments NOVA:
Gold traded around 3200 at the beginning of the week, not much news impact, continue sideways
⭐️SET UP GOLD PRICE:
🔥SELL GOLD zone : 3259- 3261 SL 3266
TP1: $3250
TP2: $3240
TP3: $3230
🔥BUY GOLD zone: $3192 - $3190 SL $3185
TP1: $3200
TP2: $3210
TP3: $3220
⭐️Technical analysis:
Based on technical indicators EMA 34, EMA89 and support resistance areas to set up a reasonable BUY order.
⭐️NOTE:
Note: Nova wishes traders to manage their capital well
- take the number of lots that match your capital
- Takeprofit equal to 4-6% of capital account
- Stoplose equal to 2-3% of capital account

ETH ANALYSIS📊 #ETH Analysis
✅There is a formation of Falling Wedge Pattern on daily chart and currently trading around its major support zone🧐
Pattern signals potential bullish movement incoming after sustain above the major support zone
👀Current Price: $2380
🚀 Target Price: $2785
⚡️What to do ?
👀Keep an eye on #ETH price action and volume. We can trade according to the chart and make some profits⚡️⚡️
#ETH #Cryptocurrency #TechnicalAnalysis #DYOR

SOL/USDT LONGBINANCE:SOLUSDT.P
Entry 66
SL 163.5
TGT 180
It can form a W pattern and give a big target
Remember we only follow risk reward ratio which is usually 1:6

$UBER looks like a bargain to me in FY 2025. PT $95-104- Uber's capital-light business model has been a major boon to their growth and global expansion efforts, whereas robotaxi will be capital extensive.
- The biggest worry regarding robotaxi implementation is the up-front capital required to get the required vehicle fleet on the road, and the years it may take to get the operations running efficiently. However, I don't think that the fear of robotaxi is overblown, as it is simply not a suitable business model in comparison to Uber's current infrastructure.
- I don't believe robotaxi fears will have materialistic impact on Ubers financials for years to come. Therefore, NYSE:UBER is a strong buy for me and I am comfortable in holding this stock and adding more if it dips.

$REZ Reversal in Motion – Eyes on the Next Wave UpAMEX:REZ reversed major resistance into support upon coming out of a downtrend.
We are currently looking for a pullback towards the 0.618 Fib level at 0.015 before the next wave up.
The market structure is still bullish, and the chart is priming for an explosive breakout into $0.023+.
Keep alert and observe that level.👀
DYOR, NFA

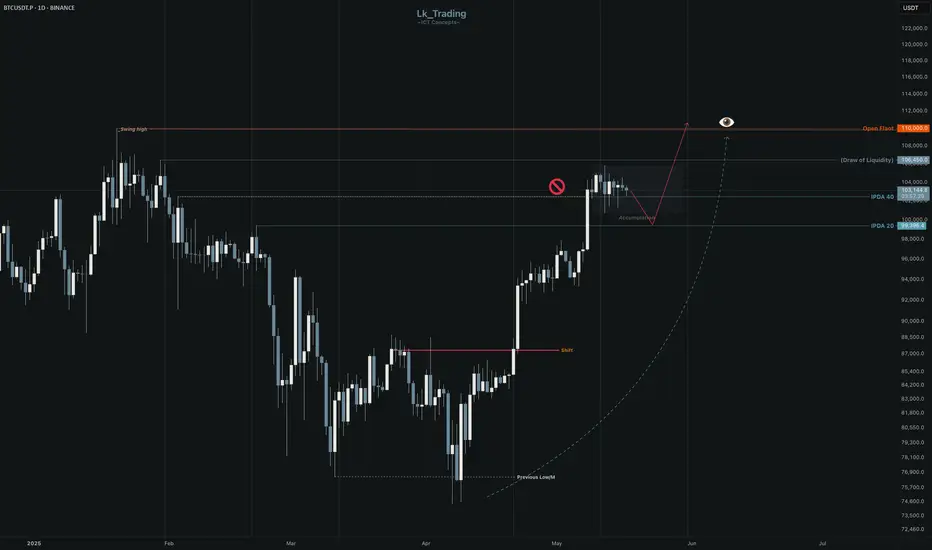
BTCUSDT.P
We are In Order Flow Bullish, But Now Is Re-Accumulation to continuo higher To Open Float Id DOL OF MMBM
Maybe Next week is Bearish Candle To Retracement (SSL/4D) if we are Rejected Is Good Entry Point Buy (100,624)
$CHILLGUY Cooling Off – Accumulation Zone Ahead?$CHILLGUY is pulling back after a strong run-up.
Price is currently sitting around the $0.0757 area, but in my opinion, there could be a drop towards the lower zone around $0.052–$0.060.
That area could be a solid spot for accumulation.
Keep an eye on this zone. 👀
Stay tuned I’ll keep you updated if anything changes.
#chillguy #Altseason2025

$WLD Dips Into Key Support – Next Move Loading!MIL:WLD is currently pulling back into a strong confluence support zone aligning with the 100EMA, 200EMA, and ascending trendline on the 6H chart.
Price is hovering just above the 0.382 Fib level (~$1.06), which previously acted as a pivot. Holding this level could spark the next bullish leg toward $1.30+.
But if this zone cracks, we might revisit the trendline near $1.02 before any meaningful bounce.
📌 Eyes on price action, this structure still favours higher highs unless invalidated.
#WLD #cryptocurrency

Critical Test for $DOGS – Launchpad or Breakdown?SEED_ALEXDRAYM_SHORTINTEREST1:DOGS Update
SEED_ALEXDRAYM_SHORTINTEREST1:DOGS is heading towards an important confluence support area resting precisely at the 0.382 Fib (~0.0000184), the rising trendline, and the 50EMA on the 12H chart.
This area has maintained support in the last rally and may again serve as the launchpad for another bullish run towards 0.000022–0.0000239.
A dip below this level, though, could change short-term bias.
Be on the watch for the reaction. 👀
#DOGS #cryptocurrency

XLMUSD Long - Inverted Head and Shoulders on the daily
- Price is re/testing the neckline of the H&S
- 20ema is now trading above the 50ema (good indication of a possible up trend starting)
- Stop loss below the higher low
- take profit around 0.35 possibly higher

“XAU/USD Buy Setup | Breakout Retest with 3-Target Bullish StrucThe hope of this idea presents a bullish setup on Gold (XAU/USD) based on a breakout–retest structure with multi-session volatility for price action.
Strong recovery above the intraday consolidation zone near 3180-3183 breaks the sharp liquidity sweep beneath 3171. This aggressive recovery may suggest a fakeout and reversal whipsaw: a smart money signature.
🔹 Technical Rationale:
Entry Zone (3181-3183): Aligned with supply candles' base as well as minor demand zone order.
SL (3180): Structural support and bullish engulfing low just beneath.
TP1 (3187): Prior minor high.
TP2 (3190): Consolidation rejection zone around psychological approximate value.
TP3 (3192): High-value liquidity cluster and potential sweep zone above high.
The market has printed higher lows after the fakeout suggesting bullish continuation bias resulting the structure holding until 3180. With favorable R:R ratio and flexible structure, everything stays intact.
⚠️ Risk Note:
Confirmation based trend continuation idea. Strong volume sustaining move below 3180 invalidates the idea.
📈 The structure and set levels provide clean bounds to wait for market dynamics.

PATIENCE PAYS 〉BEARS TRAPPED - HODL TO $4,000As illustrated, Im trying to visualize the beginning of the next impulse toward $4,000
This is an intraday - swing trade opportunity to 1H highs; however, it would be just the first move toward a longer term path to ATH above $3,500
Ride this wave as you can, but know that the yellow metal still has a lot of strength and power to continue growing.
June might still behave strangely as it is a consolidation month on average 5-10-15 years; however, It wouldn't surprise me if market structure holds important support prices instead of ranging back below $3,200 - $3,150 ; in other words, that range might be strong longterm support.
--
GOOD LUCK!
SECURE PROFITS.
persaxu

EURJPY - Analysis and Potential Setups (Intraday- 16.05.2025)Brief Description:
A BoS as shown would give us additional confluence on this trade.
I will be taking an aggressive entry @ half risk and will add another position if we see price develop further and give us confirmation structures.
