BTCUSD Technical Analysis – Is a Pullback Coming Soon?BITSTAMP:BTCUSD is currently trading within a clearly defined ascending channel, with price action now testing the upper boundary. This level may act as a dynamic resistance, and rejection here could trigger a corrective move towards the $98,000 support zone.
If buyers defend this support level, the bullish structure remains intact, with potential to move back toward higher levels. However, if price breaks below this zone, there will be little to stop it from falling further.
Monitoring candlestick patterns and volume at this key area is essential to identify potential buying opportunities. Risk should be managed properly—always confirm your setups and trade with solid risk management.
If you have any thoughts on this setup or additional insights, feel free to share them in the comments!
Longsetup

ENS ANALYSIS📊 #ENS Analysis
✅There is a formation of Falling Wedge Pattern on 12 hr chart and currently trading around its major support zone🧐
Pattern signals potential bullish movement incoming after the breakout of resistance 1
👀Current Price: $22.58
🚀 Target Price: $31.29
⚡️What to do ?
👀Keep an eye on #ENS price action and volume. We can trade according to the chart and make some profits⚡️⚡️
#ENS #Cryptocurrency #TechnicalAnalysis #DYOR

TWT ANALYSIS🚀#TWT Analysis :
🔮As we can see in the chart of #TWT that there is a formation of "Falling Wedge Pattern". Some time ago the same structure was made and it performed well and this time also the same is happening with a perfect breakout
🔰Current Price: $0.8464
🎯 Target Price: $1.0865
⚡️What to do ?
👀Keep an eye on #TWT price action. We can trade according to the chart and make some profits⚡️⚡️
#TWT #Cryptocurrency #TechnicalAnalysis #DYOR

SOL Analysis Deep Dive: Identifying Optimal Entry and Exit ZonesYesterday, SOL gave a sharp downside shakeout, dropping from the weekly open at $147.98 (perfectly retested) down to the 0.5 Fib retracement of the swing at $140.25. Here’s a structured breakdown of the key levels, trade setups, and R:R profiles for both longs and shorts:
🔑 Key Levels & Confluences
1. Higher-Timeframe Opens
Weekly Open & Retest: $147.98 – pivoted price before the drop
Monthly & Prior-Day Open Cluster: $147.98–$146.31 – strong support confluence zone
2. Fibonacci Support Zones
0.5 Fib at $140.25 – primary mean-reversion entry
0.786 Fib (smaller wave) at $138.78 – secondary, deeper support
3. Order Block
Daily Bullish Order Block at $139.87 – just below 0.5 Fib, adds extra support
4. Volume-Weighted Average Price
Anchored VWAP (from ATH $295.83) at ~$166.45 – key upside resistance
5. Market Profile Value Areas (10-Day Range)
Value Area High (VAH) at ~$153.00 – overhead resistance confluence
Value Area Low (VAL) at ~$145.75 – underpins support
📈 Long Trade Setups
1. 0.5/0.786 Fib + Daily Bullish Order Block
Entry: $141-138.78
Stop-Loss: $137.5
Target: $165 (anchored VWAP / Fib zones)
R:R ≈ 9:1
2. Higher-Timeframe Open Cluster
Entry Zone: $147.98–$146.31(monthly/weekly open)
Stop-Loss: $142.5
Target: $165
R:R ≈ 3:1
• Why these levels? The 0.5 Fib is a classic mean-reversion zone, bolstered by the daily order block. The $147–146 zone ties together multiple opens (weekly, monthly, prior-day), offering a solid demand area if price retraces back up.
📉 Short Trade Setup
Trigger: Rejection / swing-failure around $153.4
Entry: $153.4
Stop-Loss: $154.3
Target: Weekly/Monthly open (~$147)
R:R ≈ 6:1
• Low-risk short: A clean rejection at the recent high lets you define risk tightly above the swing, aiming to capture the retrace back to the opens.
🎯 Summary & Game Plan
Primary bias: Look for long entries at the 0.5 Fib ($140.25) or the open-cluster zone ($147–146), with targets toward the anchored VWAP at ~$166.
Alternate bias: A short on clear rejection from $153.4, targeting the opens as support.
Risk management: Keep stops tight (SL below $137.5 or above $154.3) to maximize R:R on your favored setups.
Volume & Price Action: Confirm entries with an uptick in volume or bullish price structure (for longs) or swift failure patterns (for shorts).
Now it’s a waiting game! Let price revisit these zones, watch for confirmation signals, and then scale into your chosen side. Good luck! Don't chase, let the charts come to you!
____________________________________
If you found this helpful, leave a like and comment below! Got requests for the next technical analysis? Let me know.

Bitcoin: Blood in the Streets – Now is the Time!Once again, there’s blood in the streets—and from this point on I start scaling into spot positions again, slowly but deliberately.
All of these are spot entries with soft stop-losses—not hard exits, but areas I’ll react to if needed.
So why now? For one, we’re sitting right above the 38,2% Fibonacci level for the ending of the wave A. At the same time, we’re about to tap into a daily Fair Value Gap, while trying to hold the range support—two important technical levels lining up on the higher time frame.
Below that, we have an untapped VWAP at $65.5K, which could act as a magnet, as it often does. And yeah—if we go under $62K or even $60K, the classic “time to work at McDonald’s” joke comes back. But seriously: in markets like this, you need to stay calm, have some humor, and most of all, know what’s possible.
So I’m cautiously watching the S&P 500 closely, which plays a big role in this setup for me.
That’s where I stand on BTC right now—careful optimism, grounded in context and reasoning for me.

Scenario #BTCUSDT long📉 LONG BYBIT:BTCUSDT.P from $104,353.0
🛡 Stop loss: $103,572.0
🕒 Timeframe: 1H
✅ Market overview:
➡️ The price confidently broke above $103,729 and held, confirming the uptrend.
➡️ The next target zone is $104,720–$105,090 — nearest movement objectives.
➡️ Volume increased during the impulse, indicating strong buyer presence.
➡️ A local support level formed around $103,729 — on a pullback, this zone may hold the price.
➡️ POC at $94,479 remains far below — the market has left the balance zone and is trading in an impulsive phase.
🎯 TP Targets BYBIT:BTCUSDT.P :
💎 TP1: $104,720.0
💎 TP2: $105,090.0
💎 TP3: $105,275.0
⚠️ Important: current structure BYBIT:BTCUSDT.P suggests possible correction (wedge breakdown), requiring caution or exit on key level loss.
⚠️ Despite the initial long from $104,353, a breakdown below $103,572 (stop loss) invalidates the long setup.
📢 If H1 closes below $103,572 — better to exit, scenario invalid.
🚀 Scenario BYBIT:BTCUSDT.P valid while holding above $103,729 — below that, correction likely toward lower targets!

#ETH Breakout is incoming!$ETH/USDT – Breakout Watch
Ethereum is currently retesting a key descending resistance line after an extended period of consolidation. The structure suggests growing bullish momentum.
🟢 A successful breakout and daily close above the $1,900–$2,000 zone could trigger a move toward $2,200–$2,400 in the coming sessions.
Watch for confirmation with volume expansion and retest behavior. Rejection at this level could delay the move, but the pressure is clearly building.
Key Levels:
Resistance: $1,900–$2,000
Target: $2,200–$2,400
Support: $1,800
Chart looks clean breakout potential is real.
DYOR NAF
BINANCE:ETHUSDT BITSTAMP:ETHUSD

SUI ANALYSIS📊 #SUI Analysis
✅There is a formation of Descending Channel Pattern in daily time frame in #SUI .
Also there is a perfect breakout and retest. Now we can expect a bullish move. If the price successful retest the major support zone then we will see more bullish move
👀Current Price: $3.89
🎯 Target Price : $4.25
⚡️What to do ?
👀Keep an eye on #SUI price action and volume. We can trade according to the chart and make some profits⚡️⚡️
#SUI #Cryptocurrency #Breakout #TechnicalAnalysis #DYOR

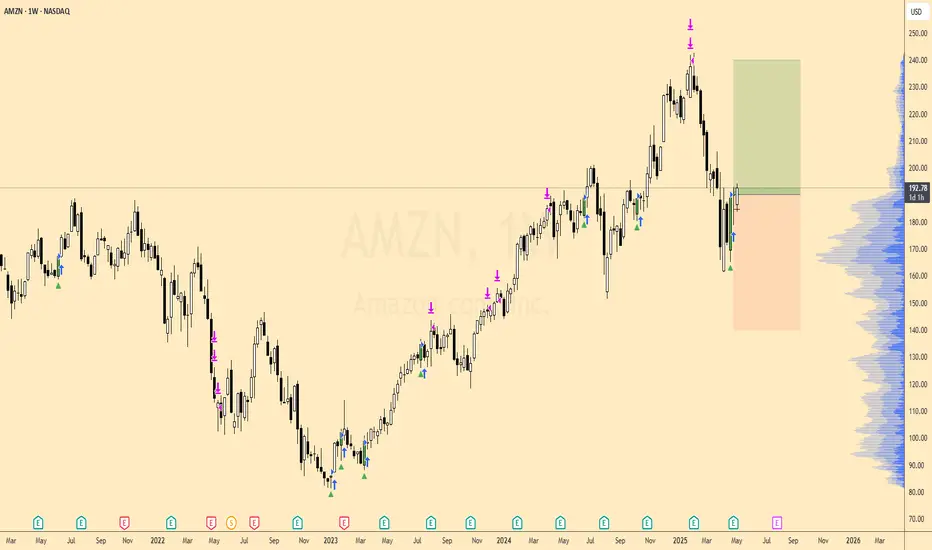
AMZN Weekly Bullish Setup - 91% Historical Win RateI’m looking to go long on Amazon (AMZN) on the weekly chart as the price that has acted this way has been a strong indicator for a swing trade in the past.
Since early 2023, AMZN has climbed from the mid-$70s to a peak above $245, carving out clear impulse moves followed by healthy pullbacks.
The current pullback has returned into the $185–195 region, which on the weekly VP shows the largest volume accumulation (HVN). Historically this zone has marked both places to buy into rallies and logical areas to defend.
We were in a 5 week range. Last week printed a bullish rejection candle (long lower wick), accompanied by my weekly “buy” arrow (green triangle). This mirrors 34 prior occurrences of the same pattern on AMZN’s weekly chart.
Targeting the $240 region, this is a 1:1 trade
GBPUSD: Bullish Fakeout at Key 50% Fibonacci Level🚀After a brief consolidation near the 50% Fibonacci retracement, price performs a bullish fakeout, signaling its intention to move higher.
The 14:00 candle stands out as a clear sign of strength from buyers.
🔍 Trade Setup
📍 Entry limit:
⛔ Stop Loss:
🎯 Take Profit:
⚖️ Risk/Reward: ≈
💬 What’s your outlook on GBPUSD?
Is this the start of a new leg up?
Share your thoughts in the comments 👇

DEXE ANALYSIS📊 #DEXE Analysis
✅There is a formation of Descending triangle pattern on daily chart 🧐
Pattern signals potential bullish movement incoming after a breakout.
👀Current Price: $14.68
🚀 Target Price: $18.50
⚡️What to do ?
👀Keep an eye on #DEXE price action and volume. We can trade according to the chart and make some profits⚡️⚡️
#DEXE #Cryptocurrency #TechnicalAnalysis #DYOR

$RATS Heating Up — 100% Move on the Table?$RATS – Pressure Building, Breakout Imminent
$RATS is quietly loading up for a massive breakout. Price has been grinding higher with strong demand stepping in at every dip — support structure is holding beautifully.
🧠 Key Observations:
Clean ascending structure
Consistent higher lows
Testing a major resistance zone
Volume creeping up = Accumulation signs
📈 Breakout Potential:
Once $RATS clears this resistance zone, the chart opens up for a sharp move — a 100%+ pump is well within reach based on the current range.
📌 What I’m watching for:
Break & close above resistance
Volume confirmation on breakout
Retest = entry zone for momentum chasers
The structure’s solid, the risk is tight, and the upside is explosive. Eyes on $RATS — the move could be BIG.Image

CYBER ANALYSIS🚀#CYBER Analysis : Pattern Formation
🔮As we can see in the chart of #CYBER that there is a formation Inverse Head And Shoulder Pattern and it's a bullish pattern. If the candle breaks and sustain above the neckline then a bullish move could be confirmed✅
🔰Current Price: $1.290
⚡️What to do ?
👀Keep an eye on #CYBER price action. We can trade according to the chart and make some profits⚡️⚡️
#CYBER #Cryptocurrency #TechnicalAnalysis #DYOR

Hidden Bullish Divergence +Hidden Bullish Divergence +
Closing above 298 is a +ve sign.
Immediate Support can be around 283 - 287.
Breaking 272 may bring more
selling pressure towards 246 - 250.

Link/USDT"This is Link . Based on the daily timeframe, we’re in an uptrend aiming for the targets you can see. If you enjoy this kind of analysis, make sure to like and subscribe to our channel!"


Bullish
Bullish Divergence on Daily tf.
Immediate resistance is around 83 - 83.50
Very important to cross & sustain 86 - 87
for further upside.
However, should not breakk 65.50 , otherwise
we may witness further selling pressure.

LONG ON GBP/NZDGBP/NZD is respecting a major support zone and is currently ready to rise.
I will be buying GBP/NZD to the previous swing high looking to catch 200-300 pips throughout the rest of the week.

PCBLi Observed these Levels based on Price Action and Demand & Supply which is my own Concept "PENDAM CONCEPTS"... Please don't take any trades based on this chart/post... Because this chart is for educational purpose only not for Buy or Sell Recommendation... Thank Q

Buy with SLCan buy with SL 0.03454
TP 0.03480
Crossing & Sustaining 0.03509
may lead it towards 0.0565

Short-Term Trade Setup: NZDCAD Eyes 0.82898–0.83110 TargetsGood day Traders,
Trust you are well.
Below is my analysis of NZDCAD.
Overview:
NZDCAD is retracing from the recent high at 0.83050, currently trading around 0.82628. Price action is approaching a key support zone between 0.82470 – 0.82285, an area that previously triggered bullish reactions. Momentum indicators are showing bearish pressure, with red histogram bars visible on the chart.
Idea:
Although bearish momentum is present, the histogram shows a slight decrease in selling pressure, hinting at a potential slowdown in the current downtrend. If the pair holds above the 0.82287 level, it could signal a potential reversal or bounce. This would open room for bullish targets at: 0.82898, 0.83039 and 0.83110.
However, a confirmed break below 0.82287 could expose the next support around 0.82100.
Conclusion:
The pair is at a critical support zone, with decreasing momentum suggesting that sellers may be losing strength. A bounce from current levels could provide a short-term buying opportunity, while a break below 0.82287 would invalidate the bullish outlook.
Cheers and happy trading!

$KILO Setup Looks Prime — This Could Just Be the StartTSX:KILO is showing real strength right now.🚀
Price broke out of a clean downtrend and reclaimed the horizontal support zone. That reaction from buyers? Strong and confident.
The chart offers two clear scenarios, but both point to the same thing: more upside ahead.
Targets? $0.057 and $0.08 are on the radar.
The structure’s bullish, and momentum is shifting fast.
Looks like TSX:KILO is just getting started.
DYOR, NFA
