This AI-Backed IPO Is Just Warming Up — Next Stop: 86% Gains?CoreWeave is showing classic IPO 'honeymoon phase' price action, with early liquidity swept and bullish structure forming.
🔍 Price swept the daily sell-side liquidity at $35.70
📈 Now pushing higher — next major buyside targets at $55.04 and $65.22
🤖 Backed by NVIDIA, adding serious momentum and credibility
🧠 Expecting strong continuation as institutions begin to build exposure
If price maintains structure, this could be one of the strongest IPO moves of 2025.
Longsetup

OG ANALYSIS🔮 #OG Analysis 🚀🚀 Update
💲 #OG is trading in a Rising Broadening Wedge Pattern and currently retesting the major support zone. Now we can expect a bullish move after the retesting of support zone.
⁉️ What to do?
- We have marked crucial levels in the chart . We can trade according to the chart and make some profits. 🚀💸
#OG #Cryptocurrency #DYOR

Extremely Bullish.
Extremely Bullish.
Took Support from a very Important level around 136 - 140.
Hidden Bullish Divergence has appeared.
176 - 182 is a Resistance Zone.
Crossing & Sustaining 201, lead it towards 235 - 237.
On the flip side, 170 & 161 - 162 seems to be a Good Support level.

$UNH Rinse & Repeat Round #2- Fundamentally it's undervalued for the quality blue chip company. My detailed analysis is on the older post I made earlier this year. I have attached that as a reference.
- In my previous swing, I bought NYSE:UNH on a sell off @ 441 and sold @600 before earning as a de-risking strategy. I'm glad that it did work out.
- I'm happy that NYSE:UNH is again trading at a discount and with compressed Earning multiple. This time I am buying it even lower than where I bought last time i.e 441 and I was happy with that price average.
- Whereas I do believe that NYSE:UNH EPS is lowered but it is lowered slightly which doesn't warrant a big sell off like this.
- I wanted to wait further before entering but I can't stop myself from buying this name NYSE:UNH at a price where I believe it's very undervalued.
- Therefore, I have re-entered the NYSE:UNH and added it to my portfolio . I will consider adding further if selling pressure continues because I don't want to time the bottom.
- But undecisive market and lumpy market, going with a defensive name like this is a no brainer.

TAO/USDT – Long Setup ActivatedA potential bottom might be in place here.
🔍 Key confluences:
– Strong CVD rebound (spot + futures)
– Funding rate turning positive
– Top traders ratio shifting bullish (smart money buying the dip)
– Open Interest stabilizing after a clean flush
– And above all: my Scalp Cloud Signal just fired a bullish confirmation ✅
🎯 Targeting a short-term move to the 365–373 zone.
SL clearly defined below the local sweep.
💡 Tool used: Scalp Cloud Signal by The Degen Company
— Precision tool for scalping and micro trend shifts.

ETH ANALYSIS🔮 #ETH Analysis 🚀🚀
💲💲 #ETH is trading between support and resistance area. There is a potential rejection again from its resistance zone and pullback from trendline. If #ETH sustains above major resistance area then we will a bullish move till its major resistance area
💸Current Price -- $1,755
⁉️ What to do?
- We have marked crucial levels in the chart . We can trade according to the chart and make some profits. 🚀💸
#ETH #Cryptocurrency #DYOR

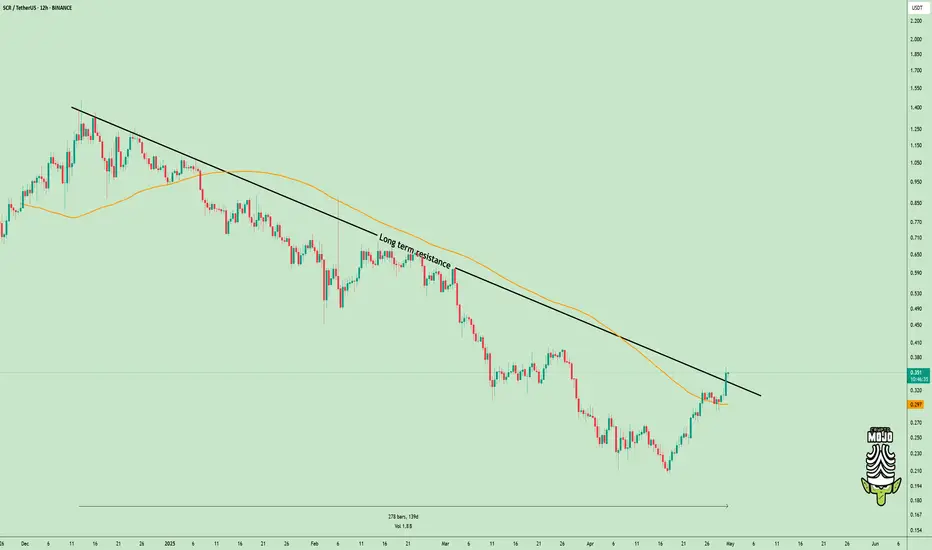
Downtrend Over? $SCR Just Flipped the Script!TSX:SCR just broke out after moving down for 139 days.
This isn’t just another pump, it’s a change in direction.
- Price broke the long-term downtrend
- Jumped above the 200 EMA
- Now testing the breakout zone again
If this area holds, bulls could take control and push higher.
It’s a clean setup, don’t ignore it.
DYOR, NFA
#ALTSEASON
HH HLMonthly Closing is good.
Weekly closing above 29.50 would
be very positive sign.
32 is the Immediate Resistance &
if 36.10 is Crossed & Sustained with
Good Volumes, we may witness 40 - 45.

ZEC ANALYSIS🔮 #ZEC Analysis
🌟🚀 As we said earlier #ZEC moved around 20%. Right now #ZEC is trading in an Ascending Triangle Pattern and here we can see that #ZEC moving again towards its neckline. We see see more bullish move in upcoming days
🔖 Current Price: $36
⏳ Target Price: $46
⁉️ What to do?
- We have marked crucial levels in the chart . We can trade according to the chart and make some profits. 🚀
#ZEC #Cryptocurrency #Breakout #DYOR

Bitcoin Upward Move Is Near
Bitcoin looks like it will have a temporary correction to the upside and then move higher after the interest rate announcement. The $110,000 mark is the main resistance that will be examined in the following analysis.

USDJPY 4h Long Setup | Low Risk High Reward Market broke the descending structure with strong bullish impulse followed by higher lows respecting new trendline
Price retested the previous resistance now turned support zone with a bullish reaction
Entry is taken after confirmation of the retest holding and bullish continuation signs
Entry : 142.494
SL : 140.676
TP : 148.270
RR 1 : 3.2
Price action aligned with short-term bullish reversal structure and clear demand zone defense
Let price do the work

AXS/USDT
AXS has been trading within a falling wedge pattern—a classic bullish reversal setup. Recently, the price broke above the upper resistance line of the wedge, indicating a potential trend reversal.
This breakout is supported by a long-term downtrend losing momentum, and a breakout confirmation through a retest may be forming. If the breakout holds, we could see a bullish move toward the next key resistance zone around 6.50 USDT, which is our primary target.
📌 Setup Summary:
Pattern: Falling Wedge (Bullish)
Breakout: Confirmed
Target: 6.50 USDT (TP)
Risk Management: Watch for price action near the retest zone
This setup aligns with our smart bot strategy which identifies breakout patterns and entry points automatically. Stay tuned for updates!

Stromm | S&P 500 & NASDAQ a RESISTANCE is NearThe S&P 500 and the Nasdaq are basically moving in lockstep right now — their structures look almost identical.
Starting with the S&P 500:
We’re currently trading into a 4-hour Fair Value Gap between $5,546 and $5,634, Sitting just under a 4-hour Order Block that could trigger a short-term reaction.
At the moment, though, it doesn’t really look like we’re going to flush all the way back down toward the $5,000 level (2-hour Order Block sitting much lower).
More likely?
This 4h Order Block just gives us a brief pullback, a minor reaction — and then price pushes higher again.
This would line up perfectly with my original scenario of Wave A completing around $4,805.
Personally, I’m already positioned around $4,800, so obviously, I'd love to see that level hold and price continue moving higher — ideally heading toward $6,000.
That would be the perfect extension — but nothing is guaranteed yet.
Still, structure right now leans bullish unless we see a sudden breakdown.
Now, for the Nasdaq CME_MINI:NQ1! :
Almost the same setup —
We have a 2-hour Order Block just above the current price, acting as short-term resistance,
And another 2-hour Order Block way lower, which now seems less likely to be tested unless something drastic happens.
So for the Nasdaq, the most realistic short-term scenario:
Hit resistance at the current 2h Order Block,
Maybe a small pullback toward 18,900–19,000,
Then continuation higher toward 20,000 or even 21,000 over the next few weeks.

Ethereum: The biggest Opportunity in 2025!Ethereum is following Bitcoin—but with way worse performance. While BTC is still holding up relatively well, ETH has dropped all the way back to March 2023 levels, wiping out the entire rally. Since its top, Ethereum is down over 63%. 😮💨
Still—or maybe because of that—I’m beginning to slowly scale into spot positions here.
Yes, we could fall further. I’ve got limit orders set lower, specifically around $1,260, which aligns with the 88.2% Fibonacci retracement and the midpoint of the monthly order block. That’s a key zone I’ll be watching if price keeps dropping.
That said, this Wave (2) should be nearing its final stage. The sell-off has been steep, and if we lose $804, that would flip Ethereum’s entire monthly structure bearish—a scenario I’d consider extremely negative.
I don’t expect ETH to suddenly blast past $5,000 from here, but at these levels, I see a clear opportunity to build longer-term spot exposure—and that’s exactly what I’m starting to do now.

Stromm | ETHEREUM No Life Signal YETCompared to Bitcoin, Ethereum is honestly still moving at a snail’s pace — and the performance is almost embarrassing at this point.
There’s still barely any strength showing on the CRYPTOCAP:ETH chart.
Yes, ETH has finally reclaimed the Previous Monthly Low, and it’s holding it — which is a positive step.
But let’s be real:
We’re still 83% below the Yearly Open — a mind-blowing distance when you consider how BTC is behaving right now.
I'm currently risk-free on my trade here, which is a nice position to be in.
If we get another drop, I plan to add at the next Monthly Order Block.
But something serious needs to happen at the Ethereum Foundation level — real fundamental shifts — if ETH is going to deliver the kind of rally people keep hoping for.
Otherwise?
Everything else in the market is outperforming ETH by a mile — and that’s the worst-case scenario for Ethereum:
It doesn't die,
It just gets left behind.
For now, at least I’m sitting in profit, and that's a good start.
Everything beyond this will need careful watching — no blind assumptions, no blind faith.
ETH needs to prove itself — and fast.

XAUUSD Downtrend Continues- Is 3,175 the Next Stop?OANDA:XAUUSD is currently trading within a well-defined descending channel, with price action consistently forming lower highs and lower lows. This structure reflects sustained bearish momentum, and sellers continue to dominate the overall direction.
The recent upward move appears to be a technical rebound, with price approaching a potential resistance zone near the upper boundary of the channel. This area may now serve as a supply zone after acting as previous support, making it an important region for potential rejection.
If the resistance holds, a rejection here could lead to the continuation of the bearish trend, with a potential move targeting the support area around 3,175, aligning with the lower boundary of the descending channel.
However, failure to hold below this level could invalidate the bearish scenario and increase the likelihood of a retest toward the upper boundary of the channel.
Traders should monitor for clear rejection signals at resistance, such as bearish engulfing candles or strong rejection wicks, or alternatively, wait for breakout confirmation before considering a trend shift. As always, proper risk management remains essential.

Price Action + Fundamentals Point to Dollar StrengthThe current market environment presents compelling evidence for a bullish move in the US Dollar Index (DXY). While some patience is required, the setup is increasingly favorable for the dollar to appreciate in the coming weeks and months.
Key Factors Supporting a Bullish Move:
Monthly Close Above 100.160:
A critical technical level to monitor is the monthly close above 100.160. If achieved, it would signal a strong bullish breakout, setting the stage for a continuation higher. Given current price action and market dynamics, this scenario looks highly probable. However, if the price fails to close above 100.160 and instead breaks below it, we could potentially start looking for short opportunities.
Bond Market Strength (30Y, 10Y, 5Y):
This past week, we witnessed notable strength across the US bond market. Yields declined as prices rose, typically a positive signal for the dollar as it reflects capital inflows into US assets.
COT Report Insights:
The Commitment of Traders (COT) report reveals a critical shift: commercial traders, often considered the "smart money," are beginning to accumulate long positions in the dollar. This change in positioning historically precedes significant bullish moves.
Seasonal Patterns:
Seasonality also favors the dollar during this period. Historically, the dollar tends to strengthen in the mid-year months, aligning perfectly with the current technical and fundamental landscape.
Targets:
Initial Target: 106.120
Given the accumulation signs and supportive macro backdrop, a move towards 106.120 seems very realistic.

$EBAY $80 EOYA non factor amongst tariff rhetoric. I think the idea of US consumers (even internationally) buying and reselling has never been higher. I think a lot of consumers will start to look for used goods more than ever. I'm eyeing $70 calls for earnings this upcoming week (first week of May 2025) and if it has any pull back I will load the boat for $80 call leaps. I like the structure it's held at this $55-$65 range. I expect new highs on this name maybe earnings can give it a jolt. All the lines you see are 20, 50, 200 SMA and EMA. I could be wrong on earnings as this name tends to dip from earnings even posting beats but that's the gamble of earnings but LONG TERM this name is a good buy. Charts are Monthly and Daily.
WSL.

BAT ANALYSIS🚀#BAT Analysis :
🔮As we can see in the chart of #BAT that there is a formation of "Falling Wedge Pattern". In a daily timeframe #BAT broke out the pattern. Expecting a bullish move in few days if #BAT retest the levels
⚡️What to do ?
👀Keep an eye on #BAT price action. We can trade according to the chart and make some profits⚡️⚡️
#BAT #Cryptocurrency #TechnicalAnalysis #DYOR

BTC long ideaBTC just touched the 4H trendline, also price looks like reversing since already stuck around this level for 12 hours. TP Daily liquidity at 98700-800. Swing tp 106.900.
Als matched with my 0.66 fib level, been sticking around there the whole day.

TAO ANALYSIS📊 #TAOAnalysis
✅There is a formation of Descending Channel Pattern in daily time frame in #TAO .
Also there is a perfect breakout and retest. Now we can expect a bullish move. If the price sustains the major resistance zone then we will see more bullish move
👀Current Price: $349
🎯 Target Price : $460
⚡️What to do ?
👀Keep an eye on #TAO price action and volume. We can trade according to the chart and make some profits⚡️⚡️
#TAO #Cryptocurrency #Breakout #TechnicalAnalysis #DYOR

Moonshot Ideas $CFLT > $40- We are entering era of Agentic AI which requires real time data and agent decides to take an action on that event in near real time.
- Confluent valuation is so cheap in a massive TAM and an exploding tailwind of AI Agents. I am seeing all the tech companies and startups are building AI Agents and apetite for real time data streaming capability, processing is required.
- NASDAQ:CFLT need to ride this wave and one way they could do is by making Apache Flink to natively support Python instead of just relying on Java. If they build sdk, python library which could do the heavy lifting when it comes to stream processing, transformation then NASDAQ:CFLT would be number one choice and popular among growing Python community and ML community.
- I wouldn't be surprised to see NASDAQ:CFLT well above 60 dollars in next 2-3 years.

BITCOIN AND ALT COIN ANALYSIS!I hope you guys enjoyed the video! If you have any questions or comments feel free to comment down below!
