Bitcoin’s Breakout Blueprint: Eyeing $92KAs of April 20, 2025, Bitcoin (BTC) is trading around $84,500, having recently tested the $92,000 level multiple times. This price point is significant, serving as both a psychological barrier and a technical resistance level.
Technical Analysis:
Resistance and Support Levels: Bitcoin has encountered resistance near $92,000, a level that has been tested repeatedly. A sustained move above this could open the path toward $100,000 and potentially $108,000, the previous all-time high from December 2024. On the downside, support is observed around $85,650, aligning with the 200-day EMA. Further support lies at $78,000 and $74,500, marking previous consolidation zones.
Chart Patterns: The formation of a bullish pennant on the daily chart suggests potential for an upward breakout. If confirmed, this pattern could propel BTC toward $137,000 by Q3 2025.
Volume and Momentum: Recent trading volumes have been moderate, with a slight uptick during price advances, indicating growing buyer interest. Momentum indicators, such as the RSI, are neutral, leaving room for further price movements in either direction.
Fundamental Factors:
Institutional Inflows: Significant capital inflows into Bitcoin ETFs, exceeding $70 billion, have been observed, reflecting strong institutional interest.
CryptoRank
Macroeconomic Environment: Liquidity injections by the U.S. Treasury, amounting to $500 billion since February 2025, have increased market liquidity, which historically correlates with Bitcoin price appreciation.
Halving Effect: The April 2024 Bitcoin halving event has reduced the supply of new BTC, a factor that has historically led to substantial price increases in subsequent months.
Mid-Term Outlook:
Considering the technical and fundamental factors, Bitcoin's mid-term target remains at $92,000. A decisive break above this level could lead to a retest of the $100,000 psychological barrier and potentially higher targets. However, failure to maintain support above $85,650 may result in a consolidation phase or a retest of lower support levels.
Investors should monitor key resistance and support levels, institutional investment trends, and macroeconomic indicators to assess Bitcoin's trajectory in the coming months.
Longsetup

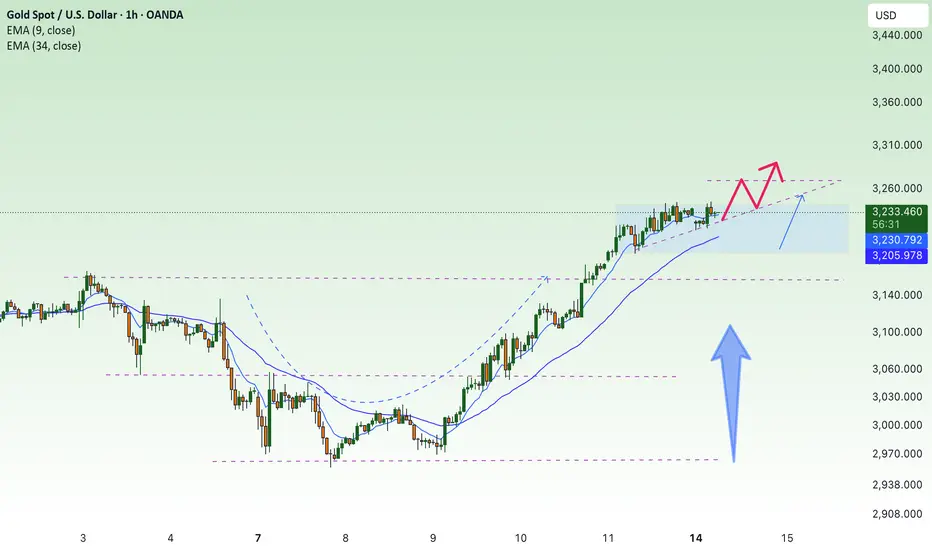
Gold bull cycle continues, 3400✍️ NOVA hello everyone, Let's comment on gold price next week from 04/21/2025 - 04/25/2025
🔥 World situation:
Gold prices are poised to close the week on a strong footing, gaining over 2.79% as the precious metal surged nearly $90 amid continued US Dollar (USD) weakness driven by lingering global trade uncertainties. At the time of writing, XAU/USD is trading around $3,326.
Despite touching a fresh all-time high of $3,358, the rally has cooled slightly as traders lock in profits ahead of the extended Easter weekend, with both European and US markets closed. Meanwhile, real yields have ticked higher, offering a modest headwind. On the policy front, San Francisco Fed President Mary Daly noted that the US economy remains resilient, though some segments are showing signs of slowing. She emphasized that monetary policy is still restrictive enough to keep inflation in check, while also suggesting that neutral rates could be on the rise.
🔥 Identify:
Gold price is still in a big uptrend, short-term corrections only make gold price accumulate more and continue to reach new ATH, tariffs are tense, gold price continues to increase strongly: 3382, 3400
🔥 Technically:
Based on the resistance and support areas of the gold price according to the H4 frame, NOVA identifies the important key areas as follows:
Resistance: $3357, $3382, $3400
Support : $3284, $3236, $3155
🔥 NOTE:
Note: Nova wishes traders to manage their capital well
- take the number of lots that match your capital
- Takeprofit equal to 4-6% of capital account
- Stoplose equal to 2-3% of capital account
- The winner is the one who sticks with the market the longest

NZDCHF LONGi enter NZDCHF long, i see trend line brake on 4h, bullish divergence on RSI. on 4h i dont see trend brake yet so that is why i put SL on prevous DAILY level.
On daily looks like bullish divergence on Stochastic but not so clear.
will see how this will work out.

$SHAK at a $80 support, buy areaHello, looking at the Daily and Weekly, the Elliot Wave seems to be finishing up and I think this name got sold off from highs like everything else but a good name nonetheless. Fundamentally and technically name looks good for long setup to the $90s then $100.
WSL

3382 , next ATH number today, GOLD⭐️GOLDEN INFORMATION:
Gold price (XAU/USD) enters a phase of consolidation on Thursday, trading within a narrow range near its all-time high reached during the Asian session, as investors digest conflicting market signals. Stronger-than-expected US Retail Sales figures and hawkish remarks from Federal Reserve (Fed) Chair Jerome Powell have lent support to the US Dollar (USD), curbing some of gold’s upside momentum. Meanwhile, the upbeat sentiment across equity markets and mildly overbought technical conditions are prompting traders to remain cautious, limiting fresh buying interest in the precious metal for now.
⭐️Personal comments NOVA:
Gold price continues to increase today, the fomo still has no end, pay attention to the new ATH price zone 3382
⭐️SET UP GOLD PRICE:
🔥SELL GOLD zone : 3381- 3383 SL 3388
TP1: $3370
TP2: $3355
TP3: $3333
🔥BUY GOLD zone: $3302 - $3300 SL $3295
TP1: $3310
TP2: $3320
TP3: $3330
⭐️Technical analysis:
Based on technical indicators EMA 34, EMA89 and support resistance areas to set up a reasonable BUY order.
⭐️NOTE:
Note: Nova wishes traders to manage their capital well
- take the number of lots that match your capital
- Takeprofit equal to 4-6% of capital account
- Stoplose equal to 2-3% of capital account

ABCD Pattern Intact
Monthly Closing above 388 would Trigger
more positivity towards 430 - 440.
465 is Important Resistance.
remember, Crossing & Sustaining 465 with
Huge Volumes may exposes New Highs towards
600+
However, it should not break 320 in
worst case.

US30 Long 15 & 5 min
BLACKBULL:US30
We can see 2 relatively equal lows, which to my opinion may get swept to fill the fair value gap below, and then react to the point that we sweep the swing high
#PARTIUSDT is showing signs of a reversal🚀 The price BYBIT:PARTIUSDT.P is showing signs of a reversal after a prolonged downtrend.
🚀 The scenario becomes more likely if the price holds above $0.1520 with increasing volume.
🚀 Watch for a breakout and confirmation above the $0.1500–$0.1520 zone — this would strengthen the bullish setup.
🚀 If volume picks up during the continuation of the move, a quick push toward $0.18 is possible.
📈 LONG BYBIT:PARTIUSDT.P from $0.1533
🛡 Stop loss: $0.1492
🕒 Timeframe: 1H
✅ Overview:
➡️ The price has broken out above the Bearish Flag, confirming a break in the downtrend structure.
➡️ The Double Bottom formation increases the likelihood of an upward move.
➡️ Entry at $0.1533 is just above the resistance zone and confirms the breakout.
➡️ The upward potential remains toward $0.1600 and beyond, aiming for the POC volume area.
🎯 TP Targets:
💎 TP 1: $0.1555
💎 TP 2: $0.1575
💎 TP 3: $0.1600
📢 Support zone: $0.1500–$0.1510 — must hold to maintain the bullish structure.
📢 If price consolidates above $0.1555, expect a potential acceleration toward $0.1600.
📢 A drop below $0.1492 invalidates the scenario — stop is mandatory.
🚀 BYBIT:PARTIUSDT.P breaks key level — bullish signal confirmed! Watch for continuation!

TESLA | Weekly HTF TargetAfter having a deep retracement ~70% tesla looks ready to reach Higher Highs...
New High target: $490+

DCBBank, 1DBreakout from Pattern is very Good ,
Can Enter if you u want to take Small Risk than Usual , then you can consider
Actually it is Bit late Entry or you can Avoid it if your risk is high
Follow for more Swing Ideas Like this

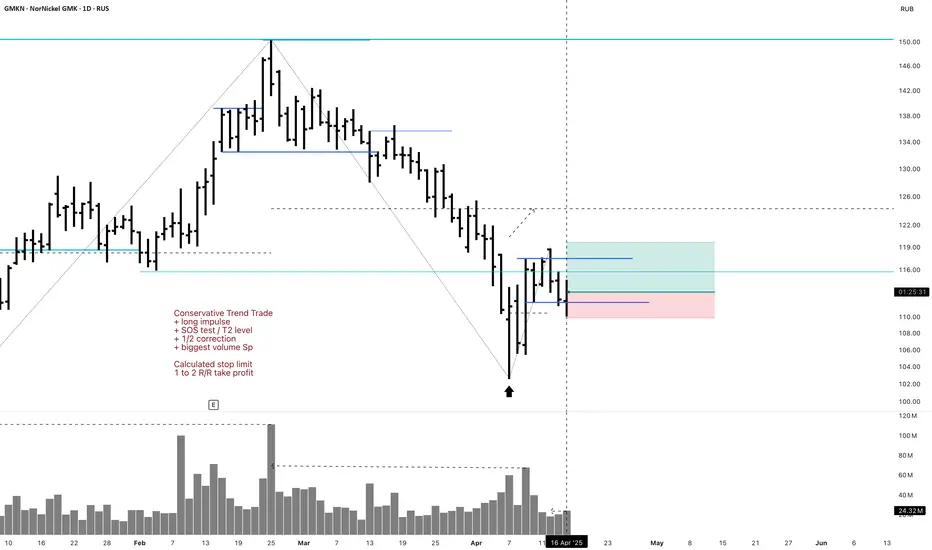
GMKN Long 1D Investment Conservative Trend TradeConservative Trend Trade
+ long impulse
+ SOS test / T2 level
+ 1/2 correction
+ biggest volume Sp
Calculated stop limit
1 to 2 R/R take profit
Monthly Trend
"+ long impulse
- SOS reaction bar level
+ 1/2 weak correction"
Yearly Trend
"+ long impulse
- below SOS
+ 1/2 correction"
A break back above 530 could trigger a move toward 550Look for a strong move higher if the market breaks back above 530. Currently falling on below average volume and could see the market recover abruptly.

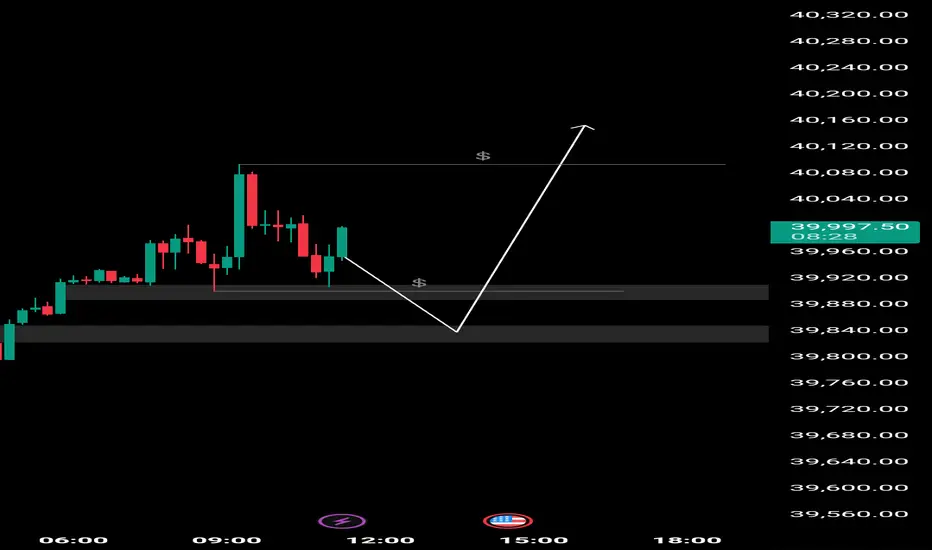
Waiting for a big boost for the market, over 90K BTC💎 BTC PLAN UPDATE (April 16)
First of all, congratulations to the investors. Everything went according to our trading plan and we had very good comments. Specifically, yesterday the price fell from the 86k area straight to 83k. We had more than 3000 prices together. Today's BTC trading plan did not change much.
NOTABLE NEWS ABOUT BTC:
According to Bloomberg, Bitcoin (BTC) mining hardware manufacturer Bitdeer is preparing to launch its own mining operation in the United States (US). The company intends to speed up the shipment of equipment following President Donald Trump's announcement of a 90-day tariff suspension. In addition, the pressure from tariffs has led to a decrease in Bitcoin mining hashrate among miners in the United States over the past month.
TECHNICAL VIEW
Bitcoin has faced multiple rejections around the 200-day exponential moving average (EMA) at $85,000 since Sunday. On Tuesday, BTC attempted to break above this level but was rejected and fell 1.12%. At the time of writing on Wednesday, the price was hovering around $83,500.
If BTC closes above $85,000 on a daily basis, it could extend its rally to the psychologically important $90,000 level. A successful close above this level could extend the rally to test the March 2 high of $95,000.
Please continue to pay attention to the 84.2k resistance zone, this is an important resistance zone before we DCA to higher and more important areas
==> Comments are for reference only. Wish investors successful trading

OIL go UPWTI crude oil has recently shown signs of stabilizing after a period of volatility driven by geopolitical tensions and shifting demand expectations. While supply concerns and OPEC+ decisions continue to influence price movements, the broader macroeconomic indicators—such as signs of a soft landing in the U.S. economy and resilient global demand—are starting to create a more bullish environment.
In my view, WTI is likely to start strengthening from current levels. The technical setup suggests a potential reversal, with support holding and momentum indicators turning upward. If prices break above key resistance zones, we could see a sustained move higher.
Overall, I believe it's a good time to consider a long position on WTI.

XRP - Choppy Market, Will We See $1.5 Again?After finishing the 5-wave structure in early 2025, XRP had a rough patch, trading between $3 and $2 and offering some pretty neat swing trade opportunities. Now, two months later, the big question is: will this range continue, or is a breakout on the horizon? Let’s break down the key levels and high-probability setups.
Short Trade Setup
Resistance Zone:
The weekly level and the 0.618 Fibonacci retracement are both around $2.5763 to $2.5792, aligning nicely with each other.
The anchored VWAP from the all-time high at $3.4 adds extra resistance at about $2.63.
Setup Details:
A low-risk short trade can be considered at the weekly level, with a stop-loss set above both the anchored VWAP and the swing high.
Target: The monthly open, aiming for an R:R of about 4:1.
Support Backup:
Additional support in this range comes from the 0.618 Fibonacci retracement (from a low at $1.9 to a high at $2.59), the weekly 21 SMA at $2.28, and a weekly level at $2.0942 just below the monthly open.
This support between the weekly level at $2.0942 and the monthly open is crucial for maintaining bullish momentum. If it holds, the bearish short setup stands; if it breaks, things could get tricky.
Long Trade Setup
When to Consider a Long:
If the support zone mentioned above fails, look for a long trade opportunity at the swing low around $1.77.
Support Confluence:
Primary Support: The swing low at $1.77, with lots of liquidity around that area.
Additional Layers:
The monthly level at $1.5988.
The weekly level at $1.5605 sits just below the monthly.
The 0.618 Fibonacci retracement from the 5-wave structure at $1.5351.
Anchored VWAP from the low at $0.3823, aligning with the weekly level.
And don’t forget the psychological level at $1.5.
Setup Details:
This long trade setup would offer an attractive R:R of roughly 6:1, targeting back to the monthly open for an approximate 33% gain, with a stop-loss placed below the $1.5 mark.
XRP's current trading range has provided some good short and long trade setups, a long opportunity at the swing low ($1.77-$1.5) could be the next big play. Whether you lean towards short or long, finding these confluence zones helps in making more informed, high-probability trade decisions.
If you found it helpful, please leave a like and a comment. Happy trading!

HEG Limited Stock Analysis [Fundamental+Technical]Company Overview:
Industry: Graphite Electrodes (used in Electric Arc Furnaces for steel production)
Parent Group: LNJ Bhilwara Group
Location: Largest graphite plant at a single location near Bhopal, MP
Global Reach: 67% export-based; presence in 35+ countries
Business Highlights
Products: UHP & HP Graphite Electrodes
Customers: Top 25 global steel companies
Capacity: Increased to 100,000 TPA in Nov 2023
Utilization: 81% (despite global slowdown)
Revenue from Operations: ₹2,394.90 Cr
Net Profit: ₹231.54 Cr (down 49% YoY)
EBITDA: ₹525.63 Cr (down 28% YoY)
EPS: ₹59.99
Net Cash Flow from Operations: ₹615 Cr (up from ₹114 Cr)
ROCE: ~7.2%
Return on Net Worth (RoNW): 5.63%
📈 Technical Insights:
Current Price: ₹474.60
50 EMA: ₹431.44 (support zone)
200 EMA: ₹429.40 (support zone)
Price is trading above both EMAs, indicating a bullish trend reversal.
Golden Cross formation (50 EMA crossing 200 EMA) recently occurred — a classic long-term bullish signal.
The stock bounced from ₹400 zone and now forming higher highs.
Key Strengths
One of the lowest-cost graphite electrode producers globally
Among top 5 global players (ex-China)
Strong relationships with major steelmakers
Backward integrated captive power: 76.5 MW
State-of-the-art technology and high R&D focus
Key Risks
Highly dependent on steel sector demand
Pricing pressure due to global oversupply and China's export surplus
Needle coke (key raw material) cost volatility
Current underutilization of capacity
Growth Triggers
Green Steel Push: EAF-based steel production expected to grow globally
Anode Powder Plant: ₹1,800 Cr investment in 20,000 TPA facility for EV battery anode materials; revenue expected from FY27
India’s EV & Steel Boom: Growing steel consumption (8.2% CAGR) and EV transition are long-term positives
SWOT Summary
Strengths:
Global presence, high export revenue, low-cost structure
Technological leadership
Weaknesses:
Profitability linked closely to global steel demand
Volatility in raw material prices
Opportunities:
EV market and EAF steel expansion
Threats
Competition from China, diversion of raw material to battery sector
Future Outlook
Near-term challenges due to soft steel demand
Medium to long-term outlook is strong, driven by:
Increasing EAF penetration
Global decarbonization policies
Strategic expansion into EV-grade graphite anodes
Analysis Based on Valuation + Chart
CMP:₹474.60
Fair Price Range: ₹600 – ₹1200(Using a conservative P/E range of 10 to 20)
Fair Value (DCF):₹1100+ (Based on 10% projected EPS growth over 5 years and a 12% discount rate.)
Support Levels:₹430 (EMA), ₹400 (price action)
Resistance Zones:₹490-500 (near-term), ₹600 (supply zone)
Disclaimer
The information provided in this report is for educational and informational purposes only and should not be construed as financial or investment advice. While every effort has been made to ensure the accuracy of data and analysis, no guarantees are made regarding future performance. Stock market investments are subject to market risks, including potential loss of capital. Please consult your financial advisor or conduct your own due diligence before making any investment decisions.

ABFRL , 1D Looking Very good pattern and ready for Breakout and Nifty is also Showing Bullishness , So Breakout will be very Clear and Good
Take Entry after the break of upper trendline and risk according to your risk taking capacity
in Expansion Channel this is channel Pattern and Breakout in 1D time Frame .
just risk 3-4 % of your allocation and Aim for 30% Maximum . You can book partial profits if it goes above 15% .
if it closes below the down trendline , you must be not in the trade
This is Just my point of View only
Follow for More Swing Trade Ideas


SOL Bulls Strike Back — But Is It Sustainable?Solana continues to respect technicals with precision — after a +42.9% move from the $95 low, we're now at a pivotal moment in price structure. Let’s break down what’s happening and where the high-probability setups lie.
📍 Key Bounce Zone – Golden Pocket Confluence
Local Low: $95.26
Golden Pocket Zone (0.618–0.666): $97.09–$94.82
This area acted as a major demand zone, with price sharply rebounding.
First Volume Spike: Followed by retracement into Golden Pocket Zone at $102.
Second Volume Spike: Occurred right after touching Anchored VWAP ($108.21) from the $95.26 low, which added beautiful confluence with the Golden Pocket Zone – a secondary high-conviction long entry.
📈 Rally to Resistance – Short-Term Climax
After the anchored VWAP retest, SOL rallied into the key resistance zone aligned with the 0.786 Fib retracement from the previous down move — a historically reactive level and a prime profit-taking zone.
Monthly 21 EMA ($135.83) and the monthly 21 SMA ($133) — both key dynamic resistance zones.
Low-volume retest of that key high suggests buyer exhaustion, not continuation — a classic setup for a short-term reversal.
🧭 Current Market Structure
Current Price Action: Trading above both the weekly open ($128.38) and the monthly open ($124.54).
This forms a critical S/R zone between $124–$128, now acting as a potential battleground for bulls and bears.
As long as price stays above this zone, momentum remains with the bulls.
🔍 What to Watch Next – Reclaim or Reject?
Key Support to Watch:
$125 (psychological level) and monthly open at $124.54 – This zone is likely to be liquidity-hunted. Expect a sweep of this low, look for the reaction.
Daily Support Confluence: currently at 21 EMA: $123.77 & 21 SMA: $123.27
1.) 📈 Scenario A – Bullish Reclaim:
If SOL sweeps the low and shows strong buying reaction (bullish engulfing candle, volume spike), it sets up a potential long opportunity towards the weekly open, to watch for the next reaction.
2.) 📉 Scenario B – Failed Hold:
If there's no bullish reaction at $124–$125, expect further downside.
First target = $122
Second target = $120.65
🎯 Tactical Game Plan
Bulls:
Watch for reaction at $124–$125 – potential scalp long with tight SL.
Confirmation on volume expansion and break of $128.38 for continuation.
Re-enter long after clean retest of weekly open from above.
Bears:
Short setup possible if weekly/monthly open is broken and retested as resistance.
First TP = $122, second TP = $120.65.

ALRS 1D Long Investment Aggressive CounterTrend TradeAggressive CounterTrend Trade
- short impulse
+ volumed T1
+ support level
+ biggest volume Sp
+ weak test
+ first bullish bar close entry
Calculated affordable stop limit
Take profit
1/3 - 1 to 2 R/R
1/3 - 1D T2 / 1M T2
1/3 - 1/2 of 1Y
Calculated affordable stop limit
Take profit
1/3 - 1 to 2 R/R
1/3 - 1D T2 / 1M T2
1/3 - 1/2 of 1Y
Monthly CounterTrend
"- short impulse
+ volumed TE / T1
+ support level
+ volumed Sp
+ test"
Yearly Trend
"+ long impulse
+ 1/2 correction
+ T2 level
+ support level
+ manipulation"

3270, waiting for new ATH gold price⭐️GOLDEN INFORMATION:
Gold prices eased during Monday's Asian session as risk sentiment improved, prompting a shift away from safe-haven assets. The upbeat market tone followed Wall Street’s strong rebound on Friday and encouraging developments in the ongoing US–China tariff dispute, temporarily reducing upward pressure on the yellow metal.
Last week, China retaliated against the US’s 145% tariff hike by imposing 125% duties on American goods but later signaled it would not respond to any additional escalations. Over the weekend, President Donald Trump floated the idea of targeting Chinese semiconductors and electronics with a separate 20% tariff—indicating a possible shift in strategy from across-the-board tariffs to more focused trade measures.
⭐️Personal comments NOVA:
Gold price, buying volume maintained, continuing the upward trend: 3260, 3270
⭐️SET UP GOLD PRICE:
🔥SELL GOLD zone : 3270- 3272 SL 3277
TP1: $3260
TP2: $3250
TP3: $3240
🔥BUY GOLD zone: $3168 - $3166 SL $3161
TP1: $3175
TP2: $3190
TP3: $3200
⭐️Technical analysis:
Based on technical indicators EMA 34, EMA89 and support resistance areas to set up a reasonable BUY order.
⭐️NOTE:
Note: Nova wishes traders to manage their capital well
- take the number of lots that match your capital
- Takeprofit equal to 4-6% of capital account
- Stoplose equal to 2-3% of capital account
The Spring of OM: Wyckoff Signals a Rebirth After the CrashMANTRA ( BYBIT:OMUSDT.P ) Technical Analysis: Post-Crash Recovery and Wyckoff Accumulation Insights
TradingView
On April 13, 2025, MANTRA (OM) experienced a significant price drop, declining approximately 88% within 24 hours. This sharp downturn was attributed to a combination of factors, including market-wide volatility and potential large-scale sell-offs. Despite this abrupt decline, technical indicators suggest that OM may be entering a Wyckoff Accumulation Phase, presenting potential investment opportunities.
Understanding the Recent Price Movement
Following the crash, OM's price stabilized around $0.70, with a 24-hour trading volume exceeding $2.3 billion. The Relative Strength Index (RSI) and Commodity Channel Index (CCI) indicators both entered oversold territories, indicating a potential for price reversal.
CoinMarketCap
CentralCharts
Wyckoff Accumulation Phase Analysis
The Wyckoff Method identifies specific phases in market cycles, with the Accumulation Phase characterized by large investors ("smart money") buying assets at lower prices. Key features of this phase include:
Selling Climax (SC): A sharp price decline with high volume, as seen in OM's recent drop.
TradingView
Automatic Rally (AR): A quick rebound following the SC, indicating initial buying interest.
Secondary Test (ST): Price revisits the SC level to test support, often with lower volume.
Spring: A false breakout below support levels to shake out weak holders, potentially observed in OM's price action.
Mudrex
Sign of Strength (SOS): A strong price increase with higher volume, signaling the end of accumulation.
Currently, OM's price behavior aligns with the early stages of this accumulation pattern.
Investment Considerations
For investors considering entry points:
Risk Tolerance: Given the recent volatility, only risk capital should be used.
Technical Confirmation: Await confirmation of the SOS phase before significant investment.
Volume Analysis: Monitor trading volumes for signs of increased institutional interest.
Understanding the Wyckoff Accumulation Phase can provide insights into potential market reversals.

EUR/NZDExpecting price to react off the levels that I marked, to continue higher, these levels I marked are aligned with my Fib levels.
