F 1H Swing Long Conservative Trend TradeConservative Trend Trade
- long impulse
- volumed T2
+ support level
+ 1/2 correction
+ biggest volume Sp
Calculated affordable stop limit
1 to 2 R/R take profit
Day Trend
"+ long impulse
+ 1/2 correction
- neutral zone
- context direction short"
Month CounterTrend
"- short impulse
+ 1/2 correction
- unvolumed T1
+ support level
+ long volume distribution
+ biggest volume manipulation"
Year Trend
"+ long impulse
+ volumed T2 level
+ volumed 2Sp+
+ 1/2 correction
+ weak test"
Longsetup

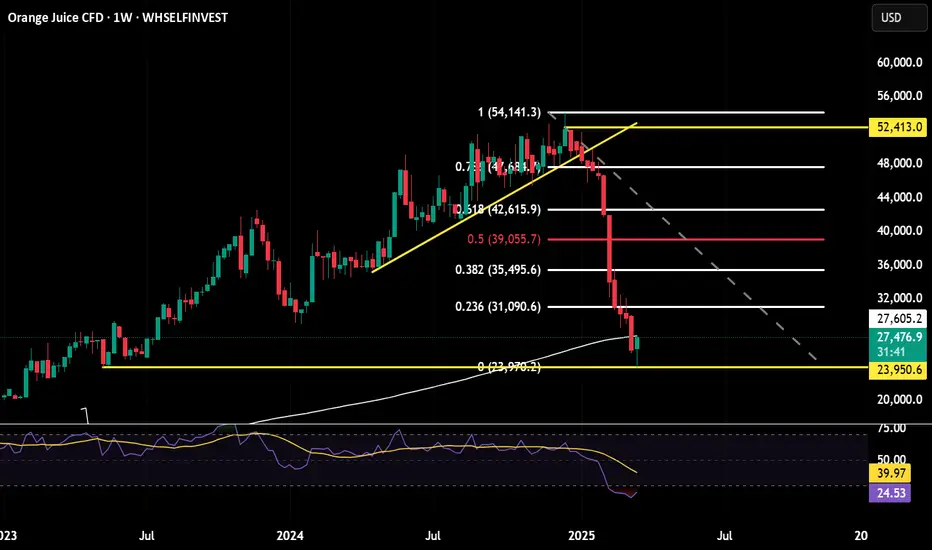
A good bounce inbound after this monster sell off on OrangeJuiceAfter this monster sell off I have been looking for a good entry on the smaller time frame for a bounce back up to the large consolidation area around the .618 retracement of the move down shown here on the weekly.
I think I have got that on Wednesday with an open lower followed by a nice impulsive move up. The positioning is set for a reversal, with speculators massively still short, on the technical side we have the RSI turning up on the weekly and already crossed over on the daily.
I am in from the Wednesday close and will be looking to add on the move up with good pull backs followed by rejections on the STF.
Invalid if Wednesdays low is taken.
Bullish Divergence on Weekly TF.Bullish Divergence on Weekly TF.
Seems like taking Support from a Very Important
fib. level around 10.30 - 11.40
Falling Wedge Pattern on Daily TF.
10.90 Should be Sustained on Monthly Basis, otherwise
we may witness further Selling pressure till 8.
Important Resistance is around 12.30 - 12.65 as of now.

S&P 500 Setting Up for a Breakout – But Not Before One More TrapAs I’ve said before, the FOREXCOM:SPX500 is a key reference for my crypto trading . That’s why I sat down and took a closer look at the chart – and I’m now ready to place a limit order , based on what I’m seeing.
I believe we’re still in a correction phase , and it’s far from over . However, I think it’s realistic that we’ll see a move toward $5,832 next week . Before that happens, I expect either today’s Monday Low or next week’s Previous Weekly Low to get swept, ideally triggering a dip into the 12-hour Fair Value Gap just below.
That’s where I see my entry zone forming. It’s also the exact area where Wave B overshoots the starting point of Wave ABC, making it a clean Flat correction pattern, with Wave C completing to the downside before we get a solid move upward.
I’m setting my stop-loss below the $5,500 low. If this setup plays out, I expect the S&P to push toward $5,832 , and after that, I’m anticipating a larger correction that could take the index back down to $5,500 or even $5,450 over the coming weeks.
Timing remains unclear for that move after, but the structure is here , and I’m looking forward to seeing how it plays out.


META to $740 - Chance for Strong BounceNASDAQ:META Meta has hit the trend line from November 2022 after a price loss of 20% and has shown with a first small bounce that it is still relevant. At the same time, the SMA200 is also at the same point. Last but not least, the 0.238 Fib is also located in this area (from the entire upward movement from November 2022). Technically, we can therefore definitely expect a bounce that could take us to the previous ATH at $739.
Fundamentally, Meta is also not overvalued due to its strong growth. As with many of the Mag7s, there are still problems with the AI strategy, which does not appear to be well thought out in either monetary or structural terms. However, Meta is a good candidate for actual efficiency gains due to its affiliation with the advertising market. However, the general growth is already reason enough to buy.
Support Zones
$580.00
$541.00
Target Zones
$740.00


HBAR ANALYSIS📊 #HBAR Analysis
✅There is a formation of Descending triangle pattern on weekly chart. Also #HBAR is trading around its low level. If the price sustains here and give a bullish move then we could expect a bullish move otherwise we would see more dip.
👀Current Price: $0.18230
⚡️What to do ?
👀Keep an eye on #HBAR price action and volume. We can trade according to the chart and make some profits⚡️⚡️
#HBAR #Cryptocurrency #TechnicalAnalysis #DYOR

WIF - Break Out!Dear My friends,
When looking at the WIF chart, I wonder, where is its bottom? The current price is even lower than when it was first listed on Binance. So, since I don’t know, I’ll just analyze it. And I’ll start from the bigger picture. When I zoom into the daily timeframe, everything seems clear to me. Take a look at the daily chart, and you’ll see that a divergence has appeared. The price is dropping, but the RSI indicator is rising. The price has broken out of the descending channel. Buying volume has been dominant in recent sessions. So, I’ve searched for target levels on the daily timeframe. I hope my analysis will help you, my friends.
Best Regards,

Start adjusting before April tariff policy ! XAU ✍️ NOVA hello everyone, Let's comment on gold price next week from 03/24/2025 - 03/28/2025
🔥 World situation:
Gold prices decline for the second consecutive day but remain on track to close the week in positive territory, despite a stronger US Dollar (USD) and profit-taking ahead of the weekend. XAU/USD is currently trading at $3,019, down 0.81%.
Market sentiment remains cautious, though US equities are paring earlier losses. Meanwhile, bullion stays on the defensive as the USD regains momentum, with the US Dollar Index (DXY) edging up to 104.05, marking a 0.24% increase.
🔥 Identify:
Gold prices are in a short-term downtrend in the H4 frame, adjusting at the end of March, accumulating before tax policies in early April 2025.
🔥 Technically:
Based on the resistance and support areas of the gold price according to the H4 frame, NOVA identifies the important key areas as follows:
Resistance: $3057, $3080
Support : $2982, $2910
🔥 NOTE:
Note: Nova wishes traders to manage their capital well
- take the number of lots that match your capital
- Takeprofit equal to 4-6% of capital account
- Stoplose equal to 2-3% of capital account
- The winner is the one who sticks with the market the longest

IS BTCUSD BULLSIH FROM HERE ?🚀 BTC/USD Trading Idea - Let's Catch This Move! 🚀
Hello, traders! This is my first BTC/USD idea here, and I’m excited to share my analysis with you all. I’ve been trading BTC/USD since 2020, and I created this platform to provide valuable market insights, free education, and profitable trade setups—all for free! 📈✨
Now, let’s dive into the technical breakdown
📌 Market Overview
🔸 Since Friday night, BTC/USD has been consolidating throughout Saturday.
🔸 We observed a liquidity sweep at 83,755 on the 30-minute timeframe.
🔸 According to my strategy, once lows are swept, we shift to the 1-minute timeframe to find a valid Change of Character (ChoCh).
📌 Trade Setup
✅ After spotting a valid ChoCh, we identified a strong Order Block (OB) at 83,741.
✅ Our entry point is at 83,755 with a tight stop-loss of 30 pips (83,441).
✅ The target is 84,541, offering a solid 1:2.5 RR ratio.
📊 Main Chart: A 30M timeframe marking the liquidity sweep, and a 1M screenshot showing our precise entry
🟢 Bias: Bullish
⚠️ Don’t forget to secure profits after +30 pips!
📌 Trade Details
📍 Buy Limit: 83,755
📍 Stop-Loss: 83,441 (-30 pips)
📍 Take-Profit: 84,541 (+80 pips)
Let’s bank some profits! 💰🔥 #BTCUSD #CryptoTrading #PriceAction #LiquiditySweep

#VANAUSDT is forming a confident bounce from key levels📉 LONG BYBIT:VANAUSDT.P from $8.180
🛡 Stop loss $8.000
1H timeframe
❗️Before entering the trade, closely monitor the levels. If the price consolidates above $8.180 with volume, this confirms the entry signal.
✅ Overview BYBIT:VANAUSDT.P :
➡️ On the chart, we can see that after a downward movement, the price formed a local bottom around $8.000, followed by an upward impulse.
➡️ A structure resembling a reversal pattern has appeared: the price broke through a slanted resistance (blue line) and consolidated above $8.180, indicating weakening sellers.
➡️ The price is now moving toward a resistance zone marked as POC (Point of Control) at $8.353, which could be the first target.
➡️ The entry is set at $8.180, aligning with the breakout level, supported by increasing volume and a short-term uptrend.
The volume profile on the left shows a low-liquidity zone above the current price (between $8.345 and $8.590), which may allow the price to quickly reach the TP levels.
🎯 TP Targets:
💎 TP 1: $8.345
💎 TP 2: $8.590
💎 TP 3: $8.775
⚡️ Plan:
➡️ Monitor the price reaction at TP1 ($8.345) — a pullback is possible. It’s recommended to close part of the position.
➡️ Wait for confirmation of the breakout above $8.180 (already happened, price is above).
➡️ Enter LONG after a retest (with volume) — in this case, the retest has already occurred, and the price is moving up.
➡️ Place the stop below the last low — at $8.000.
BYBIT:VANAUSDT.P is forming a confident bounce from key levels, and if it holds above the entry zone, we expect an upward movement!

#VICUSDT shows signs of reversal and strength📉 LONG BYBIT:VICUSDT.P from $0.2507
🛡 Stop loss $0.2470
🕒 1H Timeframe
📍 Important Note:
Wait for confirmation around the $0.2507 level. Enter the trade only if price holds above with volume.
✅ Overview BYBIT:VICUSDT.P :
➡️ The chart shows a completed Falling Wedge — a bullish reversal pattern that typically leads to an upside breakout.
➡️ After that, a Bearish Pennant formed but failed to push the price significantly lower, indicating weakness in sellers.
➡️ Currently, the price is breaking out of the triangle pattern, hinting at a possible bullish continuation.
➡️ Entry level marked at $0.2507, right after the breakout zone, supported by steady volume and short-term uptrend.
➡️ Volume Profile on the left reveals a low-volume zone above, making it easier for price to climb toward TP targets.
🎯 TP Targets:
💎 TP 1: $0.2525
💎 TP 2: $0.2545
💎 TP 3: $0.2565
⚡ Plan:
➡️ Monitor price reaction at TP1 — partial exit recommended.
➡️ Watch for confirmation above $0.2507.
➡️ Enter LONG after retest and volume confirmation.
➡️ Set stop loss below recent low — at $0.2470.
🚀 BYBIT:VICUSDT.P shows signs of reversal and strength — holding above the breakout zone could lead to upside movement!

Breakout ExpectedMonthly Closing above 18.40 will trigger
further upside.
Long Consolidation Breakout Expected.
Bullish on Weekly TF.
Hidden Bullish Divergence on Weekly TF.

AEGIS LOGISTICS Triangle Pattern• CMP: ₹800| Stop Loss: ₹750| Target:*900 | ₹1000
DISCLAIMER: I am NOT a SEBI registered advisor or a financial adviser. All the views are for educational purpose only.

BNB ANALYSIS🚀#BNB Analysis : Pattern Formation
🔮As we can see in the chart of #BNB that there is a formation Inverse Head And Shoulder Pattern and it's a bullish pattern. If the candle closes above the neckline then a bullish move could be confirmed✅️
🔰Current Price: $635
⚡️What to do ?
👀Keep an eye on #BNB price action. We can trade according to the chart and make some profits⚡️⚡️
#BNB #Cryptocurrency #TechnicalAnalysis #DYOR

F 5M Daytrade Long Aggressive Trend TradeAggressive Trend Trade
- short impulse
+ volumed TE / T1 level
+ support level
+ long volume distribution approach
+ biggest volume 2Sp+
- no test
Calculated affordable stop limit
1 to 2 R/R take profit before 5M T2
Hour Trend
"- long impulse
- volumed T2
+ support level
+ 1/2 correction
+ biggest volume manipulation"
Day Trend
"+ long impulse
+ 1/2 correction
- neutral zone
- context direction short"
Month CounterTrend
"- short impulse
+ 1/2 correction
- unvolumed T1
+ support level
+ long volume distribution
+ biggest volume manipulation"
Year Trend
"+ long impulse
+ volumed T2 level
+ volumed 2Sp+
+ 1/2 correction
+ weak test"

BNB/USDTBNB$ pascal hard fork today and holding well above the 200-day EMA.
_ Expect a 10%-20% pump from here.

3074 ! Next price zone, gold ATH reached⭐️GOLDEN INFORMATION:
Gold prices (XAU/USD) continue their consolidation phase into the European session on Thursday, as traders exercise caution amid slightly overbought conditions. Additionally, a prevailing risk-on sentiment limits the metal’s intraday advance to a new record high. However, downside risks remain contained due to lingering uncertainty surrounding US President Donald Trump’s aggressive trade policies and their potential ramifications for the global economic outlook.
⭐️Personal comments NOVA:
Bulls continue their excitement, pushing prices higher, amid global trade tensions.
⭐️SET UP GOLD PRICE:
🔥SELL GOLD zone: $3062 - $3064 SL $3067 scalping
TP1: $3058
TP2: $3050
TP3: $3040
🔥SELL GOLD zone: $3073 - $3075 SL $3080
TP1: $3065
TP2: $3050
TP3: $3040
🔥BUY GOLD zone: $3003 - $3001 SL $2996
TP1: $3009
TP2: $3015
TP3: $3023
⭐️Technical analysis:
Based on technical indicators EMA 34, EMA89 and support resistance areas to set up a reasonable BUY order.
⭐️NOTE:
Note: Nova wishes traders to manage their capital well
- take the number of lots that match your capital
- Takeprofit equal to 4-6% of capital account
- Stoplose equal to 2-3% of capital account

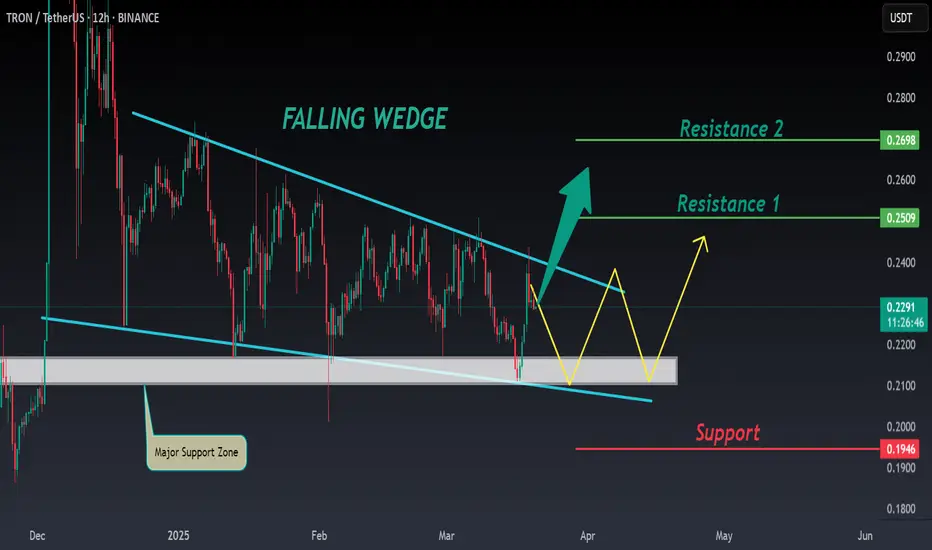
TRX ANALYSIS📊 #TRX Analysis
✅There is a formation of Falling Wedge Pattern on 12 hr chart and currently trading around its major support zone🧐
Pattern signals potential bullish movement incoming after a breakout
👀Current Price: $0.2290
🚀 Target Price: $0.2500
⚡️What to do ?
👀Keep an eye on #TRX price action and volume. We can trade according to the chart and make some profits⚡️⚡️
#TRX #Cryptocurrency #TechnicalAnalysis #DYOR
ONDO ANALYSIS 🔮 #ONDO Analysis 💰💰
🌟🚀In 1hr chart we can see a formation "Rising Wedge Pattern in #ONDO. There is a strong resistance zone near at $0.8840 and we could see a rejection from that level but if the price breaks the resistance zone then we would see a bullish move 💲💲
🔖 Current Price: $0.8640
⏳ Target Price: $0.9350
⁉️ What to do?
- We have marked some crucial levels in the chart. We can trade according to the chart and make some profits in #ONDO. 🚀💸
#ONDO #Cryptocurrency #DYOR #PotentialBreakout

Re-Testing of Breakout Level around 520.Re-Testing of Breakout Level around 520.
If Weekly Candle Closes above 520 - 521, we may
expect an Upside towards 550.
Also there is Bullish Divergence so we may
expect that it will play this time & push the price upside.
On the flip side, 500 - 504 is the Channel Bottom.
and Remember, Once 650 is Crossed with Good Volumes,
it may expose New Highs targeting around 700.

#BTC #BTCUSDT #BITCOIN #LONG #Scalp #Scalping #Eddy#BTC #BTCUSDT #BITCOIN #LONG #Scalp #Scalping #Eddy
BTCUSDT.P Scalping Long Setup
Important areas of the upper time frame for scalping are identified and named.
This setup is based on a combination of different styles, including the volume style with the ict style.
Based on your strategy and style, get the necessary confirmations for this scalping setup to enter the trade.
Don't forget risk and capital management.
The entry point, take profit point, and stop loss point are indicated on the chart along with their amounts.
The responsibility for the transaction is yours and I have no responsibility for not observing your risk and capital management.
Be successful and profitable.
