Re-Testing of Breakout Level around 520.Re-Testing of Breakout Level around 520.
If Weekly Candle Closes above 520 - 521, we may
expect an Upside towards 550.
Also there is Bullish Divergence so we may
expect that it will play this time & push the price upside.
On the flip side, 500 - 504 is the Channel Bottom.
and Remember, Once 650 is Crossed with Good Volumes,
it may expose New Highs targeting around 700.
Longsetup

#BTC #BTCUSDT #BITCOIN #LONG #Scalp #Scalping #Eddy#BTC #BTCUSDT #BITCOIN #LONG #Scalp #Scalping #Eddy
BTCUSDT.P Scalping Long Setup
Important areas of the upper time frame for scalping are identified and named.
This setup is based on a combination of different styles, including the volume style with the ict style.
Based on your strategy and style, get the necessary confirmations for this scalping setup to enter the trade.
Don't forget risk and capital management.
The entry point, take profit point, and stop loss point are indicated on the chart along with their amounts.
The responsibility for the transaction is yours and I have no responsibility for not observing your risk and capital management.
Be successful and profitable.

#TON #TONUSDT #TONCOIN #LONG #Scalp #Scalping #Eddy#TON #TONUSDT #TONCOIN #LONG #Scalp #Scalping #Eddy
TONUSDT.P Scaliping Long Setup
Important areas of the upper time frame for scalping are identified and named.
This setup is based on a combination of different styles, including the volume style with the ict style.
Based on your strategy and style, get the necessary confirmations for this scalping setup to enter the trade.
Don't forget risk and capital management.
The entry point, take profit point, and stop loss point are indicated on the chart along with their amounts.
The responsibility for the transaction is yours and I have no responsibility for not observing your risk and capital management.
Be successful and profitable.

#FARTCOINUSDT is showing bullish momentum📈LONG BYBIT:FARTCOINUSDT.P from $0.3590
🛡 Stop Loss: $0.3465
🕒 Timeframe: 1H
⚡️ Overview:
➡️ BYBIT:FARTCOINUSDT.P is showing bullish momentum on the 1-hour timeframe.
➡️ The price has recently broken through the resistance zone at $0.3590, which could serve as an entry point for a long position.
➡️ The chart shows an accumulation zone in the $0.3374–$0.3590 range, where volumes (visible on the volume profile to the left) indicate strong buyer interest.
➡️ The POC (Point of Control) is at $0.3462, confirming support below the current price.
➡️ The price is maintaining an uptrend structure: higher lows and highs are forming, and the breakout at $0.3590 is accompanied by increasing volumes, signaling bullish activity.
➡️ The #RSI (14) indicator on the 1H timeframe is at 65, indicating bullish momentum without being overbought, leaving room for further growth.
🚀 Plan:
➡️ Entry: Buy above $0.3590 after the 1-hour candle closes above this level to confirm the breakout.
➡️ Stop Loss: Set at $0.3465 (below the support zone and POC), which provides a 3.5% risk from the entry point and protects against false breakouts.
➡️ Risk/Reward Ratio: From 1:2 (for TP1) to 1:5.5 (for TP3), making this trade attractive from a risk management perspective.
🎯 Take Profit Targets:
💎 TP1: $0.3660
(nearest resistance level, +1.9% from entry)
💎 TP2: $0.3730
(zone of previous highs, +3.9%)
💎 TP3: $0.3790
(key growth target, +5.6%)
📢 A price consolidation above $0.3590 with sustained volume increases the likelihood of reaching the targets. The $0.3660 and $0.3730 levels may act as profit-taking zones, so monitor price action in these areas.
📢 Risks: If the price drops below $0.3465, it could signal a false breakout and a return to the consolidation zone of $0.3374–$0.3465. In this case, consider reassessing the position.
📢 Market Context: The rise of BYBIT:FARTCOINUSDT.P may be supported by the overall positive sentiment in the crypto market. As of March 19, 2025, BYBIT:BTCUSDT.P is trading steadily above $90,000, creating a favorable backdrop for altcoins.
BYBIT:FARTCOINUSDT.P is showing strength and potential for growth on the 1H timeframe. A confirmed breakout above $0.3590 is your signal to act! We expect a move toward the $0.3660–$0.3790 levels.

GM 5M Long Conservative Trend TradeConservative Trend Trade
+ long impulse
+ SOS level
+ support level
+ 1/2 correction
+ Sp
Calculated affordable stop limir
1 to 2 R/R take profit
1H Trend
"+ long impulse
+ volumed SOS test / T2 level
+ support level
+ 1/2 correction
+ biggest volume Sp
+ weak test
+ first buying bar closed"
1D CounterTrend
"- short balance
- unvolumed expanding T1
+ volumed 2Sp+
+ test"
1M Trend
"+ long impulse
- below 1/2 correction
+ SOS test level?"
1Y Trend
"+ long balance
- neutral zone"

ADBE to $465 - Chance for a BounceNASDAQ:ADBE ADBE, as well as other tech stocks, was beaten hard over the last couple of months. The earnings recently did not provide any relief for the chart either, although the figures were not particularly bad. In particular, the possible prospect of finally being able to expand and monetize Adobe's own AI “Firefly” continues to offer good opportunities.
With a PE of now under 20, Adobe has become quite favorable as a company that continues to grow well in the SaaS sector. It has also reached several technical support zones. We are at the lower edge of a very large bull flag that has been in place since the beginning of 2024. Horizontal support at $385 is also supportive. We have 3 large daily gaps in the chart above us and a bullish wedge within the flag. This is a good place to start buying for a possible bounce towards $465.
However, one must bear in mind that the overall market remains bearish. Purchases should therefore be closely hedged and not be too large. However, it would be wrong not to use this opportunity to enter the market.
Target Zones
$465.00
Support Zones
$385.00
$360.00

When will the gold price adjust down?⭐️GOLDEN INFORMATION:
Gold prices (XAU/USD) enter a phase of bullish consolidation near their record high, as traders take a cautious stance ahead of the highly anticipated Federal Open Market Committee (FOMC) policy decision on Wednesday. The consensus widely expects the Federal Reserve (Fed) to maintain the federal funds rate within its current range of 4.25% to 4.50%. Consequently, market attention will be centered on the Fed’s updated economic projections and Chair Jerome Powell’s post-meeting remarks, which could offer crucial insights into the future trajectory of interest rate cuts. These developments will be instrumental in shaping US Dollar (USD) movements and influencing gold’s next directional move.
⭐️Personal comments NOVA:
continue to grow, long term uptrend
⭐️SET UP GOLD PRICE:
🔥SELL GOLD zone: $3058 - $3060 SL $3065
TP1: $3050
TP2: $3040
TP3: $3030
🔥SELL GOLD zone: $3044 - $3046 SL $3049
TP1: $3040
TP2: $3030
TP3: $3020
🔥BUY GOLD zone: $3004 - $3002 SL $2997
TP1: $3010
TP2: $3020
TP3: $3030
⭐️Technical analysis:
Based on technical indicators EMA 34, EMA89 and support resistance areas to set up a reasonable BUY order.
⭐️NOTE:
Note: Nova wishes traders to manage their capital well
- take the number of lots that match your capital
- Takeprofit equal to 4-6% of capital account
- Stoplose equal to 2-3% of capital account

FIL: The Life-Changing Setup You Can’t Ignore!FIL has been in a massive 3-year accumulation, just like LINK before its explosive run. The setup is textbook perfect—and the window to get in won’t stay open forever.
Right now, FIL is at historical lows, setting up for a potential 600%+ move. If you're sleeping on this, you might be making a huge mistake. Don’t be that kind of stupid.
Entry: NOW
TP: 19
SL: 1.8

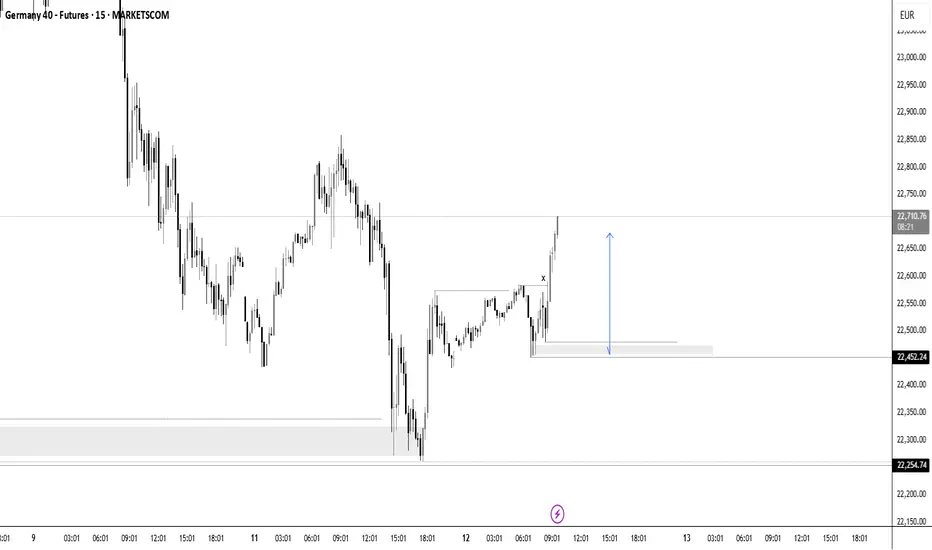
GERMANY40 LONG price reacting from a significant demand area . will be looking for longs targeting the high 23400. Drop a comment on what you think .
#API3USDT is setting up for a breakout📉 Long BYBIT:API3USDT.P from $0,8985
🛡 Stop loss $0,8543
1h Timeframe
⚡ Plan:
➡️ POC is 0,8185
➡️ Waiting for consolidation near resistance and increased buying activity before the breakout.
➡️ Expecting an impulsive upward move as buy orders accumulate.
🎯 TP Targets:
💎 TP 1: $0,9300
💎 TP 2: $0,9630
💎 TP 2: $0,9900
🚀 BYBIT:API3USDT.P is setting up for a breakout—preparing for an upward move!

RECREC Fut made Head & shoulder patterns on hourly charts with good OI build up & all indicators (ADX,RSI,MACD) suggesting long.
Could b bought with mentioned stoploss 395 & target (475)

Hidden Bullish Divergence appeared.Hidden Bullish Divergence appeared.
Breaking Out a long Consolidation Box around
145 - 149.
164 - 169 is a Strong Resistance zone.
If this Level is Sustained, we may witness
200+
However, if 135 - 136 is broken, more Selling
Pressure will be witness & it may drag the price
towards 113 - 115.

EURCHF is starting to turn upLooks like a trend reversal at last.
1. Strong pinbars from the levels below 0.92 that rob the stops.
2. A broken trend line, higher lows, higher highs
3. it is currently at a very important level,we are watching how it will react and whether it will be overcome.
4. We are now long on a larger time frame.

Why Invest in CONMED Corp (CNMD)?Why Invest in CONMED Corp (CNMD)?
Strong Earnings Growth – CONMED has experienced a remarkable increase in earnings, with EPS surging by 104% year-over-year and net income rising by 105% YoY. This indicates strong financial performance and profitability momentum.
Attractive Valuation – The stock is currently trading at a P/E ratio of 13.79, which is significantly lower than its historical averages. This suggests that CNMD may be undervalued relative to its past performance and industry peers.
Consistent Revenue Growth – The company reported revenue of $1.31 billion for the last year, marking a 5% increase compared to the previous period. This steady growth highlights CNMD’s ability to expand its market presence.
Improving Margins and Efficiency – CONMED has seen an increase in operating income (+66% YoY), operating margin (+58% YoY), and return on assets (+104% YoY), demonstrating better cost management and operational efficiency.
Dividend and Low Payout Ratio – The company pays a dividend of $0.80 per share, yielding approximately 1.35%, with a conservative payout ratio of 18.6%. This allows room for future dividend increases while maintaining financial flexibility.
Healthcare Sector Stability – As a medical technology company specializing in surgical devices, CONMED operates in a defensive sector that tends to be resilient during economic downturns. This provides investors with a level of stability.
Solid Balance Sheet and Liquidity – The company has a current ratio of 2.3, indicating strong short-term liquidity. Additionally, its quick ratio of 0.94 suggests it can cover its immediate liabilities effectively.
Final Thoughts:
CONMED presents a compelling investment case due to its strong earnings growth, attractive valuation, improving profitability, and stable position in the healthcare sector. However, potential investors should always consider market conditions and individual risk tolerance before making investment decisions.

Reasons to Invest in CVS Health (CVS)Reasons to Invest in CVS Health (CVS)
Strong Market Position
CVS Health is a leading healthcare company with a diversified business model, including retail pharmacies, insurance, and healthcare services. Its extensive network provides a competitive advantage.
Attractive Valuation
CVS is currently trading at a P/E ratio of approximately 12.23, which is lower than its historical average of 17.55. This suggests the stock may be undervalued compared to its long-term performance【41】.
Consistent Free Cash Flow (FCF)
The company generates significant free cash flow, which allows it to invest in growth, reduce debt, and return capital to shareholders.
Dividend and Shareholder Returns
CVS has a stable dividend policy with a payout ratio that allows for sustainable growth while reinvesting in the business【40】.
Resilient Business Model
The healthcare industry is defensive, meaning CVS can perform well even in economic downturns. The company benefits from consistent demand for prescriptions and healthcare services.
Future Growth Potential
CVS is expanding its healthcare services through acquisitions and technology-driven solutions. Investments in Medicare, pharmacy benefits, and digital health are expected to drive long-term growth.
Would you like a deeper fundamental comparison between CVS and its competitors?

Occidental Petroleum - Warren Buffett's Strong EndorsementWhy Buying Occidental Petroleum (OXY) is a Good Investment
Warren Buffett's Strong Endorsement
Berkshire Hathaway, led by Warren Buffett, has been consistently increasing its stake in OXY, holding over 25% of the company. Buffett's long-term approach and confidence in OXY suggest strong fundamentals and future growth potential.
Solid Financial Performance
OXY has a P/E ratio of 20.95 and a profit margin of 19%, showing strong profitability in the energy sector. Its ROE of 15% indicates effective management of shareholder equity.
Strong Free Cash Flow (FCF)
The company generates around $1 billion in free cash flow, which enables it to reduce debt, buy back shares, and pay dividends—key factors Buffett looks for in an investment.
Favorable Industry Trends
With growing global energy demand and OXY's focus on low-cost production, the company is well-positioned to benefit from higher oil prices and long-term energy market stability.
Debt Reduction & Financial Strength
OXY has significantly reduced its debt-to-equity ratio (0.85), strengthening its balance sheet after the Anadarko acquisition. Buffett prefers companies that prioritize financial discipline.
Carbon Capture & Future Growth Potential
OXY is a leader in carbon capture technology, positioning itself for long-term sustainability as the world moves toward cleaner energy solutions. This gives it a competitive edge in the evolving energy market.
Buffett's Potential Full Acquisition
With Berkshire Hathaway increasing its stake and securing regulatory approval to buy up to 50% of OXY, there is speculation that Buffett may eventually acquire the entire company. This could drive further price appreciation for OXY shares.
Conclusion
Buffett's heavy investment in OXY, combined with strong financials, solid cash flow, and promising energy market trends, makes the company an attractive value play for long-term investors.

Price target XAU ! ATH 3045
⭐️GOLDEN INFORMATION:
Gold prices (XAU/USD) continue their upward trajectory for the second consecutive day, marking gains in five of the last six sessions and surging to a new all-time high near the $3,010 mark during Tuesday’s Asian session. Mounting uncertainty surrounding President Donald Trump’s trade tariffs, coupled with growing concerns of a US recession, has strengthened safe-haven demand for the precious metal. Additionally, escalating geopolitical tensions in the Middle East provide further support to bullion. Market expectations of additional Federal Reserve (Fed) rate cuts, reinforced by lackluster consumer spending data released on Monday, further bolster the appeal of the non-yielding yellow metal.
⭐️Personal comments NOVA:
move in the uptrend line, tariff
⭐️SET UP GOLD PRICE:
🔥SELL GOLD zone: $3021 - $3023 SL $3026 scalping
TP1: $3017
TP2: $3010
TP3: $3003
🔥SELL GOLD zone: $3044 - $3046 SL $3051
TP1: $3035
TP2: $3020
TP3: $3000
🔥BUY GOLD zone: $3003 - $3001 SL $2996
TP1: $3009
TP2: $3015
TP3: $3023
⭐️Technical analysis:
Based on technical indicators EMA 34, EMA89 and support resistance areas to set up a reasonable BUY order.
⭐️NOTE:
Note: Nova wishes traders to manage their capital well
- take the number of lots that match your capital
- Takeprofit equal to 4-6% of capital account
- Stoplose equal to 2-3% of capital account

Good Trade SetupIt has taken a Support from
a Very Strong Level around 90 - 94.
Immediate Resistance is around 110 - 113
Day / Swing Traders may enjoy 5 - 7 rupees profit.
Good Support level is around 102.50 - 104.50
The Stock has the potential to reach upto 120 - 130
& if this level is Crossed with Good Volumes,
Next Target can be around 150+
96 is an Important level that should not break now.

Bullish on All Time Frames.Bullish on All Time Frames.
Breakout above 46.50.
Already re-tested the Previous Breakout
around 38.
Immediate Support is around 42.50 - 44
Immediate Targets can be around 49 - 50
However, It has the potential to touch 59 - 60.
It should not Break 40 now.

ES futures update 17/03/'25Last week, I mapped out some trading zones that are still valid and unchanged.
The 4H supply zone has broken out, so I will be looking for a long position after a retest of this broken supply zone, which should now act as support.
My last trade was a short from this zone, resulting in a small profit since market closing prevented reaching the full take-profit target.
Let's see if the bullish momentum can hold during the retest entry.
As always, follow for more market updates.

HBAR LONGwe can see range on daily chart. We are now on the lower band where we can look for long setups. Little specaultive trade can be seen on chart.
What give the confidence in this trade?
if you look OBV is incresing specialy from prevous low the OBV value is much higher!
Tha means we have strong buying presure.
Have a nice day and Be safe ;)

PayPal - Multiple Signals Pointing to a Potential Bottom!I’ve just entered a position in PayPal, and the reason is that several overlapping factors are lining up in a way that suggests a potential bottom may be in.
First, it looks very likely that Wave (2) is complete. The stock tapped the 61.8% Fibonacci retracement level with precision and has held that level over the past few days – all while the RSI has been climbing, which is a strong bullish divergence signal in my book.
Second, PayPal just touched last year’s VWAP level perfectly, which I view as another strong technical indicator for a potential reversal.
How far this move could go is still unclear, but the open gap above is definitely something I’m watching closely. For that to be in play, $71 needs to be reclaimed. And from here on, $66 should not be touched again.
That’s my plan – and that’s how I’m trading it. Let’s see if the market plays along.

atom buy midterm"🌟 Welcome to Golden Candle! 🌟
We're a team of 📈 passionate traders 📉 who love sharing our 🔍 technical analysis insights 🔎 with the TradingView community. 🌎
Our goal is to provide 💡 valuable perspectives 💡 on market trends and patterns, but 🚫 please note that our analyses are not intended as buy or sell recommendations. 🚫
Instead, they reflect our own 💭 personal attitudes and thoughts. 💭
Follow along and 📚 learn 📚 from our analyses! 📊💡"
