GOOGL ON SUPPORT: 23% BOUNCE IMMINENTNASDAQ:GOOGL GOOGL has consolidated significantly over the last few weeks and, like the NASDAQ, has also taken a beating. Due to the now attractive valuation, the continued stable growth and earnings growth, GOOGL is still a good investment.
Technically, we have reached a trend line and a weaker horizontal support with a further support area at around USD 150. We are already seeing the first RSI divergence. The Bollinger Bands (not shown in the chart, otherwise it would be confusing) are also far overstretched and make a bounce likely. There is also an open gap at $192 - $203.
I would open about 50% of the actual trading position now and the rest when the price falls into the green box, which I still consider to be a possible consolidation area. If the price turns immediately, we are still in with half.
Target Zones:
$192.00
$205.00
Support Zones:
$165.00
$150.00
Longsetup

BNB/USDT: BREAKOUT SETUP!!🚀 Hey Traders! Ready to Ride the BNB Breakout? 👋
If you’re hyped for this setup, smash that 👍 and hit Follow for elite trade ideas that actually deliver! 💹🔥
🔥 BNB Breakout Alert – Big Move Incoming! 🔥
BNB is looking strong and bullish, breaking out from a bull flag formation on the 4H timeframe. If it holds above the flag, we could see a massive 40% surge! 📈
💰 Trade Setup:
📍 Entry Range: $588 - $600
🎯 Targets: $628 / $688 / $746 / $794 / $844
🛑 Stop-Loss: $566
⚡ Leverage: Low (Max 5x)
🔎 Strategy: Enter with low leverage now, add more on dips, and ride the momentum to higher levels!
💬 What’s Your Take?
Are you bullish on BNB’s breakout potential? Share your analysis, predictions, or strategies in the comments! Let’s secure those gains and ride this wave together! 💰🚀🔥

Bitcoin’s Battlefield: Support, Resistance and Trade SetupsBitcoin’s price has been showing signs of a sustained downtrend after forming a double top pattern. The recent action, combined with low volume and failure to breach key resistance zones, points to a likely retest of lower levels. Over the weekend, the price couldn’t break past the 85K resistance, and the low trading volume around this level suggests that buyer interest is waning.
6H TF Chart:
Big Picture vs. Short-Term Action
On a higher timeframe (6H), my indicator neatly outlines the bear market of 2022 and the bull market that started in early 2023—when the “cloud” turned green, signaling a shift in momentum. The cloud's lower boundary is currently at $73,364, which is key. Imo, holding above 70K is critical for keeping that bullish vibe alive.
1H TF Chart:
Switching over to the 1H chart, the picture shows a bearish structure. The upper resistance around 95K (which aligns with the yearly open near $93,455.85) is proving a solid resistance. The anchored VWAP from the all-time high also sits right at this level, adding more weight to the resistance. Bulls need to clear this yearly open to signal a true recovery.
Key Levels & Confluence Zones
1.) Upper Resistance – 93K to 95K:
The 95K zone aligns closely with the yearly open ($93,455.85) and the anchored VWAP from the all-time high, both acting as resistance.
Daily moving averages (62 EMA at ~$91,316 and 62 SMA at ~$94,900) provide further confluence.
Additional resistance between 85K-86K.
2.) Critical Support – 73K to 70K Zone:
The lower edge of the cloud on the 6H timeframe sits around 73K.
The 0.382 Fibonacci retracement (from the low at $15,473.78 to the all-time high at $109,354) is at $73,492, while the 0.618 retracement (from $49,217 to the all-time high) is around $72,205.
Moving Averages on Weekly Chart: The weekly 62 EMA ($72,919) and 62 SMA ($71,590) align well with this support region.
Additional Support: A bullish monthly order block at $71,320 adds another layer of confluence.
Psychological Importance: A hold above 70K is critical to maintaining bullish momentum.
3.) Monthly Open – $83,385.74:
This level serves as a pivot: price is currently hovering below it. A reclaim by bulls would be a positive sign for higher price action, while a rejection reinforces the bearish setup.
Trade Setups
Long Trade Setup:
Entry: Consider laddering in between 75K and 70K as the price retests support.
Take Profit: Aim for the monthly open (~84K) initially, and if support holds and flips, a move toward 90K could be considered.
Stop Loss: Set below 70K to protect against a further downturn.
Short Trade Setup:
Entry: A short setup can start at the monthly open, using a laddering approach between 84K and about 86.9K.
Take Profit: Target the previous low or 74K.
Stop Loss: Place just above 87K to keep risk in check.
Thank you for taking the time to read through this technical analysis. I hope it provides valuable insights for your trading decisions. Happy trading!

$TRUMP ─ @realDonaldTrump Long Trade SETUP$TRUMP ─ @realDonaldTrump Long Trade SETUP 👀
Looking for another long trade entry.
⚠️If the Twin OB fails, then a new low is on the table.
ENTRY = TwinOB + FibFan + nPOC + Fib Golden Pocket + WO + DO
SL = below VAL + TwinOB
------------
------------
As always, my play is:
✅ 50% out at TP1
✅ Move SL to entry
✅ Pre-set the rest of the position across remaining TPs
It's important to take profits along the way and not turn a winning trade into a losing trade.

XRP: The Calm Before the ExplosionXRP has been in strong 100-day accumulation, with a few deviations along the way. Many altcoins have formed reversal patterns, and XRP is setting up for a sharp move upwards. Expecting a breakout from this consolidation phase, potentially propelling XRP to #2 in market cap. The stage is set for a major run!
Entry: NOW
TP: 4

BNB: 380 Days of Accumulation – Big Move Ahead?For over a year, BNB has been in a steady accumulation phase, holding strong while most alts dropped 80-90%. Its resilience in bear markets signals strength and stability, making it a solid contender for the next bull run. A breakout from this range could bring significant upside.
Entry: NOW
TP: 2000

ETH: The Final Dip Before LiftoffEthereum is gearing up for its final shakeout into the $1,602-$1,692 key zone. This could be the last chance to catch entries before a massive move up. Expecting a rapid breakout and, ultimately, a gap fill at $2,800.🚀
Entry: 1602-1692
TP: 2800
SL: 1495

EPIC/USDT Futures: Descending Triangle Breakout or Breakdown?Crypto Futures Technical Analysis (EPIC/USDT - 15m Chart)
1. Trend Direction:
The price is forming a descending triangle, indicated by the downward-sloping yellow trendline.
The trend is bearish, with lower highs being formed, suggesting strong selling pressure.
2. Key Support & Resistance Levels:
Support: Around $1.652 - $1.683 (highlighted in purple), where price recently bounced.
Resistance: At $1.819 - $1.85, near the descending trendline.
3. Potential Breakout or Reversal Points:
If the price breaks below the $1.652 support level with strong volume, a further drop is likely.**
If the price bounces and breaks above $1.819, it could confirm a bullish breakout.
4. Entry & Exit Points:
Long Entry: If price bounces off $1.652 - $1.683 with bullish confirmation.
Take Profit (TP): Near $1.819 - $1.85.
Stop Loss (SL): Below $1.652 (around $1.630).
Short Entry: If price fails to break $1.819 and rejects the descending trendline.
TP: Near $1.652 or lower.
SL: Above $1.85.
5. Risk-Reward Assessment:
The chart shows a risk-reward ratio greater than 1:2, making the long trade attractive if price holds support.
Watch volume spikes for confirmation—high volume on a breakout confirms strength.
Final Thoughts:
Bullish scenario: A break and close above $1.819 could trigger an uptrend.
Bearish scenario: A breakdown below $1.652 could push the price lower.
Monitor for candlestick confirmation (e.g., bullish engulfing, doji, or hammer at support).
Would you like a more detailed breakdown or strategy suggestions? 🚀

SOL Trading Plan: Stacking Entries Like a ProSolana (SOL) has been in a slow uptrend over the past five days, after hitting the low at $112. The current price action looks like an ABC corrective pattern, which could mean we’re setting up for lower prices.
To get the best trade execution, we'll use a laddered entry approach, meaning we’ll scale into positions gradually instead of going all in at once. This helps us get a better average entry price while managing risk effectively. By placing orders at key levels, we increase our chances of catching the right move without overcommitting too early.
Resistance Zone ($136 - $143.80)
A major resistance zone has formed between $136 - $143.80, where price is likely to struggle. This area contains multiple technical confluences that suggest a potential reversal or strong reaction:
$136 – 0.618 Fibonacci Retracement
$140.09 – 1:1 Trend-Based Fibonacci Extension
$141.40 – Anchored VWAP from the $179.85 swing high
$143.80 – Point of Control (POC) from the 19-day Fixed Range Volume Profile
This makes $136 - $143.80 a prime area to consider short positions, especially if price starts showing weakness.
Support Zone ($102.1 - $98.50)
On the downside, a major demand zone is forming between $102.1 - $98.50, where buyers are likely to step in aggressively. This zone has multiple technical confluences, making it a high-probability long entry area:
$102.1 – 2024 Yearly Open & Monthly Support
$100 – Bullish Monthly Order Block & Anchored VWAP Support
$98.50 – Final key demand zone
This zone presents a solid long opportunity, allowing for gradual scaling into positions as price moves deeper into support.
Short Trade Setup – Laddered Entry Approach
Instead of entering all at once, we’ll ladder into the short position gradually, starting small and increasing size as price moves deeper into resistance.
Short Entry Levels & Position Sizing
Trade Details
Average Entry Price: $140.12
Take Profit Target: slightly above $102.10 (Monthly Level)
Stop Loss: slightly above $146.70 (Above POC)
Risk-Reward Ratio (R:R): ~6:1
Long Trade Setup – Laddered Entry Approach
For the long setup, we start with small entries at higher prices and increase size as price moves deeper into support, ensuring a better average entry in a key demand zone.
Long Entry Levels & Position Sizing
Trade Details
Average Entry Price: $102.72
Take Profit Target: slightly below $120.00
Stop Loss: slightly below $95.00
Risk-Reward Ratio (R:R): ~2.45:1
Market Outlook
Short Bias: Until price reclaims $143.80, this remains a strong resistance zone for potential short trades.
Short Setup: Laddering into resistance ensures better risk management and higher average entry efficiency.
Long Setup: Starting small at $112 and increasing position size down to $98.50 ensures strong positioning in a high-confluence demand zone.
By scaling into trades rather than committing at a single price, we increase flexibility, improve trade execution, and adapt better to price movements. 🚀
Weekly Timeframe - 200 EMA Support
$100 coincides with the 200 EMA on the weekly timeframe, adding confluence to this area as strong support.
If Solana decisively breaks above $144, it would invalidate the short thesis and suggest a potential move higher toward $150. Conversely, a strong rejection from the resistance zone would likely accelerate the move toward $112 to test demand at swing low.

#WUSDT is setting up for a breakout📉 Long BYBIT:WUSDT.P from $0,08897
🛡 Stop loss $0,1985
1h Timeframe
⚡ Plan:
➡️ Waiting for consolidation near resistance and increased buying activity before the breakout.
➡️ Expecting an impulsive upward move as buy orders accumulate.
🎯 TP Targets:
💎 TP 1: $0,09275
💎 TP 2: $0,09465
💎 TP 3: $0,09566
🚀 BYBIT:WUSDT.P is setting up for a breakout—preparing for an upward move!

#AI16ZUSDT is setting up for a breakout📉 Long BYBIT:AI16ZUSDT.P from $0,2037
🛡 Stop loss $0,1985
1h Timeframe
⚡ Plan:
➡️ Waiting for consolidation near resistance and increased buying activity before the breakout.
➡️ Expecting an impulsive upward move as buy orders accumulate.
🎯 TP Targets:
💎 TP 1: $0,2072
💎 TP 2: $0,2100
💎 TP 3: $0,2125
🚀 BYBIT:AI16ZUSDT.P is setting up for a breakout — preparing for an upward move!

MDT ANALYSIS📊 #MDT Analysis
✅There is a formation of Descending Channel Pattern in daily chart. Currently #MDT is in bearish way.
After a breakout of the pattern and major resistance level we would see a bullish momentum otherwise the price will drop more 🧐
👀Current Price: $0.02980
⚡️What to do ?
👀Keep an eye on #MDT price action and volume. We can trade according to the chart and make some profits⚡️⚡️
#MDT #Cryptocurrency #Breakout #TechnicalAnalysis #DYOR

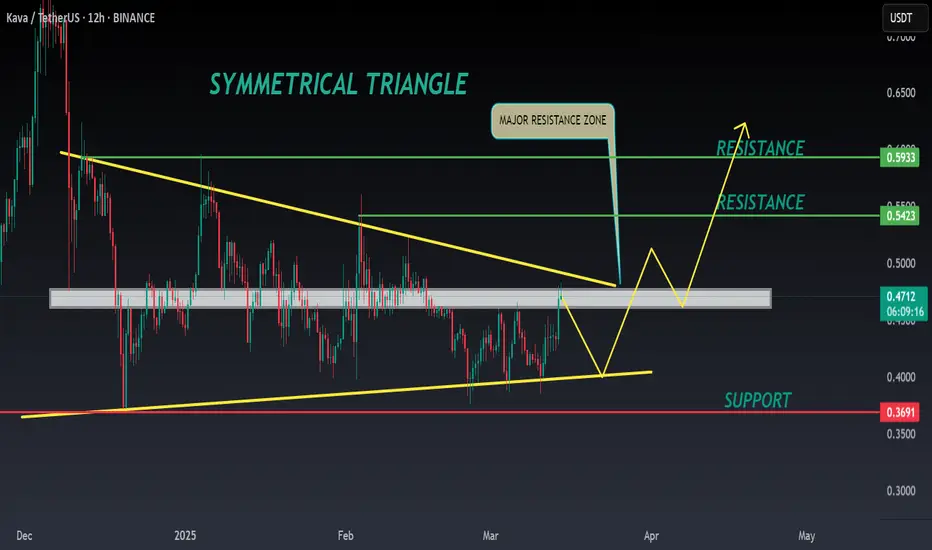
KAVA ANALYSIS🔮 #KAVA Analysis
💲💲 #KAVA is trading in a Symmetrical Triangle Pattern. If the price of #KAVA breaks and sustain the higher price then will see a pump. Also there is an instant strong support zone. We may see a retest towards the support zone first and then a reversal📈
⁉️ What to do?
- We have marked crucial levels in the chart . We can trade according to the chart and make some profits. 🚀
#KAVA #Cryptocurrency #Support #Resistance #DYOR
#BTCUSDT: BULLISH BREAKOUT IN LTF!!🚀 Hey Traders!
If you're finding value in this analysis, smash that 👍 and hit Follow for high-accuracy trade setups that actually deliver! 💹🔥
BTC is breaking out from an inverse head & shoulders pattern on the 1H timeframe, signaling strength! 📈 If it holds above the neckline, we could see a strong rally toward $90K– GETTEX:92K in the coming days! 🚀
🔹 Key Levels to Watch:
✅ Target: $90K– GETTEX:92K
❌ Invalidation: Close below $81,200
Momentum is building—can bulls take control? Let us know in the comment section.

GOLD → Strong consolidation. What’s Next?OANDA:XAUUSD is consolidating within the 2926 - 2890 range. The overall market remains bullish, but there are signs of short-selling or pre-news selling ahead of the major economic data release scheduled for Wednesday.
Accordingly, the market is eagerly awaiting U.S. inflation and employment data, which could play a crucial role in shaping the Federal Reserve’s next move. Despite a weaker dollar and rising expectations of monetary easing, Fed Chair Jerome Powell remains cautious, signaling a measured approach to policy adjustments.
Meanwhile, gold demand remains strongly supported by China as the country ramps up its purchases. Additionally, growing concerns over stagflation in the U.S. further strengthen gold’s appeal as a safe-haven asset. However, traders are keeping a close watch on upcoming economic reports and the potential impact of China's tariffs on U.S. goods, which could introduce further market volatility.
The key focus now is 2926, where price action is shaping a potential accumulation phase before a breakout. If price stabilizes above this resistance, it could trigger a significant bullish impulse, signaling a continuation of the uptrend.
However, a major challenge remains—if the price accelerates too quickly toward resistance, the risk of a false breakout increases. In such a scenario, the market may pull back to 2890 to test liquidity zones, ensuring structural confirmation before making a legitimate move back toward 2926 and beyond.
What are your thoughts on gold?
Best regards, Bentradegold!

GER40 LONG SETUP IDEA - BUY THE DIP📈 LONG SETUP - BUY THE DIP (Swing Trade)
Entry: 22,350 - 22,400
Take Profit (TP): 23,500 (first target), 24,000 (extended target)
Stop Loss (SL): 22,150
Reasoning:
Strong historical support at 22,300 - 22,400.
Bullish divergence on MACD and RSI on 1H and 4H charts.
High timeframe trend remains bullish; expecting continuation after the retracement.
📈 Market Overview & Bias
Daily & 4H Charts:
The GER40 has been in a strong bullish trend over the past few months but is currently experiencing a retracement.
The 21 EMA and 8 EMA are converging, signaling indecision or potential trend exhaustion.
200 EMA remains below price, suggesting long-term uptrend remains intact.
The 100 EMA is acting as resistance on lower timeframes.
Key support zones: 22,300 and 21,900.
Key resistance zones: 23,000 and 23,500.
Lower Timeframes (1H & 15M)
The price is consolidating between the 22,400 - 22,700 range.
A potential reversal pattern is forming on the 15M chart with bullish divergence on RSI and MACD.
ATR values suggest increased volatility, so tight stop losses are necessary.
Key Economic & Geopolitical Considerations
ECB Rate Decision (March 21, 2025)
Hawkish stance → Might push GER40 lower.
Dovish stance → GER40 could break resistance.
US CPI & NFP Reports
Inflation data affecting European stock sentiment.
Strong USD could pressure GER40 downward.
Geopolitical Risks
German & EU economic policies affecting investor sentiment.
Tensions between China/EU and EU/USA on trade policies could add volatility.
mportant: this is not personalized financial advice. It’s an illustration of how one might combine risk management principles with the support/resistance zones in play.
Final Note & Disclaimer
All market scenarios carry probabilities, not certainties. Technical signals are best combined with macro fundamentals (e.g., interest rates, USD behavior, geopolitical risks) to form a well‐rounded market view. This consolidated analysis serves an educational purpose—always do additional research or consult a licensed professional before making trading or investment decisions.

USDCHF: The battle of 0.9000 - Sell or wait?Hello everyone, Ben here!
USDCHF previously broke its uptrend as the fundamental landscape shifted, and the dollar entered a correction phase. Clearly, sellers are in control, as illustrated on the chart.
Fundamentally, the situation is becoming more complex due to the tariff war initiated by Trump, with European countries responding in kind. Economic risks are rising. Additionally, with rumors of rate cuts from Trump and Powell, the dollar has entered a correction phase, which has had a positive impact on the forex market.
From a technical perspective, the 0.9000 level plays a crucial role, as it represents a strong zone. If sellers manage to keep the price below this level, within the selling zone, it will confirm further downside movement.
I also cannot rule out the possibility of a retest of the previous breakout range before a deeper decline. Emphasizing the 0.9000 level!
Best regards,
Bentradegold!

EURUSD: Attempting to change the trendHello dear friends, Ben here!
Currently, EURUSD is attempting to capture recovery due to the dollar's adjustment. The price is forming a reaction from the resistance channel consolidation before breaking out and growing further.
Accordingly, after breaking through the trend channel resistance level, the price has moved into a consolidation phase around the range of 1.053 to 1.021. Within this, the price is testing the resistance level of 1.038. From this, we can argue that the market is still working to change its trend and become stronger against the dollar's adjustment.
Resistance levels: 1.038, 1.053
Support levels: 1.033, 1.021
Emphasizing the resistance level of 1.038, with confirmation of consolidation above this level, there will be nothing stopping EURUSD from further growth.
Best regards, Bentradegold!

GOLD → Consolidating around 2921 — Poised for a Breakout!OANDA:XAUUSD continues its upward trajectory amid rising economic risks and a weakening dollar. The metal is currently testing resistance at 2921 and appears poised for further gains.
The U.S. dollar has broken its bullish structure, driven by comments from the U.S. Treasury regarding potential rate cuts. This intervention has significantly influenced market sentiment. Theoretically, gold is unlikely to decline further due to trade war risks and expectations of a dovish Fed policy. Additionally, weak ADP employment data and PMI figures could provide further bullish momentum for gold.
Key levels to watch are 2913 and 2903, which have already been tested and tapped into liquidity zones. Now, all eyes are on 2927—if this level holds, gold could retreat back to the 2913-2903 support zone. However, a breakout above 2927 could fuel further upside, with the next targets at 2942-2956.
Share your thoughts, opinions, and questions—let's discuss what’s unfolding in the market!

RUNE/USDTHere i can see the best spot opportunity in RUNEUSDT as it is now on it's most important support level as it respect it's Support level it may show some good rally.

DOT/USDT Fly timeAs i can see in weekly chart that if DOT respect it's Support level, it may fly. As shown in chart.

AUDUSD BUY NOW 120 PipsLooking at the monthly charts, it seems like we've hit a key level where the price has bounced back up nicely. This indicates a shift in the overall trend, making it look like there's potential for some upward movement. Since the DXY (which tracks the strength of the dollar) is weakening, we might be able to ride this wave up and take advantage of the positive momentum in the market. It’s all about following the trend and going with the flow!
Risk to reward is very lovely
Follow me for your support
Thank You

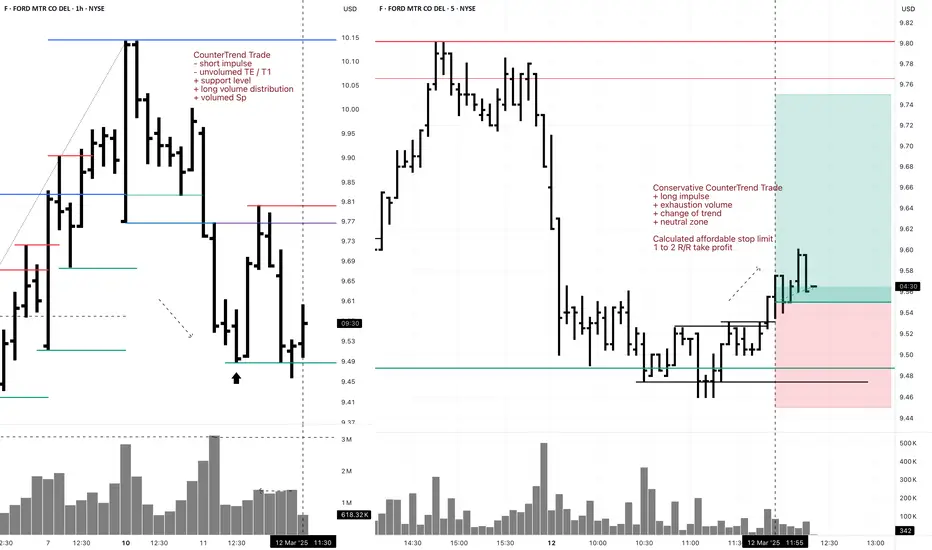
F 5M DayTrade Long Conservative CounterTrend TradeConservative CounterTrend Trade
+ long impulse
+ exhaustion volume
+ change of trend
+ neutral zone
Calculated affordable stop limit
1 to 2 R/R take profit
1H CounterTrend
"- short impulse
- unvolumed TE / T1
+ support level
+ long volume distribution
+ volumed Sp"
1D CounterTrend
"+ long impulse
- biggest volume on correction
- below SOS test level
- below support level
+ 1/2 correction"
1M Trend
"- short impulse
+ 1/2 correction
- unvolumed T1
+ support level
+ reverse volume approach
+ volumed manipulation"
1Y Trend
"+ long impulse
+ volumed T2 level
+ volumed 2Sp+
+ weak test"