GBPJPYGBPJPY is looking very strong .As the pair break through the support come resistance level, currently the price is retesting the broken level and looking very bullish for another leg to the upside.
Longsetup

Dogecoin longif you want to trade dogecoin here's my trade:
entry price .0.21737
Stoploss: 0.21508
target profit: 0.72 or 1.41 or higher

USDJPY: Consolidating below the uptrend channel!Dear Traders!
Recently, USDJPY has made a strong breakout, completely exiting the uptrend and stabilizing below a new support level, as highlighted on the 1-hour chart. The pair is currently trading around 149.20.
This stability above the new support is driven by U.S. President Donald Trump's tariff policies, which have boosted risk-off sentiment and increased demand for the U.S. Dollar as a safe-haven asset. However, expectations of a BoJ rate hike and concerns over a global trade war continue to support the Japanese Yen, keeping gains limited below the lower boundary of the previous uptrend channel.

GOLD → Breaks 2881. Buyers are ready…OANDA:XAUUSD breaking through the resistance threshold of the downward trend and attempting to seek gains above the critical resistance zone of 2881. A consolidation before the breakout is forming relative to 2894, signaling potential growth on the dollar's correction foundation.
Previously, Trump confirmed the possibility of imposing 25% tariffs on Canada, Mexico, and China, triggering retaliatory measures and increasing the risk of U.S. recession. Declining PMI and Atlanta Fed's GDP led to a sell-off on Wall Street and increased demand for gold as a protective asset.
Geopolitical tensions persist as Trump suspends military aid to Ukraine, sparking European discontent. Market focus will remain on the release of detailed U.S. monthly employment information - commonly known as the Non-Farm Payroll (NFP) report on Friday. This crucial data will impact both USD and gold metal.
Technically, the price surpassing the 2881 resistance level divides the market into two planes. A consolidation before breakthrough is forming relative to 2895. The resistance breakthrough and price consolidation above 2895 could reinforce growth. The buyers' main focus is maintaining defensive positions above 2885 - 2895.
In the context of increasing economic risks and declining dollar, gold has every opportunity to continue its growth following the local trend change. The targets in this scenario are 2915, 2921, 2929.
Best regards, Bentradegold!

Gold price today: Extend the momentum!Gold prices continued their upward momentum today, hovering around the $2,910 level. The last recorded trade for gold stood at $2,928 per ounce, marking a 270-pip increase compared to early yesterday morning.
Accordingly, gold prices are currently experiencing strong impacts from USD fluctuations and US tariff policies. Meanwhile, President Donald Trump continues to raise concerns by threatening to impose tariffs on imports from Mexico and Canada. These factors could determine whether gold can reach the $3,000 per ounce mark or not.
Currently, investors are awaiting the US payroll report, expected to be released at the end of this week. The report's results could influence the monetary policy of the Federal Reserve (FED).
On the technical chart, the precious metal has broken out of the descending price channel and made adjustments to create new highs. Bullish factors are driven by the crucial support level at 2885 and the two EMA lines at 34 and 89. All expectations are focused on gold's long-term price appreciation because any signs of US economic slowdown will support calls for Fed rate cuts and provide support for OANDA:XAUUSD .

Gold price today: Strong rebound!Dear traders!
At around 6 AM on March 4, the spot gold price stood at $2,894 per ounce, marking a $36 increase from the previous day's opening price of $2,858 per ounce.
The primary reason for this rise is the increased risk aversion among investors, driving higher demand for safe-haven assets like gold amid escalating geopolitical tensions. Over the weekend, a heated exchange between U.S. President Donald Trump and Ukrainian President Volodymyr Zelensky raised concerns that efforts to end the Ukraine-Russia military conflict could reach an impasse.
Additionally, U.S. trade tariffs on Mexico, Canada, and China take effect today, March 4, sparking fears of potential financial market instability. This uncertainty has pushed many investors toward gold as a wealth preservation asset.
Meanwhile, a sudden decline in the U.S. dollar has made gold more attractive to investors holding other currencies. As a result, today's gold price outlook remains positive. Keep an eye on the $2,892 resistance level, as a breakout above this point could signal further upside momentum.
What are your thoughts?

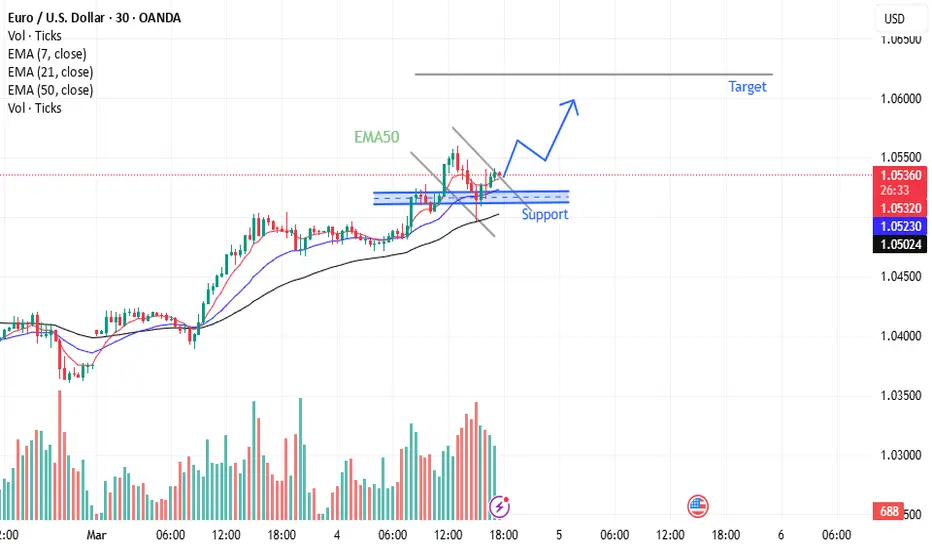
EUR/USD Trade Setup: Long### **📢 EUR/USD Trade Setup: Long Entry at 1.05200 🚀**
EUR/USD presents a **buy opportunity** at **1.05200**, supported by the **EMA50 trend** and a **strong support level at 1.05100**.
---
### **🔹 Trade Details:**
✅ **Entry:** **1.05200** (Long)
✅ **Target TP1:** **1.06200** (+100 pips)
✅ **Stop Loss:** **40 pips below entry**
✅ **Support Level:** **1.05100**
---
### **🔹 Strategy & Risk Management:**
🔹 If the price holds above **1.05100**, bullish momentum could push it toward the **1.06200 target**.
🔹 **Set stop loss** properly to protect capital.
🔹 **Secure profits** along the way or set a **break-even point** as price moves in your favor.
📈 **Trade smart & follow proper risk management for success!** 🚀
Potential upside for EUR/JPYHello traders
The impulse wave for EUR/JPY is rising and there is an expanding pattern. I expect another impulse wave to rise.

SOLUSDT Long by TeamPWRTradesHi Traders,
SOL Long Idea
Based on recently volume and liquidity zones our team has entered a long positions SOL. Targets are 160-175. Stoploss below daily low.
Recommended risk 1-1.5% of portfolio.
Entry 1: 136.50
Entry 2: 133
TP 1: 160
TP 2: 175
SL: 132
Happy Trading,
TeamPWR

Morning Star Formation on Daily TF.Morning Star Formation on Daily TF.
No Bearish Divergence yet that has matured.
a Very Important Support lies arround 173.50 - 177.50
Beautifully printed HL & Moving Up now.
Crossing & Sustaining 194 may lead it towards
200+ with ultimate target around 230.

POPCATUSDT is setting up for a potential long opportunity!
🚀 The price BINANCE:POPCATUSDT.P is testing a critical support level at 0.2056 USDT , and if bulls hold, we could see a strong upward push.
🔑 Key Levels:
Support:
- 0.2056 USDT – Key support, maintaining the trend.
- 0.2010 USDT – Deep liquidity zone for potential wicks.
Resistance:
- 0.2200 USDT – Short-term target for scalpers.
- 0.2774 USDT – Major resistance; breaking above could trigger a rally.
🚀 Trading Strategy:
Long Entry: On a clear bounce from 0.2056 USDT with volume confirmation.
Stop-Loss: Below 0.2010 USDT to avoid liquidity grabs.
Profit Targets:
- 0.2200 USDT – First take-profit for quick gains.
- 0.2500 USDT – Solid mid-term target.
- 0.2774 USDT – Full extension if momentum builds.
📊 Technical Outlook:
- The trend remains bullish as long as support holds.
- Increased volume at support suggests whale accumulation.
- A break below 0.2010 USDT may invalidate the bullish setup.
💡 What to Watch?
- Volume spikes = strong bullish interest.
- Retest of support with a strong bounce = long entry signal.
- Manage risk and avoid FOMO!

USDCADLooking Ahead: USD/CAD Forecast for the Coming Years
When analyzing the future outlook of USD/CAD over the next few years, several key factors come into play, including economic policies, commodity prices, and overall market sentiment.

EUR/USD: Bearish reversal signal!EUR/USD is showing signs of a bearish reversal around 1.04900, completing a Harmonic pattern.
Strategy:
Sell below 1.04800
Stop loss: 1.05039
Take profit: 1.04240
Wait for bearish confirmation before entering!

Gold Buy Setup – Ascending Triangle Breakout### **📈 Gold Buy Setup – Ascending Triangle Breakout Confirmed 🚀**
Gold is currently forming an **ascending triangle pattern**, a bullish chart formation that signals a potential **breakout to the upside**. The **EMA50** is also supporting this move, further confirming the uptrend.
---
### **📌 Trade Setup:**
🔹 **Entry Price:** **2888** (Buy Position)
🔹 **Stop Loss:** **2880** (80 pips below entry to minimize risk)
### **🎯 Take Profit Targets:**
✅ **TP1:** **2893**
✅ **TP2:** **2898**
✅ **TP3:** **2903**
---
### **📊 Market Outlook & Trade Management:**
- **Ascending Triangle** suggests **buyers are gaining strength**, increasing the chances of a breakout.
- **EMA50 confirms bullish momentum**, providing additional confidence in the trade.
- **Risk Management is crucial**:
- **Secure partial profits** at each TP.
- **Adjust stop-loss** once TP1 or TP2 is hit to protect gains.
- **Monitor price action** for continued upside momentum.
---
🔥 **If price stays above 2888 and breaks resistance, we could see strong bullish movement! Trade wisely & manage risk! 🚀📈**

Solana: Intra-week Setup Locked In I’m targeting an intra-week play on Solana, but staying cautious. That’s why I’m using a tighter stop-loss and placing my entry slightly lower. Still, this is a strong level for me because multiple key factors are lining up.
We have the midpoint of the 30-minute Fair Value Gap, an untouched VWAP (which I’ve hidden to avoid clutter), the VAL from VWAP (Volume Area Low), and a huge liquidity zone above the Previous Weekly High, including an order block – acting as a potential magnet.
On the 30-minute time frame, the RSI is trending further into oversold territory, adding more confluence to the setup. Lower time frames are still looking bullish, as long as we hold this level. If not, things could get messy. But until then, everything looks solid.

YGG ANALYSIS🚀#YGG Analysis :
🔮#YGG is consolidating in a parallel channel.... currently falling from its resistance zone. It is trading above its major support zone and there maybe a small retest towards lower supprt level and after that we will see a bullish move📈📈
🔰Current Price: $0.2400
🎯 Target Price: $0.2900
⚡️What to do ?
👀Keep an eye on #YGG price action. We can trade according to the chart and make some profits⚡️⚡️
#YGG #Cryptocurrency #TechnicalAnalysis #DYOR

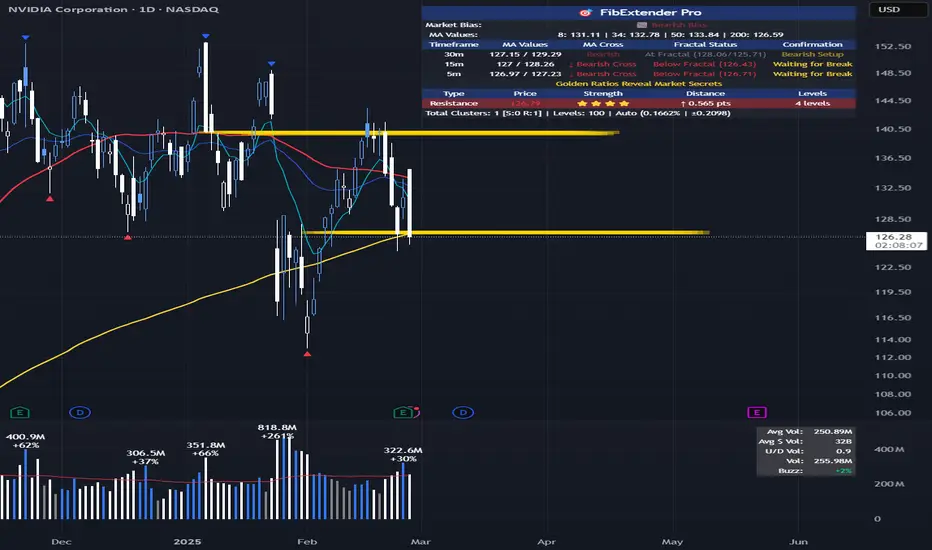
NVDA: Fibonacci cluster support and 200MA at 126.5. NASDAQ:NVDA : Fibonacci Cluster Support at 126.5 Sets Up Potential 10% Rally to 140
Looking at NVIDIA's technical setup, I've identified a critical support zone that could launch NASDAQ:NVDA toward a significant target if it holds.
Technical Analysis
The current price action shows NVIDIA testing a key support zone consisting of:
- Fibonacci cluster at 126.5
- 200 Moving Average support
If this support zone holds, I'm targeting the next Fibonacci cluster at 140, representing approximately a 10.7% upside potential.
Entry Strategy
I'm monitoring two potential entry scenarios:
Aggressive Entry (15-minute chart):
- Wait for 8 EMA to cross above 34 EMA
- Price must break above the most recent swing high
- Entry on confirmation of this break
Conservative Entry (30-minute chart):
- Same criteria as above but on the 30-minute timeframe
- Provides more reliable signals with fewer false breakouts
Risk Management
Stop Loss: Place stops below the 126.5 Fibonacci/200 MA support zone (approximately 124-125)
Profit Target: First target at the 140 Fibonacci cluster
Conflicting Indicators
My analysis shows mixed signals that require caution:
1. My WillVall indicator on the weekly chart shows a potential buy opportunity at current prices, BUT it needs to change direction and move above the 15 level before confirming a long-term entry
2. Multiple timeframe squeeze indicators (Weekly, 4D, 3D, 2D) are currently in squeeze with negative momentum, suggesting downside pressure
3. According to IBD Market School methodology, the market is showing signs of correction and the buy switch is currently OFF, indicating we should avoid new long positions
Trade Plan
Given the current market conditions and mixed signals:
- Wait for confirmation of support at the 126.5 zone
- Look for entry signal confirmation on preferred timeframe
- Use smaller position size due to conflicting indicators
- Set clear stop loss below support (124-125)
- Target the 140 Fibonacci cluster for profit taking
I'll remain patient and wait for clearer market conditions before committing significant capital to this trade. The technical setup is promising, but broader market conditions suggest caution.
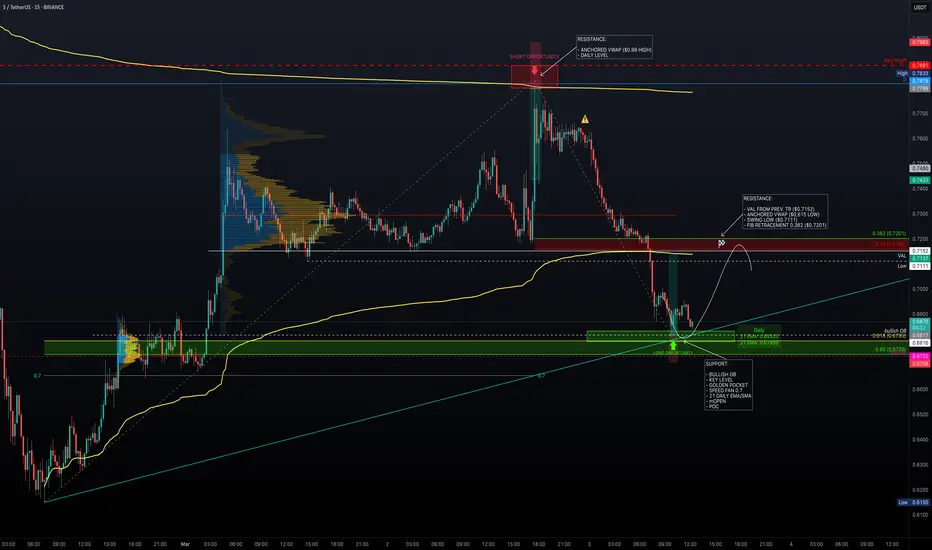
Major Levels – Is Sonic Ready to Pump?After reaching the daily resistance level ($0.7818), price faced strong rejection. The anchored VWAP, acting as dynamic resistance just below the daily level, provided additional confluence for a low-risk short opportunity.
Additionally, a key high at $0.7891 further reinforced this resistance zone. Following the rejection, price sharply declined -13%, retracing back into the previous trading range.
Support Confluence
Price is now approaching a well-defined support zone:
Bullish Order Block: $0.6816
Key Level Near Order Block: $0.6803
Golden Pocket (Fib 0.618 - 0.65): 0.618 at $0.6793 & 0.65 at $0.6739
Monthly Open: $0.6732
Point of Control (POC): $0.6732 (aligning with Monthly Open)
Daily 21 EMA/SMA: 21 EMA at $0.6835 & 21 SMA at $0.6790
Fib Speed Fan 0.7 (from $0.615 to $0.7818): Providing additional support in this zone
Long Trade Setup
Entry Zone: $0.6816 – $0.6732
Stop Loss: Below the Monthly Open ($0.6732)
Take Profit Zone: $0.7111 – $0.7201
Risk-to-Reward (R:R): 3:1 R:R setup, offering a high-probability trade
Take Profit Targets & Resistance Zones
Previous Swing Low: $0.7111 (untested)
Value Area Low (VAL): $0.7152
Anchored VWAP (from $0.615 low): $0.7137
Fib Retracement 0.382 (from $0.7818 high to current low): $0.7201
GBP/USD Bullish Setup with EMA Cross & Strong SupportGBPUSD TRADE ALERT : TRADE LONG
Trade Setup
Entry: Buy at 1.26000
Stop Loss: 1.25500 (-50 pips)
Take Profit Targets:
TP1: 1.26350 (+35 pips)
TP2: 1.26700 (+70 pips)
TP3: 1.27000 (+100 pips)
Technical Confirmation
EMA7 Crosses Above EMA21 & EMA50 → Short-term bullish signal
EMA21 Crosses Above EMA50 → Stronger uptrend confirmation
Support Level at 1.25750 → A key level to watch for price holding
Risk Management
Risk-to-Reward Ratio (RRR):
TP1: 0.7:1 (not ideal)
TP2: 1.4:1 (acceptable)
TP3: 2:1 (good)
Position Sizing: Ensure you risk only 1-2% of your account per trade.
Additional Considerations
Watch for price action signals around the support at 1.25750.
If price struggles at TP1 (1.26350), consider moving SL to breakeven.
Keep an eye on news events (e.g., NFP, CPI, FOMC) that can impact GBP/USD.

Update gold today!Dear traders!
During the Asian session on Monday, gold is attracting some buyers, aiming for the $2,900 level. Geopolitical uncertainty surrounding the Russia-Ukraine conflict continues to support the precious metal while putting pressure on the US dollar, further aiding gold’s short-term recovery.
However, from a technical perspective, gold remains below the EMA 34 and EMA 89, indicating that the bearish trend is still in control. The key resistance zone at $2,892 - $2,895 could be a crucial area where sellers re-enter the market. If gold fails to break above this level, we may see a renewed downward move, reinforcing the dominance of the bears.

EURUSD: The downtrend remains intact!Dear traders!
Currently, EURUSD is pausing its three-day losing streak, trading around 1.0417 during the Asian session on Monday. The pair's recovery is driven by a weaker US dollar, following the release of the January Personal Consumption Expenditures (PCE) inflation data on Friday, which aligned with forecasts and eased concerns over an unexpected inflation spike in the US.
However, the upside remains challenging, as the downtrend channel is still intact, and there are no significant reversal signals from the EMA 34 and 89. If the resistance levels within the channel hold firmly under bearish pressure, the downward trajectory is expected to persist, potentially pushing EURUSD towards 1.0363 (gap-filling level) and even lower, towards the lower boundary of the trend channel, as indicated on the chart.

Gold price today: The decline continues!Dear traders! What do you think about OANDA:XAUUSD – Buy or Sell?
Yesterday, gold continued its downward trend, dropping $27 from its highest point in the previous session at $2,885 per ounce. On March 1, gold closed the week negatively at $2,858 per ounce.
The main reason for this sharp decline in gold prices was the strengthening US dollar. The USD Index surged to 107.66, its highest level in the past 10 days, as financial markets grew concerned over the US administration's aggressive trade policies.
Specifically, former President Donald Trump confirmed a 25% tariff on imports from Mexico and Canada, effective March 4. Additionally, he announced an extra 10% tariff on Chinese goods. This policy has fueled uncertainty in the market, pushing investors toward the USD as a safe-haven asset, which has negatively impacted gold.

Bullish Outlook going forward for NQNQ has pulled back and taken Feb. Monthly low as well as grabbing some additional liquidity from Nov. last year. I shorted NQ on Thursday for 473 points to my anticipated level of support. I nearly caught the bottom of the market, followed by an aggressive back move up to equilibrium to end the week. Going forward, with the high impact news coming up in the first 2 weeks of March, I see a bullish outlook and the potential for new ATH. Here is an idea of what I see playing out over the short-term.
