ETHUSDT Long by TeamPWRTradesTeamPWRTrades ETH Long Idea
Although the general Crypto market has been showing weakness, we are expecting Bullish movement for ETH in the next coming days. Based on Daily candles there is still a possibility of ETH heading towards it's daily support zone at 1800. Our team recommends using low leverage 1-2% of capital for this trade due to the daily volume signaling a possibility of ETH reclaiming 2500-2800 zone.
Enter
1: 2160
2: 2210
TP1: 2500
TP2: 2800
SL: 2088
Trade Active
Happy Trading,
TeamPWR
Longsetup

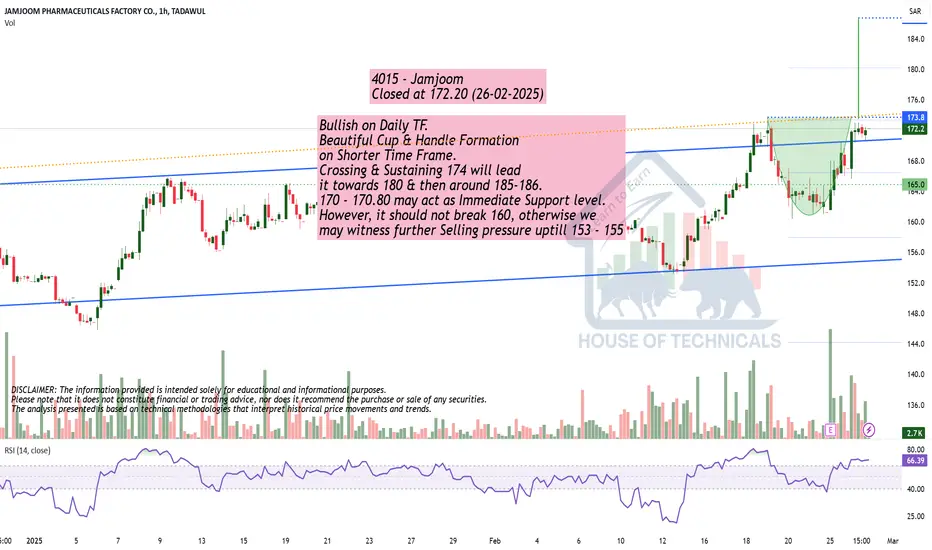
Bullish on Daily TF.Bullish on Daily TF.
Beautiful Cup & Handle Formation
on Shorter Time Frame.
Crossing & Sustaining 174 will lead
it towards 180 & then around 185-186.
170 - 170.80 may act as Immediate Support level.
However, it should not break 160, otherwise we
may witness further Selling pressure uptill 153 - 155
#VRUSDT continues its uptrend📈 LONG BYBIT:VRUSDT.P from $0.011718
🛡 Stop Loss: $0.011470
⏱ 1H Timeframe
⚡ Action Plan:
✅ BYBIT:VRUSDT.P price broke the resistance level and is consolidating above it, confirming a bullish scenario.
✅ The asset is trading above the POC (Point of Control) at $0.00862, indicating buyer dominance.
✅ Increasing volume on the breakout confirms the strength of the upward movement.
🎯 Target TP Levels:
💎 TP 1: $0.012110
📢 A breakout above $0.011718 will confirm the continuation of the uptrend.
📢 POC $0.00862 remains a key support zone.
📢 Rising volume at the breakout suggests a high probability of reaching target levels.
📢 Partial take-profit at TP1 ($0.012110) helps minimize risks in case of a pullback.
🚀 BYBIT:VRUSDT.P continues its uptrend – watch for upward movement and secure profits at TP!

audusd long 1 hour chartthis is my audusd long for 1 hour chart it's based on candles and price action. my entry is around 62170 but you can enter higher than that if you like. my stoploss is at 62080 and target profit can be 63000 or 64000 or even 70000.

Gold price update: Sharp decline from all-time high!Dear friends!
Global gold prices have fallen to their lowest level in over a week, driven by the strengthening U.S. dollar. Investors are closely watching key inflation data, which could provide important clues about the Federal Reserve’s monetary policy. Meanwhile, the U.S. dollar has risen by 0.2%, pushing the USD Index (.DXY) further away from its 11-week low. This appreciation makes gold more expensive for investors holding other currencies.
On the other hand, U.S. President Donald Trump has raised hopes of a one-month delay in imposing higher tariffs on imports from Mexico and Canada, while also proposing a 25% tariff on European automobiles and goods. This uncertainty has driven investors toward the U.S. dollar, adding further pressure on gold prices, which were already facing profit-taking pressure after reaching record highs.

EURUSD: Bearish Wave Continues to Dominate!EURUSD continued its downward trajectory on Thursday, losing nearly 0.9% and slipping below the key 1.0400 support level for the first time in nearly two weeks. The decline was driven by strong USD buying pressure across the market.
The U.S. Dollar Index (DXY) reclaimed the 107.00 level, reaching a fresh six-day high, supported by a modest uptick in both U.S. and German bond yields. The dollar’s strength reflects ongoing concerns over U.S. tariffs and fresh doubts about the health of the U.S. economy, following weaker-than-expected economic data in recent days. These factors have weighed heavily on EURUSD.
From a technical perspective, the pair has broken below an ascending trendline, confirming a shift in momentum towards the downside. This reinforces the bearish outlook, as no clear bottom formation has been established yet. If EURUSD stages a recovery, it is likely to encounter resistance near the confluence zone of the EMA 34, EMA 89, and the newly formed resistance area, which could trigger renewed selling pressure. For now, the bearish bias remains intact, with further downside potential unless a decisive recovery above the resistance zone materializes.

GBPUSD: The trend of discounts prevails?Hello everyone, great to have you back for today's discussion on GBPUSD!
Currently, GBPUSD has extended its decline, trading below 1.2600 as market pressure intensifies. Risk sentiment has worsened following a series of U.S. economic data releases, which indicate weakness in the overall U.S. economy while also signaling a persistent rise in core inflationary pressures.
From a technical standpoint, the pair has broken below the ascending trendline, confirming a bearish breakout. The bearish momentum remains strong, with no clear signs of a bottom forming yet. If GBPUSD stages a corrective pullback, it is likely to face resistance around the 0.5-0.618 Fibonacci retracement zone, which aligns with the confluence of EMA 34, EMA 89, and the newly established resistance area. This setup could reinforce selling pressure, making it a key level to watch.

MGNT 1H Long Investment Conservative Trend TradeConservative Trend Trade
+ long impulse
+ SOS level
+ 1/2 correction
+ volumed 2Sp-
- day will close without test
Calculated affordable stop limit
1/2 1M take profit
Daily Trend
"+ long impulse
+ SOS test / T2 level
+ support level
- strong approach from volume zone
+ biggest volume manipulation"
Monthly Trend
+ long impulse
+ expanding biggest volume T2
+ support level
+ 1/2 correction
+ unvolumed 2Sp-
+ strong buying bars
+ weak selling bar / test
Yearly no context

GOLD → False breakdown before further declineOANDA:XAUUSD updating lows within the changing local trend structure. The price is currently testing the liquidity zone at 2852, with a potential rebound before further downside movement.
Gold registered its lowest level in two weeks, dropping below $2,900 in Asia on Friday, breaking an eight-week bullish streak. The metal remains under pressure from the stronger U.S. dollar, influenced by Trump's tariff policies and U.S. economic conditions. Trump confirmed that tariffs on Canada and Mexico will take effect as scheduled on March 4 and also threatened to impose a 25% tariff on European Union imports, along with an additional 10% on Chinese goods. Additionally, weak U.S. GDP data (2.3% in Q4) and rising jobless claims have further supported the dollar. Traders are now awaiting the U.S. PCE Price Index to assess the Fed's interest rate outlook and its impact on gold.
A false breakdown at 2852 could trigger a retracement toward the 0.618 Fibonacci imbalance zone at 2877 or the 0.5 level at 2885 before resuming the decline. Given both weak fundamental and technical conditions, gold may attempt to retest its recent lows.
Best regards, Bentradegold!

Is Bitcoin Topping Out? Critical Levels to WatchSince the low of $15,476 on November 21, 2022, Bitcoin has surged to an all-time high of $109,588 on January 20, 2025. That’s an incredible +608% increase over 791 days. We also hit the long-anticipated $100K mark. But for almost three months now, Bitcoin has been stuck in a range between $90K and the all-time high, showing some indecision in the market.
Looking Back: Market Structure & Trends
Bitcoin spent over 250 days consolidating between $50K and $70K before finally breaking out in November 2024, right around the U.S. election. That breakout triggered a massive rally, pushing Bitcoin to 100K in just one month. Since then, bulls and bears have been battling it out, trying to establish control over this crucial psychological level.
A look at the pitchfork tool shows that Bitcoin has been rejected at the 0.618, 0.666, and 0.786 levels multiple times while trying to push higher. Recently, we lost the median line of the pitchfork and dropped below 100K, suggesting bullish momentum is fading. The 233 SMA/EMA on the 4-hour TF as well as the 21 EMA/MA on the daily TF has also flipped into resistance, adding to the bearish pressure.
Is February Shaping Up to Be a Bearish Month?
If we compare the current cycle to the 2020 bull market, the price action looks similar, forming a top where Bitcoin struggles to break higher. February could bring a healthy correction before any new leg up.
Key Support Zones & Confluences
Here’s where we could see solid support:
Unfilled CME Gap at $77,930 – Historically, Bitcoin tends to fill these gaps over time
Pitchfork Lower Support Line (~$80K) – If Bitcoin drops, this level aligns with multiple confluences by late February or early March
Fib Speed Fan (0.618 from $50K to ATH) – Perfectly lines up with the pitchfork lower support around $80K
Trend-Based Fibonacci Extension (1.618) – Another confluence at the $79K mark
Fib Retracement (0.5 from $50K to ATH) – Adds more support at $79.3K
Negative Fibonacci Retracement (-0.618) – Lands right at the open gap, reinforcing this zone
Daily 233 EMA/MA – Sitting at $81.3K and $76.4K, further supporting this region
Key Support Zone: $80K - $78K – With all these confluences, this is a strong area for a potential long setup
Additional Support Zone: FWB:88K - $86K – Another important region to watch for a bounce
Resistance Levels & Confluences
Psychological Resistance at 100K – A major battle zone between bulls and bears
Daily 21 EMA/MA (~$99.5K - 101K) – A key resistance level that could cap any upward movement
233 SMA/EMA on the 4H Timeframe – Now acting as resistance, adding pressure to the downside
Potential Trade Setups
Long Setup #1: A potential entry from FWB:88K - $86K
Long Setup #2: $80K - $78K support zone with confirmation could present a high-probability trade
Final Thoughts
Bitcoin is facing strong resistance at 100K, with multiple technical indicators suggesting a possible pullback. While the bigger trend remains bullish, February might bring a correction, providing great long opportunities around the FWB:88K - $86K and $80K - $78K region. Keep an eye on key support zones and look for confirmation signals before jumping into trades.
New Indicator Release
The 4H, Daily, and Weekly support zones seen on the charts are from my new indicator, which I released for free a few days ago. Feel free to check it out and incorporate it into your analysis.

Gold breaks out of consolidation, facing bearish pressureGold has officially exited its previous consolidation phase, experiencing a sharp decline from the $2,950 region and reaching a low near $2,878. The breakdown of the rising wedge pattern has triggered increased selling pressure, confirming a shift in momentum towards the downside.
Currently, gold is making a slight recovery, trading around $2,919. However, the bearish trend remains dominant, leaving the price vulnerable to further downside moves. If gold fails to reclaim the $2,930 - $2,940 zone, the downward momentum may persist, targeting $2,905 as the first support level, with a potential extension toward $2,879.
Wishing you successful trades!

EURUSD: Strong preference for selling strategy!Dear friends!
EURUSD continues to sustain losses below 1.0500 during the early trading hours on Thursday. The pair is under pressure due to the recovery of the US dollar. Meanwhile, the Euro (EUR) weakens following former US President Donald Trump's threat to impose a 25% tariff on the European Union. This development has prevented EURUSD from making significant gains, keeping it limited below the 1.052 resistance level, marked by two recent peaks.
In the short term, EURUSD remains well-supported by bulls around the key support zone of 1.0462. However, this upward move appears to be a temporary consolidation before a potential strong decline, as indicated by the unchanged EMA 34 and 89 levels and a shift in momentum towards a bearish trend. My primary strategy focuses on selling, aiming for further downside if the support level is broken and a new resistance is established.
Wishing you successful trades and profitable opportunities!

GBPUSD: Rising within the uptrend channel!Dear traders!
GBPUSD is currently moving within a clear ascending channel, maintaining its bullish trend on the 1-hourchart.
Looking ahead, if the market conditions remain unchanged, we should consider buy positions in line with the trend. Pay close attention to the psychological resistance level at 1.2700, where GBPUSD may gain further momentum or break through to reach higher targets.
Wishing you successful and enjoyable trading!

#SHELLUSDT – Bullish Scenario, Expecting a Breakout📈 LONG BYBIT:SHELLUSDT.P from $0.7000
🛡 Stop Loss: $0.6671
⏱ 1H Timeframe
⚡ Trade Plan:
✅ The BYBIT:SHELLUSDT.P price is showing strong momentum after breaking out of a consolidation zone.
✅ The asset has broken above $0.6957 and is holding above this level, signaling a potential continuation of the uptrend.
✅ Increasing volume confirms buyer activity.
🎯 TP Targets:
💎 TP 1: $0.7350
🔥 TP 2: $0.7700
📢 Holding above $0.7000 would confirm further bullish movement.
📢 POC at $0.4671 is far below the current price, indicating a trend shift.
📢 Increasing volume supports the bullish case.
📢 Securing partial profits at TP1 ($0.7350) is a smart risk-management strategy.
🚀 BYBIT:SHELLUSDT.P remains in an uptrend – monitoring for continuation and securing profits at TP levels!

btc"🌟 Welcome to Golden Candle! 🌟
We're a team of 📈 passionate traders 📉 who love sharing our 🔍 technical analysis insights 🔎 with the TradingView community. 🌎
Our goal is to provide 💡 valuable perspectives 💡 on market trends and patterns, but 🚫 please note that our analyses are not intended as buy or sell recommendations. 🚫
Instead, they reflect our own 💭 personal attitudes and thoughts. 💭
Follow along and 📚 learn 📚 from our analyses! 📊💡"

Nasdaq NQ Update . High probability Long Setup In this video I look at the NQ on the daily and pinpoint whats possibly next for longs and shorts . I highlight a key zone to look for Longs that you need to mark on your chart .

EURUSD: Uptrend still prevails!Dear traders!
Yesterday, EUR/USD experienced an impressive short-term rebound, briefly reaching the key resistance level of 1.052. However, lacking further momentum, the pair quickly retreated and stabilized within the day's range.
Looking ahead, as long as the ascending channel remains intact and its internal support levels hold firm, buyers are likely to continue their attempt to break through the next key resistance at the upper boundary of the channel.
Wishing you a successful trading day with plenty of profits!

XAUUSD: Buy or sell?Gold continues to decline for the second day, trading around $2,913 per ounce, as the market pauses ahead of key inflation data and uncertainty surrounding Trump’s tariff policies. Despite the drop, strong buyer interest at lower levels signals stability, while expectations of further Federal Reserve rate cuts continue to support the metal.If buyers defend key levels, a short-term rebound may occur.

$ZETA will continue to climb up > $30 - Ignore FUD, accumulate like the whales 🐋
- Zeta Global Holdings Corp. (NYSE: ZETA) reported robust financial performance in the third quarter of 2024, with revenue reaching $268 million—a 42% year-over-year increase.
STOCK TARGET ADVISOR
- This growth underscores the company's strong market position and effective strategic initiatives.
- Analysts have responded positively, with Needham & Company LLC reaffirming a "buy" rating and setting a price target of $43.00, suggesting a potential upside of approximately 99.81% from the current share price.

GBPUSD: Buy or sell?Dear traders,
Recently, GBPUSD has struggled to sustain its new high at 1.269, experiencing a slight downward correction while still holding relatively stable at elevated levels. The primary driver behind this decline is the renewed demand for the U.S. dollar, fueled by rising U.S. Treasury yields and the House of Representatives’ approval of the Republican Budget Plan, which has negatively impacted the pair.
As a result, GBPUSD is likely to undergo a short-term corrective move against the trend, seeking new support levels before resuming its upward trajectory.

adasetup"🌟 Welcome to Golden Candle! 🌟
We're a team of 📈 passionate traders 📉 who love sharing our 🔍 technical analysis insights 🔎 with the TradingView community. 🌎
Our goal is to provide 💡 valuable perspectives 💡 on market trends and patterns, but 🚫 please note that our analyses are not intended as buy or sell recommendations. 🚫
Instead, they reflect our own 💭 personal attitudes and thoughts. 💭
Follow along and 📚 learn 📚 from our analyses! 📊💡"

#IPUSDT – Long Setup, Testing Resistance ZoneLONG BYBIT:IPUSDT.P from $7.0000
🛡 Stop Loss: $6.6900
⏱ 1H Timeframe
✅ Market Analysis:
📍 The BYBIT:IPUSDT.P price is showing strong upward momentum, breaking key resistance levels.
📍 The asset has held above the $6.8982 level, which may confirm a continuation of the uptrend.
📍 POC (Point of Control) at $4.8742 – the highest volume area, previously serving as a consolidation point.
🎯 TP Targets:
💎 TP 1: $7.3100
🔥 TP 2: $7.6200
⚡ TP 3: $7.8600
📢 Holding above $6.8982 could confirm trend strength.
📢 A dip toward $6.6900 (stop loss) could be a fakeout – monitoring price action is crucial.
📢 The $7.3100 level is the first TP, where a retracement may occur before further upside.
📢 If the price breaks $7.6200, the move toward $7.8600 becomes more likely.
🚀 BYBIT:IPUSDT.P is showing strength – monitoring the $7.0000 breakout and securing profits as the price moves up.

GOLD → Volatile. Entering consolidation. What is next?OANDA:XAUUSD after a short-term uptrend, gold is now shifting into a consolidation phase, with speculative traders actively defending key risk zones. In this environment, what can we expect from the precious metal next?
Uncertainty surrounding Trump’s tariff policies and weak U.S. economic data has driven investors back toward safe-haven assets. However, after reaching a record high of $2,956 on Tuesday, gold experienced a pullback due to profit-taking and a decline in Chinese imports. Despite this, weak U.S. consumer confidence data has helped support a partial recovery.
While gold still holds bullish potential, its upside movement is being restrained by a stronger U.S. dollar and rising bond yields. However, trade war concerns continue to fuel demand for the metal.
Key Levels to Watch:
Resistance: 2,921 – 2,942
Support: 2,905 – 2,888
At this stage, the market is forming a sideways range, leading to two potential scenarios:
A pullback to retest the 2,905 – 2,888 support zone before a potential rebound.
A breakout above resistance, confirming a continuation of the bullish trend.
If buyers can push gold into the 2,921 – 2,929 zone and maintain control above this level, the metal could regain upward momentum.
Stay tuned and seize the best opportunities!
