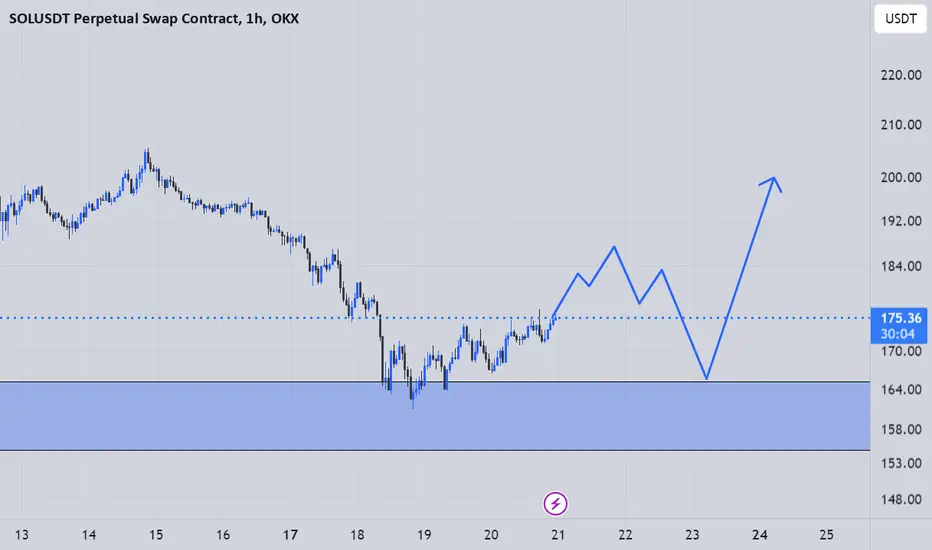
solusdt long setup solana"🌟 Welcome to Golden Candle! 🌟
We're a team of 📈 passionate traders 📉 who love sharing our 🔍 technical analysis insights 🔎 with the TradingView community. 🌎
Our goal is to provide 💡 valuable perspectives 💡 on market trends and patterns, but 🚫 please note that our analyses are not intended as buy or sell recommendations. 🚫
Instead, they reflect our own 💭 personal attitudes and thoughts. 💭
Follow along and 📚 learn 📚 from our analyses! 📊💡"
Longsetup
NQ Futures My Next Level too Long NQ in The Leap competition Some analysis on the NQ with a focus on Price action being up at all time highs. In the video I highlight the importance of having patience and taking the best high probability trades . FOMO in at the top is suicide and so is shorting blind . I provide a potential level with several confluences and a potential new ATH target .
IF you read this far then Please Boost my chart for more setups Ty

HBAR & ONDO Give Us A Buy SignalTrading Fam,
My portfolio is all in rn. But that’s not going to stop me from helping you if you still have some cash on the sideline to throw at a trade or two. Here are two trades you may be interested in. I received a buy signal from my indicator at candle close last night on both.
The first is HBAR.
Hedera Hashgraph ( CRYPTOCAP:HBAR ) is one of the top alts currently being considered for a future ETF. I’ve received not one but two green dot signals within that large liquidity block. This tells me that institutional money and whales are accumulating this gem here. And it is on good support which I don’t see us breaking. If you entered at the time of this post (not fin advice), I could see holding to at least that recent high for a potential profit of 84% plus. If it were me, I’d set my stop out just below that recent pivot low.
The second trade opportunity I have spotted here is ONDO.
The chart here looks similar and once again I’d be targeting that last pivot high for around 75% profit potential. I’d also set my stop limit below our most recent pivot low.
These are both great coins with great opportunities for entry here! Let me know if you enter.
Best!✌️ Stew

ADNOC Drilling Potential Reversal from Demand ZoneADNOC Drilling bouncing from a 1H DZ, and rejected the Daily trend line, this is a good indication for upward momentum, after disappointing Earnings but positive 11% revenue higher than estimates.
Enter around 5.58 with potential target at 6 (Supply Zone)
SL 5.44 (base of the 1H demand zone and under the trend line)
Good time to jump in or add to your position.
Trade safe !
🚨 Disclaimer: This is not financial advice. Always do your own research and manage your risk accordingly. 🚨

GBPUSD OUTLOOK.Market Structure Break Down.
1) Weekly- In this timeframe, the main structure is Bearish. Creating LH & LL. The price pulls back before long-term continuation unless it breaks the structure at 1.28000. The current candle is unidentifiable.
2) Daily- Market Structure is bullish creating HH & HL. Therefore, only buy setups we oat to look for on the lower-timeframe.
3)4H- Market structure is showing a clear bullish trend. However, the price has been consolidating since the market opened for the week. Before the Bullish continuation, expect liquidity grabs at 1.25000.
I am waiting for the price to break the 4H range and then wait for an entry confirmation.
Feel free to comment your thoughts on this breakdown.

SOL on the Slide: Is a Bounce from $150 in the Cards?Solana has been in a downtrend for over 30 days after reaching its ATH at $295.83. For the past two weeks, SOL was stuck in a trading range that formed a descending triangle (a bearish pattern) which eventually broke down, confirming the downtrend. Additionally, SOL lost its yearly support level at $189.31. Where is SOL heading next? Let's find out!
Key Support Zone
Our main long opportunity is around the $150 level, where several confluences align:
Fibonacci Levels:
The 0.5 fib retracement of the entire 5-wave structure sits at $151.92.
The 0.786 fib retracement from the 5th wave is at $149.77.
A fib extension 1.618 of the descending triangle is at $148.65, which is very close to the $150 mark.
Volume Profile:
The Point of Control (POC), highlighted by the red horizontal ray, is around $144, adding another layer of support.
Trade Setup
Currently waiting for SOL to reach the support zone between $152 and $144. An alarm is set when price nears these levels for a long opportunity.

Long S/USDT (h4-d1). x3-4 probably.Long Sonic on H4-D1.
Entry : current level or limit order @ 0.48
TP : 1.5 and 2
Exit : confirmation on D1 below 0.38 (2nd test on Feb,8 of local lows)
FA:
Sonic - EVM L1-chain with high performance (10k TPS with subsec finality)
Previously it was Fantom but recently rebranded.
CTO - Andre Cronje.
Trades on all major CEX.
Top-21 among Chains (Defillama) by TVL - $393mln
1/ Strategic angel investors: Michael (Curve), Stani (Aave), Robert (Compound), Tarun (Gauntlet), and Sam (FRAX), as well as our venture partners Hashed, Signum Capital, and UOB Venture Management (source: soniclabs).
2/ FDV = MCap!!!
3/ Massive airdrop on June around $100mln (current TVL - $393mln, so it's 25% profit on you locked capital if the price remains the same)
4/ 90%-revenue sharing with dApps built on Sonic
TA:
1/ EMA21 and 55 cross on H4
2/ strong bounce on high volume above PoC and MA-cross
3/ capitulation on Feb,3 (weak hands shakeout)
Can repeat that SUI did.

#EURUSD 1H Potential riseHello Traders
I see the EUR/USD bullish wave and the price has fallen in a corrective manner. I expect another bullish wave to start from here.

EGLD Ready !!!Hello Birdies,
MultiversX has broken out of the wedge pattern and is currently retesting it on the weekly chart.
The entry points are well mentioned on the chart beside if anything changed in the market.
A successful test above the pattern could trigger a rally towards targets at $55, $77, $112 and $235.

$UPWK to $23-25 range- Revenue: Q4 2024 revenue reached $191.5 million, a 4% increase year-over-year. The full-year 2024 revenue was $769.3 million, up 12% from the previous year.
- Gross Margin: Maintained at 77.7% for Q4 and 77.4% for the full year.
- Adjusted EBITDA Margin: Achieved 26.2% in Q4 and 21.8% for the full year, reflecting improved operational efficiency.
- Net Income: Reported GAAP net income of $147.2 million for Q4, including a $140.3 million tax benefit.

#SUNDOGUSDT remains in a strong uptrend📈 LONG BYBIT:SUNDOGUSDT.P from $0.04070
🛡 Stop Loss: $0.04013
⏱ 15M Timeframe
✅ Overview:
➡️ BYBIT:SUNDOGUSDT.P is showing strong bullish momentum after breaking out of a consolidation zone. The price is holding above the key $0.04070 level.
➡️ The highest liquidity area (POC) is at $0.03527, confirming strong buyer interest and support for the current trend.
➡️ A volume spike in recent candles suggests increased buying activity, increasing the probability of reaching target levels.
➡️ If the price breaks the $0.04150 resistance, the uptrend could accelerate towards higher levels.
⚡ Plan:
➡️ Enter long from $0.04070 upon confirmation of breakout.
➡️ Risk management with Stop-Loss at $0.04013, placed below the nearest support level.
🎯 TP Targets:
💎 TP1: $0.04150
🔥 TP2: $0.04205
🚀 BYBIT:SUNDOGUSDT.P remains in a strong uptrend, and a breakout above $0.04150 could lead to further gains.

EURJPY BULLISH SHARKHarmonic Pattern Trading Strategy:
1. Combine patterns with 2-3 confirmations (e.g., MA, BB, RSI, Stoch) for increased accuracy.
2. Implement proper risk management.
3. Limit exposure to 3% of capital per trade.
4. Exercise caution: Not every Harmonic Pattern presents a good trading opportunity.
5. Conduct thorough diligence and analysis before trading.
Disciplined approach = Enhanced edge.

$CFLT will break $35 range if Q1 | FY 2025 is good- NASDAQ:CFLT has been range bound for two years now where the lower end is $14-18 and upper range is $35-38.
- If FY 2025, Q1 exceeds expectation of the analyst then this stock will be able to get through the long term resistance and turn it into support.
- NYSE:IOT is a peer company which operates in IOT and streaming data application layer which has shown promising results and returns. I believe NASDAQ:CFLT is a solid company and can reach $45+ comfortably.

#IPUSDT is gaining strength—expecting further upside!📈 LONG BYBIT:IPUSDT.P from $2.0510
🛡 Stop Loss: $2.0235
⏱ 15M Timeframe
✅ Overview:
➡️ BYBIT:IPUSDT.P is showing strong bullish momentum, trading near $2.0510, which could serve as a breakout entry point.
➡️ POC (Point of Control) at $1.8626 confirms the highest liquidity area below the current price, indicating strong buyer support.
➡️ The price is holding local support levels and is approaching $2.0510, a breakout of which could trigger further upside movement.
➡️ If the price holds above $2.0510, an upward push toward $2.0795 and $2.1155 is expected.
⚡ Plan:
➡️ Enter long on a confirmed breakout above $2.0510.
➡️ Risk management via Stop-Loss at $2.0235, limiting potential downside.
🎯 TP Targets:
💎 TP1: $2.0795
🔥 TP2: $2.1155
🚀 BYBIT:IPUSDT.P is gaining strength—expecting further upside!
📢 BYBIT:IPUSDT.P maintains bullish momentum. If the price holds above $2.0510, we expect further gains toward $2.0795 and $2.1155. However, a drop below $2.0235 may trigger a short-term pullback.

Dogecoin (DOGE/USDT) 4H Analysis - Potential Setup in Play DOGE is forming a bullish pennant pattern on the 4-hour chart, indicating a potential continuation of the uptrend. A breakout above the upper trendline could trigger a strong move upward.
However, there are some risk factors to consider. A bearish divergence on the RSI suggests the possibility of a short-term correction. Furthermore, the 200 EMA on the 4-hour chart is acting as dynamic support. Losing this level could shift momentum to the downside.
Currently, DOGE is trading at $0.2524, with an intraday high of $0.2679 and a low of $0.2481.

AUDCAD - Flag Pattern + SetupHello traders
AUDCAD has been forming a flag setup on the 4h.
Now it has broke the flag and it is time to go long.
My entry with sl and tp are as on the chart.

FLOT 1D Long Investment Trend TradeTrend Trade
+ long impulse
+ T2 level
+ support level
+ 1/2 correction
+ biggest volume 2Sp+?
Calculated affordable stop limit
1 to 2 R/R take profit
Monthly countertrend
"- short impulse
+ volumed T1
+ 2Sp+
+ bigger volume on test"
Yearly context
"+ long impulse
- correction"

#ADAUSDT remains strong—expecting further upside!📈 LONG BYBIT:ADAUSDT.P from $0.8106
🛡 Stop Loss: $0.8066
⏱ 15M Timeframe
✅ Overview:
➡️ BYBIT:ADAUSDT.P is trading in an accumulation zone, breaking the local resistance at $0.8106, which could act as a long entry point.
➡️ POC (Point of Control) at $0.7971 confirms strong buyer interest below the current levels.
➡️ The price maintains an upward structure, and a breakout above $0.8106 could lead to further upside.
➡️ Rising volumes confirm bullish activity and potential growth.
⚡ Plan:
➡️ Enter long above $0.8106, confirming the breakout.
➡️ Risk management via Stop-Loss at $0.8066 to protect against false breakouts.
🎯 TP Targets:
💎 TP1: $0.8138
🔥 TP2: $0.8195
⚡ TP3: $0.8266
🚀 BYBIT:ADAUSDT.P remains strong—expecting further upside!
📢 BYBIT:ADAUSDT.P is showing a solid bullish impulse. A breakout above $0.8106 could lead to a test of $0.8138 – $0.8266.
📢 However, if the price drops below $0.8066, it may signal a return to the consolidation zone.

STORJ ANALYSIS📊 #STORJ Analysis : Update
✅There was a formation of Falling Wedge Pattern on daily chart🧐
#STORJ tried to breakout the pattern but failed to sustain. Also there is an instant resistance zone and if #STORJ breaks the pattern then we could expect around $0.5300 level
👀Current Price: $0.3967
🚀 Target Price: $0.5300
⚡️What to do ?
👀Keep an eye on #STORJ price action and volume. We can trade according to the chart and make some profits⚡️⚡️
#STORJ #Cryptocurrency #TechnicalAnalysis #DYOR

$MU getting accumulated with PT $140-220- NASDAQ:MU GAAP eps is growing substantially in 2025 and 2026 but market hasn't rewarded NASDAQ:MU
- It appears that whales are accumulating the stock and/or suspicious of NASDAQ:MU future demand.
- If analyst expectation and company's projection is true then this stock is grossly undervalued.
Based on the fundamentals:
Year | 2025 | 2026 | 2027
Gaap EPS | 6.32 | 9.65 | 11.27
EPS growth | 730.48% | 52.72% | 16.80%
Bear case ( for. p/e = 15 ) | $94.8 | $144.75 | $169.05
Base case ( for. p/e = 20) | $126 | $193 | $225
Base case ( for. p/e = 25 ) | $158 | $241 | $281.75
Bull Case ( for p/e = 35 ) | $189 | $289 | $338

$GRAB - One of the best DCA opportunity! PT : $7-10- NASDAQ:GRAB is no brainer buy sub $5 and ride it till $7-10
- It's like NYSE:UBER of south east asia.
- If you believe that in upcoming years, income per capita in south east asia will grow then you are investing in the right company!
- This stock provide me diversification outside of US and allows me to capture the network effect of growing economy be it via inflation or actual income per capita.
- NASDAQ:GRAB is blue chip stock for south east asians. Their fund managers, public will likely add it in their retirement savings account.
- Passive inflows alone will lift the market cap of the company.
- NASDAQ:GRAB will be double digits. It's just matter of when!
- This NASDAQ:GRAB isn't a trade for me but an investment. I don't care if it crashes by 30-50% or go up by 30-50% in next 1-2 years.
- I'm looking at a multibagger investment and aim for at least 4-5x from current level.

$XYZ will trade > $100 - Say good bye to double digit for NYSE:XYZ
- This company is innovating better than other fintech.
- Visionary ideas for revolutionizing the finance.
- has capped number of employees @ 12k. Jack has shown financial discipline at NYSE:XYZ as compared to NYSE:TWTR
- GAAP EPS is growing for the next 3 years.
Fundamental wise:
Year | 2024 | 2025 | 2026 | 2027 |
EPS | 1.91 | 2.61 | 3.65 | 4.47 |
EPS growth% | 759% | 36% | 39% | 22.46% |
Bear Case (p/e 25 ) | $47.75 | $65.25 | $91.25 | $111.75 |
Base case ( p/e 30) | $57.3 | $78.3 | $109.5 | $134.1 |
Bull Case (p/e 35) | $66.85 | $91.35 | $127.75 | $156.45 |
- Stocks often are forward looking. I believe this year we should trade at $91-$127 range.
- Anything below $78 is accumulation zone for me.

BNB ANALYSIS ( UPDATE ) 📊 #BNB Analysis : Update
✅As we said earlier, #BNB performed same. Now we can see that #BNB is trading around a major support area and following a trendline. We could expect around 10% bullish move if it sustain its major support area
👀Current Price: $673
🚀 Target Price: $745
⚡️What to do ?
👀Keep an eye on #BNB price action and volume. We can trade according to the chart and make some profits⚡️⚡️
#BNB #Cryptocurrency #TechnicalAnalysis #DYOR
