new peak 3520, waiting for gold price to touch⭐️GOLDEN INFORMATION:
Gold prices extended their record-breaking surge on Tuesday, soaring past the $3,450 mark during the Asian session as investors sought refuge in the traditional safe-haven asset amid mounting fears of a US recession and broader financial market volatility.
Persistent concerns over the economic outlook and waning confidence in the US Dollar (USD) have continued to drive demand for the USD-denominated precious metal. The greenback remains under pressure, further amplifying gold's appeal.
Adding to the uncertainty, US President Donald Trump once again criticized Federal Reserve Chairman Jerome Powell, stoking fears about the central bank’s independence. Reports suggesting the administration explored legal avenues to potentially remove Powell have only deepened market unease, boosting the allure of gold as a hedge against policy and economic instability.
⭐️Personal comments NOVA:
Fomo price increase, trade tension, gold price benefits
⭐️SET UP GOLD PRICE:
🔥SELL GOLD zone : 3519- 3521 SL 3526
TP1: $3505
TP2: $3490
TP3: $3465
🔥BUY GOLD zone: $3403 - $3405 SL $3398
TP1: $3415
TP2: $3430
TP3: $3445
⭐️Technical analysis:
Based on technical indicators EMA 34, EMA89 and support resistance areas to set up a reasonable BUY order.
⭐️NOTE:
Note: Nova wishes traders to manage their capital well
- take the number of lots that match your capital
- Takeprofit equal to 4-6% of capital account
- Stoplose equal to 2-3% of capital account
Longsignal

surpassing the old peak, gold price will reach above 3400 soon⭐️GOLDEN INFORMATION:
Gold price (XAU/USD) resumes its upward momentum, climbing to a fresh all-time high around $3,375 during Monday’s early Asian session, as markets reopen following the extended holiday weekend. The surge comes amid renewed investor appetite for safe-haven assets, fueled by ongoing geopolitical tensions and lingering uncertainty surrounding US President Donald Trump’s aggressive tariff agenda.
With fears mounting over the broader economic fallout from escalating trade conflicts, gold has soared over 25% year-to-date. “In today’s environment of intensifying tariff ambiguity, slowing global growth, sticky inflation, and rising geopolitical risks, the strategic case for increasing gold exposure has never been stronger,” noted analysts at UBS, emphasizing a shift toward diversification away from US assets and the US Dollar.
⭐️Personal comments NOVA:
Big increase, gold price continues to rise thanks to tariff momentum
⭐️SET UP GOLD PRICE:
🔥SELL GOLD zone : 3404- 3406 SL 3409 scalping
TP1: $3395
TP2: $3380
TP3: $3370
🔥SELL GOLD zone : 3415- 3417 SL 3422
TP1: $3405
TP2: $3390
TP3: $3370
🔥BUY GOLD zone: $3357 - $3355 SL $3350
TP1: $3365
TP2: $3380
TP3: $3405
⭐️Technical analysis:
Based on technical indicators EMA 34, EMA89 and support resistance areas to set up a reasonable BUY order.
⭐️NOTE:
Note: Nova wishes traders to manage their capital well
- take the number of lots that match your capital
- Takeprofit equal to 4-6% of capital account
- Stoplose equal to 2-3% of capital account

Gold bull cycle continues, 3400✍️ NOVA hello everyone, Let's comment on gold price next week from 04/21/2025 - 04/25/2025
🔥 World situation:
Gold prices are poised to close the week on a strong footing, gaining over 2.79% as the precious metal surged nearly $90 amid continued US Dollar (USD) weakness driven by lingering global trade uncertainties. At the time of writing, XAU/USD is trading around $3,326.
Despite touching a fresh all-time high of $3,358, the rally has cooled slightly as traders lock in profits ahead of the extended Easter weekend, with both European and US markets closed. Meanwhile, real yields have ticked higher, offering a modest headwind. On the policy front, San Francisco Fed President Mary Daly noted that the US economy remains resilient, though some segments are showing signs of slowing. She emphasized that monetary policy is still restrictive enough to keep inflation in check, while also suggesting that neutral rates could be on the rise.
🔥 Identify:
Gold price is still in a big uptrend, short-term corrections only make gold price accumulate more and continue to reach new ATH, tariffs are tense, gold price continues to increase strongly: 3382, 3400
🔥 Technically:
Based on the resistance and support areas of the gold price according to the H4 frame, NOVA identifies the important key areas as follows:
Resistance: $3357, $3382, $3400
Support : $3284, $3236, $3155
🔥 NOTE:
Note: Nova wishes traders to manage their capital well
- take the number of lots that match your capital
- Takeprofit equal to 4-6% of capital account
- Stoplose equal to 2-3% of capital account
- The winner is the one who sticks with the market the longest

3382 , next ATH number today, GOLD⭐️GOLDEN INFORMATION:
Gold price (XAU/USD) enters a phase of consolidation on Thursday, trading within a narrow range near its all-time high reached during the Asian session, as investors digest conflicting market signals. Stronger-than-expected US Retail Sales figures and hawkish remarks from Federal Reserve (Fed) Chair Jerome Powell have lent support to the US Dollar (USD), curbing some of gold’s upside momentum. Meanwhile, the upbeat sentiment across equity markets and mildly overbought technical conditions are prompting traders to remain cautious, limiting fresh buying interest in the precious metal for now.
⭐️Personal comments NOVA:
Gold price continues to increase today, the fomo still has no end, pay attention to the new ATH price zone 3382
⭐️SET UP GOLD PRICE:
🔥SELL GOLD zone : 3381- 3383 SL 3388
TP1: $3370
TP2: $3355
TP3: $3333
🔥BUY GOLD zone: $3302 - $3300 SL $3295
TP1: $3310
TP2: $3320
TP3: $3330
⭐️Technical analysis:
Based on technical indicators EMA 34, EMA89 and support resistance areas to set up a reasonable BUY order.
⭐️NOTE:
Note: Nova wishes traders to manage their capital well
- take the number of lots that match your capital
- Takeprofit equal to 4-6% of capital account
- Stoplose equal to 2-3% of capital account

sideway, keep waiting for new ATH 3271⭐️GOLDEN INFORMATION:
The US Dollar (USD) continues to face headwinds, failing to mount a meaningful rebound from its lowest level since April 2022, hit last Friday. Lingering concerns over the economic consequences of sweeping tariffs have fueled recession fears, while growing expectations that the Federal Reserve (Fed) will soon restart its rate-cutting cycle keep USD bulls on the back foot. This environment continues to favor the non-yielding Gold, offering support to XAU/USD. However, a temporary tariff reprieve announced by President Trump has helped lift overall market sentiment, potentially limiting further gains in bullion.
⭐️Personal comments NOVA:
No news at the beginning of the week, gold price is sideways waiting for price increase and continue to create new ATH
⭐️SET UP GOLD PRICE:
🔥SELL GOLD zone : 3271- 3273 SL 3277
TP1: $3260
TP2: $3250
TP3: $3240
🔥SELL GOLD zone : 3244- 3246 SL 3250 scalping
TP1: $3240
TP2: $3230
TP3: $3220
🔥BUY GOLD zone: $3189 - $3187 SL $3182
TP1: $3195
TP2: $3210
TP3: $3225
⭐️Technical analysis:
Based on technical indicators EMA 34, EMA89 and support resistance areas to set up a reasonable BUY order.
⭐️NOTE:
Note: Nova wishes traders to manage their capital well
- take the number of lots that match your capital
- Takeprofit equal to 4-6% of capital account
- Stoplose equal to 2-3% of capital account

3270, waiting for new ATH gold price⭐️GOLDEN INFORMATION:
Gold prices eased during Monday's Asian session as risk sentiment improved, prompting a shift away from safe-haven assets. The upbeat market tone followed Wall Street’s strong rebound on Friday and encouraging developments in the ongoing US–China tariff dispute, temporarily reducing upward pressure on the yellow metal.
Last week, China retaliated against the US’s 145% tariff hike by imposing 125% duties on American goods but later signaled it would not respond to any additional escalations. Over the weekend, President Donald Trump floated the idea of targeting Chinese semiconductors and electronics with a separate 20% tariff—indicating a possible shift in strategy from across-the-board tariffs to more focused trade measures.
⭐️Personal comments NOVA:
Gold price, buying volume maintained, continuing the upward trend: 3260, 3270
⭐️SET UP GOLD PRICE:
🔥SELL GOLD zone : 3270- 3272 SL 3277
TP1: $3260
TP2: $3250
TP3: $3240
🔥BUY GOLD zone: $3168 - $3166 SL $3161
TP1: $3175
TP2: $3190
TP3: $3200
⭐️Technical analysis:
Based on technical indicators EMA 34, EMA89 and support resistance areas to set up a reasonable BUY order.
⭐️NOTE:
Note: Nova wishes traders to manage their capital well
- take the number of lots that match your capital
- Takeprofit equal to 4-6% of capital account
- Stoplose equal to 2-3% of capital account
SPX Fractal Expansion: New Highs Ahead Despite FearAs of April 14, 2025, the CBOE:SPX is exhibiting a clear fractal expansion, suggesting the beginning of a new bullish leg. The recent correction, which caused widespread panic, appears to have completed a fractal cycle reset, with price respecting historical support near 4704 and forming a new fractal edge around 5300.
Despite the fear-driven selloff, momentum indicators like RSI and MACD show signs of bottoming, and volume surged on rebound days, confirming strong institutional buying. The price is now testing temporary resistance at 5878, with a path open to reclaim all-time highs (6100+).
Global & Technical Tailwinds
Technical momentum is recovering across timeframes, with positive divergence on stochastic oscillators.
Breadth is improving: More stocks are participating in the rally, reflecting internal strength.
Sentiment has flipped: The VIX has cooled from panic levels (above 45), and investor fear is easing.
Macro support: Inflation is declining, and central banks are signaling potential rate cuts by late 2025.
Earnings outlook remains solid, and analysts forecast SPX to end 2025 around 6500–7100.
🔍Conclusion
The SPX is carving out a fractal mirror of past bullish reversals, reinforced by strong macro and technical context. Barring unexpected shocks, the index is likely to break above resistance and push toward new highs, even as residual fear lingers. The setup favors buying dips within this emerging structure.

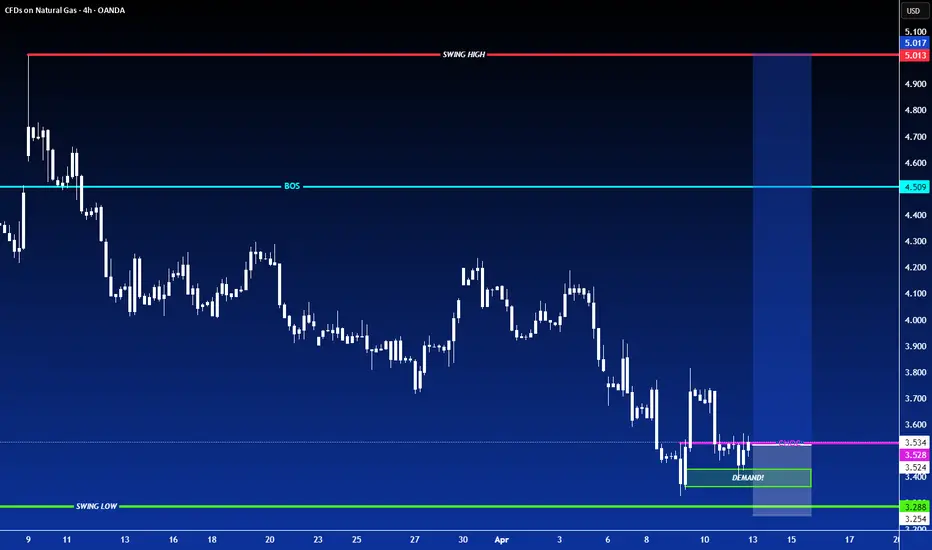
LONG ON NATURAL GASNATGASUSD
Natural gas has finished its pullback to the downside within its overall uptrend.
Price has given us a choc (change of character) to the upside and has also pulled back to a strong demand area.
I expect price to rise majorly on Gas to the next supply level.
ZEC ANALYSIS🔮 #ZEC Analysis
🌟🚀 #ZEC is trading in an Ascending Triangle Pattern and here we can see that #ZEC testing the ascending trendline. Also there is an instant major support zone. We can see a pullback from its major support zone.
🔖 Current Price: $32
⏳ Target Price: $40
⁉️ What to do?
- We have marked crucial levels in the chart . We can trade according to the chart and make some profits. 🚀
#ZEC #Cryptocurrency #Breakout #DYOR

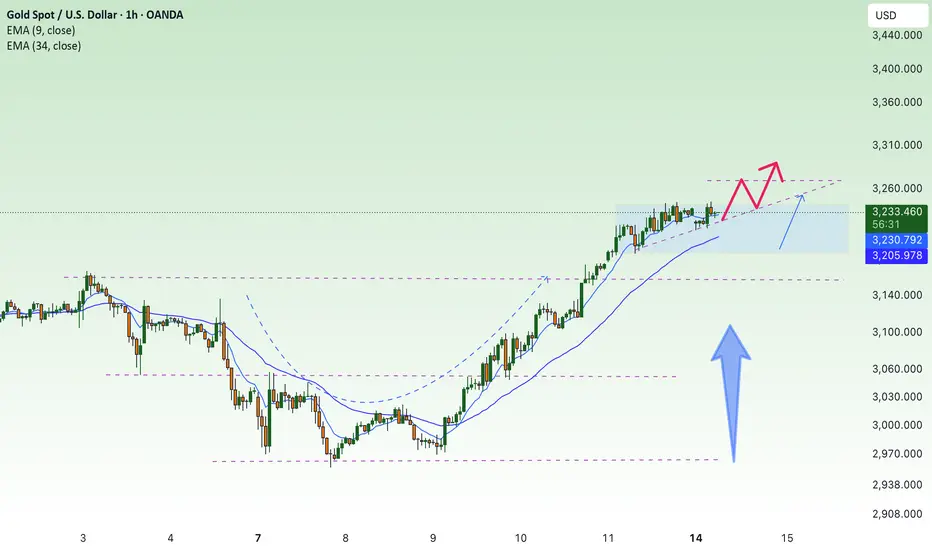
keep aiming for new ATH next week✍️ NOVA hello everyone, Let's comment on gold price next week from 04/14/2025 - 04/18/2025
🔥 World situation:
Gold extended its remarkable rally for a third consecutive session on Friday, surging to a fresh record high of $3,245 amid intensifying US–China trade tensions. The precious metal posted impressive gains of over 2% as fears of a prolonged trade war and its potential fallout on the global economy sent investors flocking to safe-haven assets. At the time of writing, XAU/USD is trading around $3,233.
The North American session saw China retaliate with a 125% tariff on US imports, following President Donald Trump’s move to raise tariffs on Chinese goods to 145%. The heightened geopolitical strain triggered a flight to safety, propelling Gold higher. Further fueling the rally was a sharp decline in the US Dollar, which tumbled to a near three-year low, with the US Dollar Index (DXY) falling to 99.01.
🔥 Identify:
The huge growth shows no signs of stopping, gold prices continue to benefit from tariff policies, continue to find new ATH early next week
🔥 Technically:
Based on the resistance and support areas of the gold price according to the H4 frame, NOVA identifies the important key areas as follows:
Resistance: $3255, $3280
Support : $3157, $3070
🔥 NOTE:
Note: Nova wishes traders to manage their capital well
- take the number of lots that match your capital
- Takeprofit equal to 4-6% of capital account
- Stoplose equal to 2-3% of capital account
- The winner is the one who sticks with the market the longest

LONG ON GBP/CHFGBP/CHF Has a Perfect Double bottom pattern at a major demand area.
Price has broken the neckline of the double top and is currently pulling back to sweep liquidity and balance out price at any FVG's (Fair Value Gaps)
Liquidity sits behind the 2 wicks on the double bottom, so price may sweep that BEFORE rising.
Must give you stop loss space behind the wicks to survive the trade.
I have a buy limit order setup to take advantage of the pullback which will place me in the trade at discount price.
From there im looking to catch 300 pips to the previous swing high.

growth - new ATH - gold hits 3246⭐️GOLDEN INFORMATION:
Trump announced Wednesday that tariffs would be temporarily reduced for dozens of countries, offering a short-term reprieve. However, he simultaneously hiked tariffs on Chinese imports to 125% with immediate effect, following Beijing’s retaliatory move to impose 84% duties on US goods. The escalating trade conflict between the world’s two largest economies has reignited concerns over global growth, prompting investors to seek refuge in safe-haven assets like Gold.
“Gold is reclaiming its safe-haven status and appears poised to chart fresh all-time highs,” said Nikos Tzabouras, Senior Market Analyst.
Meanwhile, scaled-back expectations for aggressive Federal Reserve rate cuts could lend support to the US Dollar, potentially limiting gains for the USD-priced metal. That said, traders still anticipate the Fed will begin easing in June, with markets pricing in a full percentage point of rate reductions by year-end.
⭐️Personal comments NOVA:
Gold price continues to increase greatly, the fomo market and attention are focused on the gold investment channel: safe, continue to find new ATH zones
⭐️SET UP GOLD PRICE:
🔥SELL GOLD zone : 3245- 3247 SL 3252
TP1: $3230
TP2: $3210
TP3: $3190
🔥BUY GOLD zone: $3168 - $3166 SL $3163 scalping
TP1: $3175
TP2: $3183
TP3: $3190
🔥BUY GOLD zone: $3134 - $3132 SL $3127
TP1: $3145
TP2: $3160
TP3: $3175
⭐️Technical analysis:
Based on technical indicators EMA 34, EMA89 and support resistance areas to set up a reasonable BUY order.
⭐️NOTE:
Note: Nova wishes traders to manage their capital well
- take the number of lots that match your capital
- Takeprofit equal to 4-6% of capital account
- Stoplose equal to 2-3% of capital account

LONG ON GBP/AUDGPB/AUD Has dropped to a nice demand level and has given a change of character on the lower timeframe.
I will be buying GBP/AUD expecting it to reach the nearest supply level for 400-600 pips.

LONG ON NZD/USDNZD/USD has been oversold since last week.
It has finally given a change of character (choc) on the lower timeframe witching to bullish.
it is currently in the pullback/retracement phase of the new change.
With the dollar in a overall downtrend and getting ready to fall, this correlation should cause the NZD/USD pair to rise.
I have brought NZD/USD looking to make 200-300 pips this week.

LONG ON GBP/JPYGJ has Taken a dive since last week.
The Jpy Index is now over brought and should begin falling.
This will cause most of the XXX/JPY pairs to rise.
EJ, NJ, and GJ all look great for a buying opp.
GJ has a morning star on the 15min TF, I am waiting for price to pullback to the FVG or demand area on the 15min TF before entering long.
This is a sell limit order risking 65 pips to make over 300 pips.
See you at the top.

Tariff highlights, gold price up or down ?⭐️GOLDEN INFORMATION:
Gold prices (XAU/USD) find support from dip-buyers during the Asian session on Wednesday, pausing the previous day’s pullback from a fresh record high. Investors continue to seek shelter in safe-haven assets amid uncertainty surrounding US President Donald Trump’s sweeping reciprocal tariffs and their potential repercussions on the global economy.
Additionally, escalating geopolitical tensions provide further support for bullion. Mounting concerns over a potential US recession, coupled with growing expectations of additional Federal Reserve (Fed) rate cuts, fuel demand for the non-yielding yellow metal.
⭐️Personal comments NOVA:
Gold price is still in a very stable uptrend, market tariff information waiting for the next price increase fomo
⭐️SET UP GOLD PRICE:
🔥 ATH : SELL 3173 - 3175 SL 3180
TP: 3165 - 3150 - 3140
🔥BUY GOLD zone: $3058 - $3060 SL $3053
TP1: $3070
TP2: $3080
TP3: $3090
🔥BUY GOLD zone: $3106 - $3108 SL $3103 scalping
TP1: $3113
TP2: $3118
TP3: $3125
⭐️Technical analysis:
Based on technical indicators EMA 34, EMA89 and support resistance areas to set up a reasonable BUY order.
⭐️NOTE:
Note: Nova wishes traders to manage their capital well
- take the number of lots that match your capital
- Takeprofit equal to 4-6% of capital account
- Stoplose equal to 2-3% of capital account

New ATH , GOLD is comming 3173⭐️GOLDEN INFORMATION:
US President Donald Trump dismissed expectations that the new tariffs would target only a select group of nations with the largest trade imbalances, declaring on Sunday that reciprocal tariffs would apply universally. This announcement, coupled with the existing 25% duties on steel, aluminum, and auto imports, has intensified fears of an escalating global trade war.
Additionally, investors are increasingly convinced that the economic slowdown triggered by these tariffs will pressure the Federal Reserve (Fed) to resume rate cuts, despite persistent inflation concerns. As a result, Gold has surged to a fresh record high, marking its strongest quarterly performance since 1986.
⭐️Personal comments NOVA:
The backdrop of everything from technical to political and economic is supporting the increase in gold prices in the first quarter of 2025. Gold prices have the highest growth in history.
⭐️SET UP GOLD PRICE:
🔥 ATH : SELL 3162 - 3164 SL 3169
TP: 3155 - 3140 - 3127
🔥BUY GOLD zone: $3093 - $3091 SL $3086
TP1: $3100
TP2: $3110
TP3: $3120
⭐️Technical analysis:
Based on technical indicators EMA 34, EMA89 and support resistance areas to set up a reasonable BUY order.
⭐️NOTE:
Note: Nova wishes traders to manage their capital well
- take the number of lots that match your capital
- Takeprofit equal to 4-6% of capital account
- Stoplose equal to 2-3% of capital account

ATH 3127, continues to aim for big growth⭐️GOLDEN INFORMATION:
Gold's record-breaking rally continues unchecked as buyers push prices past the $3,100 milestone for the first time ever. Mounting concerns over a potential global trade war and rising stagflation risks in the United States (US) have further fueled demand for the safe-haven metal, reinforcing its status as a store of value.
A recent report from The Wall Street Journal (WSJ) suggests that US President Donald Trump may introduce even higher and broader reciprocal tariffs on April 2, known as “Liberation Day.” This prospect has sent fresh waves of risk aversion rippling through global markets, amplifying investor uncertainty.
⭐️Personal comments NOVA:
Tariff pressure, fears of trade war outbreak in April. Gold price is growing continuously, expected to reach 3127
⭐️SET UP GOLD PRICE:
🔥SELL GOLD zone: $3126 - $3128 SL $3133
TP1: $3120
TP2: $3110
TP3: $3100
🔥BUY GOLD zone: $3092 - $3094 SL $3087
TP1: $3098
TP2: $3103
TP3: $3110
⭐️Technical analysis:
Based on technical indicators EMA 34, EMA89 and support resistance areas to set up a reasonable BUY order.
⭐️NOTE:
Note: Nova wishes traders to manage their capital well
- take the number of lots that match your capital
- Takeprofit equal to 4-6% of capital account
- Stoplose equal to 2-3% of capital account

XRPUSDT.P — Is This the Beginning of the Next Pump?
BINANCE:XRPUSDT.P is bouncing back with style — and this long setup is giving off real “king of the charts” vibes. Look at that clean risk-to-reward!
Entry: 2.0905 USDT
Stop-loss: 2.0574 USDT
Take-Profit: 2.2238 USDT
R:R Ratio: 3.28
Why this setup matters:
Confirmed bounce off intraday support
Momentum shift with bullish engulfing candle
Targeting a clean resistance level for optimal exit
Tight stop, juicy upside — exactly what scalpers and day traders crave. Add to watchlist and get ready to trail that stop if momentum holds.

LONG ON ETHEREUM (ETH/USD)Ethereum has given a change of character (choc) to the upside on the 4 hour timeframe...
followed by a nice sweep of engineered liquidity!
Its currently respecting a key demand are and I believe it will now rise for 300-500 points this week.
I am buying Eth to the next level of resistance.

#API3USDT is showing signs of recovery📉 LONG BYBIT:API3USDT.P from $1.1236
⚡️ Stop loss $1.1030
🕒 Timeframe: 1H
✅ Overview BYBIT:API3USDT.P :
➡️ The chart shows a gradual shift from a downtrend to possible reversal after forming strong support around $1.0680.
➡️ Price is currently attempting to break above the key resistance zone $1.1234–$1.1236, which also marks the potential LONG entry point.
➡️ Volume Profile indicates high trading activity above, with the Point of Control (POC) at $1.2541 — suggesting room for upside movement if breakout holds.
➡️ Bullish volume spikes suggest growing buyer interest.
➡️ Stop loss set at $1.1030, just below recent consolidation lows.
📍 Important Note:
Do not rush the entry!
Wait for a clear hold above $1.1236 before entering the LONG — entering too early may expose you to fakeouts.
🎯 Take Profit Targets:
💎 TP 1: $1.1362
💎 TP 2: $1.1544
💎 TP 3: $1.1707
⚡ Plan:
➡️ Watch for breakout confirmation above $1.1236
➡️ Enter LONG after volume or candle confirmation
📢 Consider partial profit at TP1 and move SL to breakeven for risk-free management.
🚀 BYBIT:API3USDT.P is showing signs of recovery — if the price holds above the entry zone, further upside is expected!

Safe Haven Demand - Gold Makes New ATH 3089⭐️GOLDEN INFORMATION:
This triggered swift responses from global leaders, with Canada and the European Union (EU) vowing to retaliate against President Trump’s trade measures.
In the US, the labor market remains resilient, as reflected in the latest unemployment claims report, while the economy continues to show strength following the release of fourth-quarter 2024 Gross Domestic Product (GDP) data. Although housing data saw some improvement, it confirmed the broader slowdown in the sector.
Meanwhile, money markets have factored in 64.5 basis points of Federal Reserve rate cuts for 2025, according to interest rate probabilities from Prime Market Terminal.
⭐️Personal comments NOVA:
growth, gold becomes a safe haven investment channel. continue to create new ATH
⭐️SET UP GOLD PRICE:
🔥SELL GOLD zone: $3088 - $3090 SL $3095
TP1: $3080
TP2: $3070
TP3: $3060
🔥BUY GOLD zone: SCALPING: 3066, 3057
🔥BUY GOLD zone: $3034 - $3032 SL $3027
TP1: $3040
TP2: $3050
TP3: $3060
⭐️Technical analysis:
Based on technical indicators EMA 34, EMA89 and support resistance areas to set up a reasonable BUY order.
⭐️NOTE:
Note: Nova wishes traders to manage their capital well
- take the number of lots that match your capital
- Takeprofit equal to 4-6% of capital account
- Stoplose equal to 2-3% of capital account

TAO ANALYSIS🔮 #TAO Analysis 💰💰
🌟🚀 As we can see that #TAO is trading in a symmetrical triangle and given a perfect breakout. But there is an instant resistance. If #TAO breaks the resistance 1 then we will see a good bullish move in few days . 🚀🚀
🔖 Current Price: $271
⏳ Target Price: $305
#TAO #Cryptocurrency #DYOR
