BTC accumulates, slightly adjusts down💎 BTC PLAN UPDATE – START OF THE WEEK (04/08)
🔍 1. Current Technical Structure
Price Pattern: The chart shows BTC is forming a falling wedge pattern, with converging support and resistance lines.
False Break: There was a false break below the strong support zone around ~112,000, followed by a sharp rebound. This indicates buyers are actively defending this level, showing potential buying pressure.
Fibonacci Retracement: From the recent low to high, the 0.5 (115,559) and 0.618 (116,361) Fibonacci levels are acting as key resistance zones.
Key Price Levels:
• Strong support: 111,800 – 112,300
• Near resistance: 115,500 – 116,500
• Next resistance: downtrend line and previous high around 118,000 – 119,000
🔄 2. Possible Trend Scenarios
✅ Main scenario (bullish):
BTC made a false break below the wedge → rebounded toward Fibonacci resistance → potential:
• Continue rising to the 115,500 – 116,500 zone
• If it breaks and holds above this zone, BTC could break out of the wedge pattern and target 118,000 – 120,000
• A longer-term target could be the 1.618 Fibonacci Extension around ~123,159
❌ Alternative scenario (bearish):
If BTC fails to break above 116,000 and gets rejected:
• It may retest the 112,000 support zone again
• A breakdown below this support would bring back the downtrend
🔄 3. Bullish Supporting Factors:
• The false break signals a shakeout of weak sellers.
• A potential inverse head-and-shoulders pattern is forming, supporting a bullish reversal.
• Moving Averages (MA): Price is nearing the 200 MA (red) – a possible bullish crossover with shorter-term MAs may occur, signaling a buy.
🧭 Suggested Trading Strategy
• Safe buy zone: Around 113,500 – 114,000 if there’s a pullback.
• Take profit in stages: 116,500 – 118,000 – 120,000
• Stop-loss: Below 112,000 in case of a confirmed breakdown
Longterm

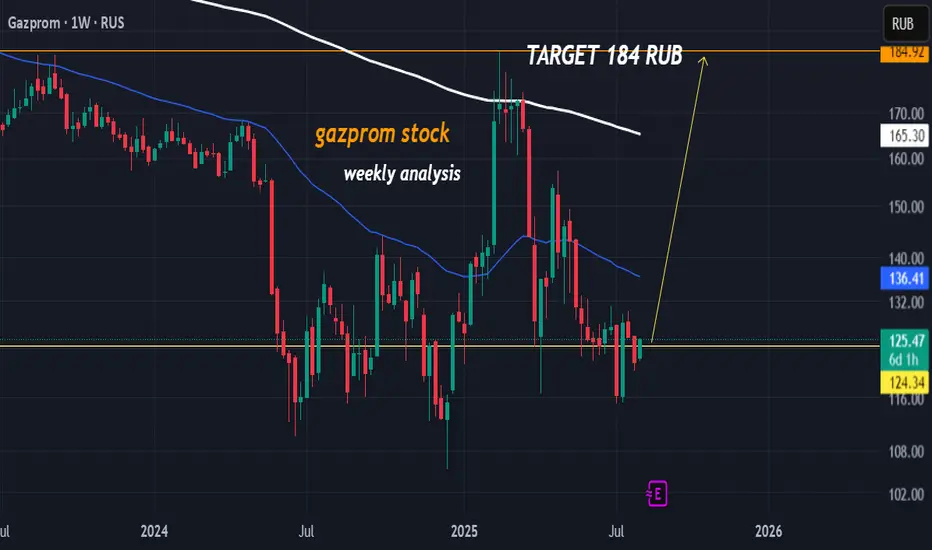
gazprom stockHello ladies and gentleman.The intrinsic value of one GAZP stock under the base case scenario is 282.82 RUB. Compared to the current market price of 122.03 RUB, Gazprom PAO is undervalued by 57%.so the is a great probability long to 184 rub.
Continued recovery, positive after NFP news✍️ NOVA hello everyone, Let's comment on gold price next week from 08/04/2025 - 08/8/2025
⭐️GOLDEN INFORMATION:
Gold prices surged over 1.5% on Friday, climbing toward $3,350, as a weaker-than-expected U.S. Nonfarm Payrolls (NFP) report signaled a faster-than-anticipated slowdown in the labor market. Heightened geopolitical tensions between the U.S. and Russia further boosted safe-haven demand for the precious metal.
Following the disappointing July jobs data, markets began pricing in a potential interest rate cut by the Federal Reserve. While the Unemployment Rate held relatively steady, signs of labor market softness supported recent comments from Fed officials Michelle Bowman and Christopher Waller, who advocated for a 25-basis-point rate cut at the July 29–30 meeting.
Additional data added to the cautious sentiment: the ISM’s July report confirmed that U.S. manufacturing activity remains in contraction territory, while consumer confidence took a hit, according to the University of Michigan’s latest survey.
⭐️Personal comments NOVA:
Gold prices continue to be positively affected after last week's NFP news, market expectations of an early rate cut are rising
🔥 Technically:
Based on the resistance and support areas of the gold price according to the H4 frame, NOVA identifies the important key areas as follows:
Resistance: $3384, $3434
Support: $3331, $3307, $3268
🔥 NOTE:
Note: Nova wishes traders to manage their capital well
- take the number of lots that match your capital
- Takeprofit equal to 4-6% of capital account
- Stoplose equal to 2-3% of capital account
- The winner is the one who sticks with the market the longest

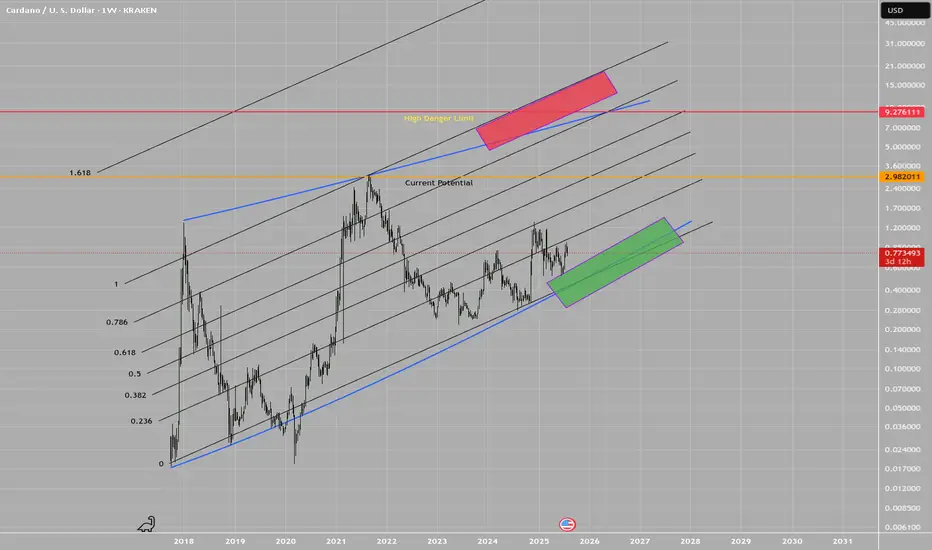
ADA, long term dubious speculationWARNING: This idea is highly dubious!
This is a logarithmic estimate of potential targets, in case Cardano moves in long logarithmic measures.
The real potential of this idea is strongly linked to the fundamentals evolution on time, i.e.: FED reducing the interest rate, for instance, but not only.
The plot features top and bottom limits drown by hand!, these are not perfect logarithmic measures, thus they certainly lacks of math accuracy. Beware.
There are zones in red and green, as transparent boxes, which depicts potential zones of buy and sell interest, of course, everything is in a log scale.
Everyone wish these kind of scenarios to be true. Only time and reality will show us the true face of it. In any case, in the total chaos of uncertainty that this market is, we try to make a sense of it.
Best of the lucks for everyone.
T.
DISCLAIMER: Do your own research! This idea is not a financial advice. All the information presented is highly speculative and cannot be taken as a reference in any circumstance.
Accumulate waiting for btc price increase💎 BTC PLAN UPDATE – End of July (31/07)
📊 BTC Technical Analysis (4H Timeframe – End of July)
✅ Positive Signals:
• BTC has broken out of the consolidation triangle pattern (blue diagonal line), indicating a potential strong uptrend.
• The current price is retesting the breakout support zone around 117,800–118,000 → showing a good reaction and creating upward momentum.
• MA50 and MA200 are starting to slope upwards → confirming increasing buying strength.
📈 Bullish Scenario:
• If BTC holds above 118,000, it is likely to move toward the nearest resistance zone at 119,900.
• After breaking 119,900, the next targets are:
→ 122,792 (Fibonacci 1.618)
→ Further target: 127,900 (Fibonacci 2.618)
🛑 Risk Note:
• If the price drops below 117,000, it’s important to monitor again, as it may retest a deeper support zone around 114,500.

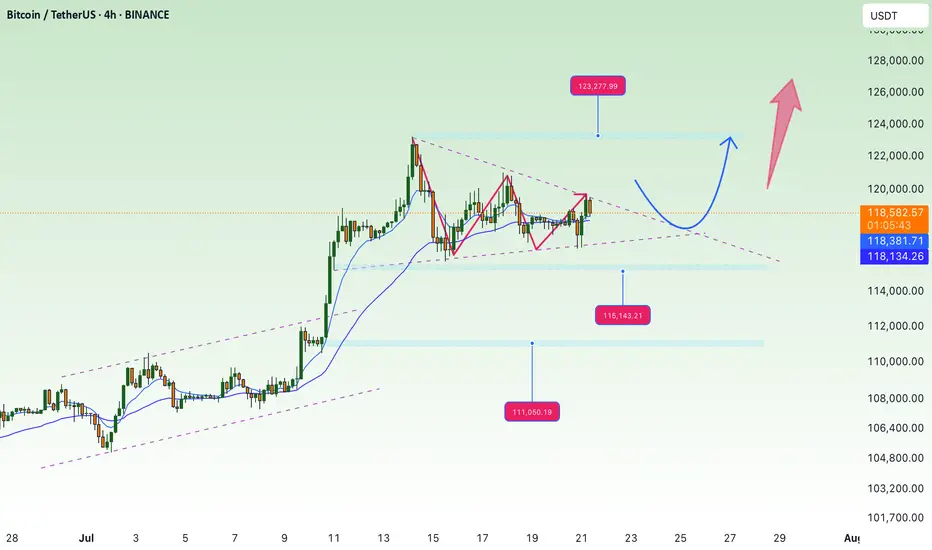
BTC Accumulation, Bullish Breakout Signs💎 BTC PLAN UPDATE
1. Key Chart Features:
Currently, the BTC/USD price is at $118,893.
The chart shows a strong upward trend recently, and we are seeing accumulation with short-term corrections.
2. Fibonacci Levels:
The Fibonacci retracement levels are drawn from the lowest point ($114,460) to the highest point ($119,809).
At the moment, the price is hovering near the 0.5 retracement level ($113,000), which is a key support level.
If the price holds above this level, a rebound is likely.
3. Trendlines and Price Patterns:
The trendlines (dashed blue lines) are indicating a descending triangle pattern, which could lead to a breakout if the price surpasses resistance levels.
A potential Head and Shoulders pattern might be forming, though it is not yet clear and needs confirmation by breaking key resistance.
4. Breakout and Retest Zone:
The breakout zone (red area) is around $119,000.
If the price breaks and holds above this level, we may see a continuation of the uptrend toward the next target around $122,792 (Fibonacci 1.618 level).
After the breakout, the price might retouch (retest) this support area before resuming the upward movement.
5. Technical Indicators:
• Moving Averages (MA):
• The red MA (long-term) is below the current price, indicating a strong uptrend.
• The yellow MA (medium-term) is near the current price, providing support for the uptrend if it holds.
• RSI Indicator:
The RSI has not yet reached overbought levels, suggesting that the market still has potential to rise without being overheated.
6. Conclusion:
If the price breaks above the $119,000 resistance and maintains that level, BTC/USD could continue its strong bullish trend, potentially targeting $122,792 or even $127,941.
Note: If the price fails to hold above $119,000 and drops back below, a pullback to the nearest support level at $114,460 may occur.

BTC Consolidates Below 119,300 Over the Weekend💎 BTC WEEKEND PLAN UPDATE (26/07)
NOTABLE BTC NEWS
The cryptocurrency market is attempting to stabilize after a wave of sell-offs during Friday’s Asian session, when Bitcoin (BTC) dropped to an intraday low of $114,723. A recovery trend is gradually strengthening, with BTC trading at $115,868 at the time of writing, indicating that buying interest at lower levels may increase in upcoming sessions.
TECHNICAL ANALYSIS PERSPECTIVE
Symmetrical Triangle Pattern
BTC is currently fluctuating within a symmetrical triangle pattern, with converging upper and lower trendlines. This pattern typically signals a strong consolidation phase before a decisive breakout.
Scenario unfolded as planned:
• The price failed to break the resistance zone around $120,000 (previously forecasted as a likely failed breakout zone).
• BTC then dropped sharply to the support zone around $115,000, touching the lower trendline and the potential breakout zone.
• At this level, the price rebounded as expected, indicating strong buying pressure at support.
MA lines supporting the trend:
• The price is currently moving around the 200-day MA (red line), showing that the dynamic support is working effectively.
• The 50-day MA (yellow line) is acting as short-term resistance. If broken, it could support the recovery momentum.
Two potential upcoming scenarios:
🔼 If BTC breaks above the $119,500 – $120,000 zone with strong volume, it may continue to test higher levels around $123,000 – $125,000.
🔽 Conversely, if it faces strong rejection around $119K and turns downward, BTC may retest the support zone at $114,000 – $115,000 once again.
Stay tuned to the channel for the latest and continuous updates on XAUUSD, CURRENCIES, and BTC.

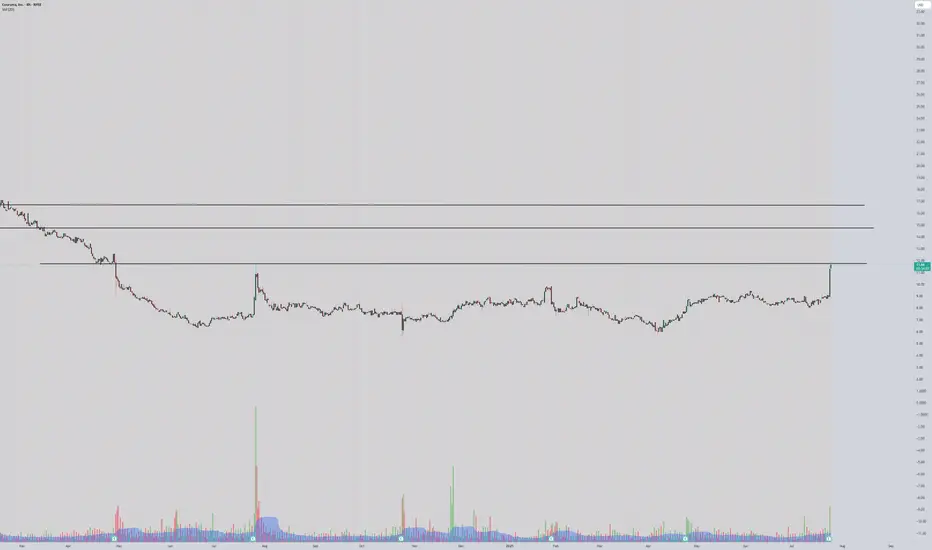
COUR ready to launch?Incredible chart and breakout approaching,
Above $12 we can see $16 in a few months, This can be a great addition to the long term account!
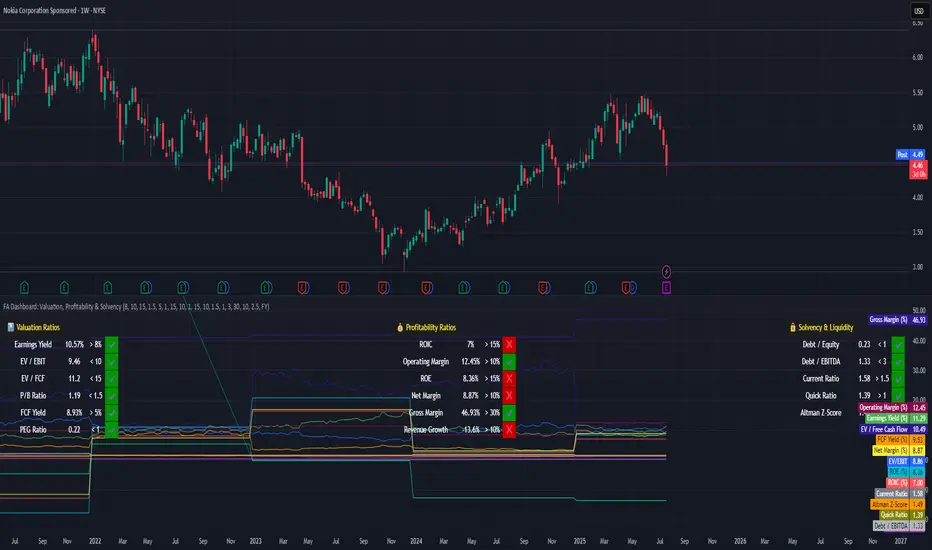
How to Evaluate Companies with a Fundamental Dashboard**Tutorial: How to Evaluate Companies with a Fundamental Dashboard (Example: Nokia)**
This tutorial explains how to use a custom-built dashboard in TradingView to evaluate companies based on key financial dimensions: **Valuation**, **Profitability**, and **Solvency & Liquidity**.
---
🛠 **How to Use This Tool**
This dashboard is meant to be an educational visual filter for fundamental analysis. Here’s how you can use it:
1. Add the script to any stock chart in TradingView.
2. Choose your preferred data period: annual (FY) or quarterly (FQ).
3. Adjust the thresholds in the script settings to reflect your investment approach.
4. The dashboard displays 17 key financial ratios grouped into three categories.
5. Each metric is evaluated visually with ✔️ (meets threshold) or ❌ (falls short).
6. Use this dashboard to identify companies worth deeper analysis — not to make automatic decisions.
---
📊 **Understanding the Dashboard Sections**
### 🔹 Valuation Metrics
Used to assess whether a stock appears undervalued based on price-to-value fundamentals:
- Earnings Yield
- EV/EBIT, EV/FCF
- P/B Ratio
- Free Cash Flow Yield
- PEG Ratio
### 💰 Profitability Metrics
Evaluate how efficiently the company turns revenue into profit:
- ROIC, ROE
- Operating, Net, and Gross Margins
- Revenue Growth
### 🔒 Solvency & Liquidity
Assess financial strength and balance sheet resilience:
- Debt/Equity, Debt/EBITDA
- Current Ratio, Quick Ratio
- Altman Z-Score
---
📍 **Case Study: Nokia (Ticker: NOK)**
This tutorial applies the dashboard to Nokia to demonstrate how to interpret results:
- ✅ **Valuation is strong**: Most metrics meet or exceed typical value thresholds.
- ⚠️ **Profitability shows weaknesses**: ROIC and revenue growth fall below expectations.
- 💪 **Solvency is healthy**: Debt is under control, though Altman Z-Score signals some risk.
This example helps show how the tool highlights strengths and red flags at a glance.
---
🎯 **Key Takeaway**
This dashboard is not a signal generator — it’s a thinking aid.
Its purpose is to help investors explore company fundamentals visually and consistently. The thresholds are customizable, and the tool encourages deeper due diligence.
---
⚠️ **Educational Disclaimer**
This tutorial is for educational purposes only. It does **not** provide investment advice or recommendations.
It is intended to demonstrate how to use a script to organize and interpret fundamental financial data.
Always do your own research and exercise independent judgment before making any financial decisions.
Gold price maintained above 3400⭐️GOLDEN INFORMATION:
Gold prices surged over 1% on Monday as both the US Dollar and Treasury yields declined sharply, driven by ongoing uncertainty surrounding trade negotiations, despite a generally positive risk tone in broader markets. At the time of writing, XAU/USD trades at $3,397, having rebounded from daily lows of $3,338.
While risk sentiment has improved ahead of upcoming US corporate earnings releases, anxiety lingers as the August 1 tariff deadline set by the White House approaches. Investors remain cautious about potential trade disruptions between the US and its key partners—the European Union (EU), Canada, and Mexico.
Meanwhile, reports from Bloomberg indicate that EU officials are preparing to convene this week to finalize a retaliation strategy, should trade talks with President Trump collapse. This backdrop of trade tension continues to support gold’s safe-haven appeal.
⭐️Personal comments NOVA:
Gold price continues to increase before FED's statement, market's expectation of early interest rate cut, setting new ATH in Q4/2025
⭐️SET UP GOLD PRICE:
🔥SELL GOLD zone: 3450- 3452 SL 3457
TP1: $3435
TP2: $3422
TP3: $3405
🔥BUY GOLD zone: $3332-$3330 SL $3325
TP1: $3345
TP2: $3358
TP3: $3370
⭐️Technical analysis:
Based on technical indicators EMA 34, EMA89 and support resistance areas to set up a reasonable BUY order.
⭐️NOTE:
Note: Nova wishes traders to manage their capital well
- take the number of lots that match your capital
- Takeprofit equal to 4-6% of capital account
- Stoplose equal to 2-3% of capital account

accumulate, continue to aim for new ATH💎 Update Plan BTC (July 21)
Notable news about BTC
CEO of Charles Schwab, Rick Wurster, said the company plans to deploy Bitcoin and Ethereum transactions for customers.
This company aims to compete with Coinbase, where customers buy BTC.
This development takes place after the progress of cryptocurrencies when President Donald Trump signs the Genius bill into law.
In an interview on Friday, the CEO of Charles Schwab, Rick Wurster, said the company plans to launch Bitcoin (BTC) and Ethereum (ETH) to compete with Coinbase cryptocurrencies. The move took place after President Donald Trump signed the Genius bill, officially confirming the first cryptocurrency law in the United States.
Technical analysis angle
🟠 Main trend:
BTC is sideway accumulated in the amplitude of 117,000 - 122,000 after a sharp increase.
The chart shows the descending triangular model - a potential sign for Breakout.
🔍 important areas:
Resist:
122,000 - 122,700: Strong resistance area, fibonacci mold 1.0.
130,600 - 131,100: The expected area if Breakout is successful (Fibonacci extension 1.618).
Support:
116,000: Support close, coincide with EMA 200.
111,100: The support area is stronger if the current support breaks.
✅ Scenario 1 - Rise:
If the price turns from supporting 116k → Test the resistance area of 122k.
If the 122K break is definitive, the next goal is 130k - 131k.
❌ Scenario 2 - Discount:
If the 116k area is lost, the possibility of falling will fall more deeply at 111k.
This is also the strong EMA area Fibo 0.382 of the previous wave.
Please follow the channel to receive the latest and continuous updates on XauUSD, currency and BTC
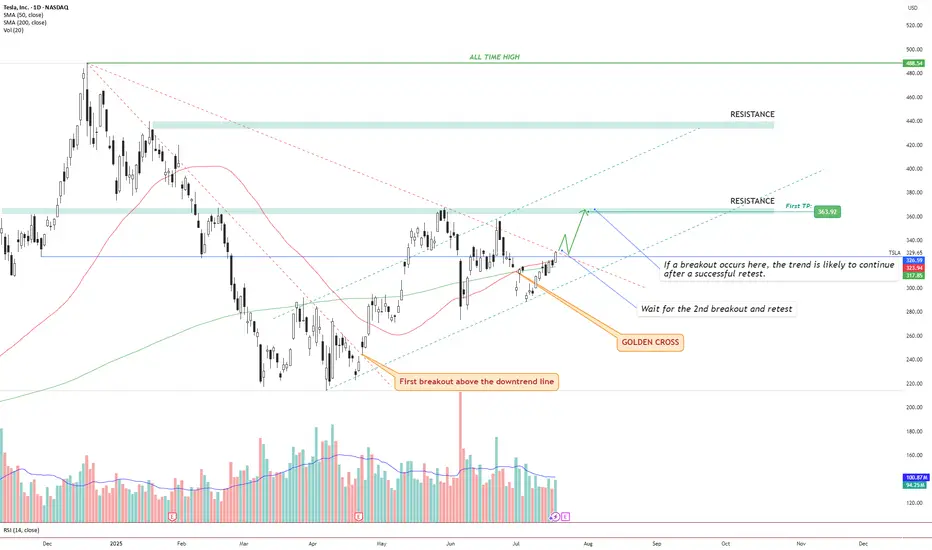
TSLA – Golden Cross + Dual Breakout Structure Targeting $363 andIdea Text:
Tesla NASDAQ:TSLA has recently printed a powerful Golden Cross , where the 50 SMA has crossed above the 200 SMA — signaling a potential long-term bullish shift in trend.
But price action shows more:
We’re observing a dual-breakout structure, where the first breakout above the long-term downtrend line has already occurred (see orange label), and the price is now approaching a critical horizontal resistance zone.
Let’s break it down step-by-step:
🔸 Step 1: Golden Cross
The 50 SMA crossed above 200 SMA — a classic signal for trend reversal. This often attracts institutional interest, especially if followed by breakout confirmation.
🔸 Step 2: First Breakout (Already Confirmed)
Price broke above the descending trendline, retested it, and maintained higher structure. This breakout initiated a shift in market sentiment from bearish to neutral-bullish.
🔸 Step 3: Second Breakout (Setup Forming)
Price is now testing horizontal resistance around $330–$335 zone. This zone also coincides with dynamic resistance from prior failed swing attempts. A successful breakout above this level, followed by a clean retest, can serve as confirmation for a bullish continuation.
🔸 Step 4: Target Setting
🎯 First TP is set at $363.92, a well-defined resistance level. If the breakout holds, next potential targets may develop around key zones such as $395 and $440, depending on price strength and continuation.
🔸 Risk Management
✅ Ideal entry after retest of breakout above ~$335.
❌ Stop-loss below the breakout level or below 50 SMA (~$315 area), depending on entry style.
🔄 Monitor volume: breakout without volume = weak move.
Conclusion:
We are watching a classic price action + moving average confluence setup. Golden Cross, breakout + retest structure, clean resistance level, and defined targets all align.
This setup is valid only with confirmation. No breakout = no trade.
⚠️ Not financial advice. DYOR.
Suryoday Bullish long Term Buy IdeaAfter consolidation of Monts Finally Suryodaya has given a breakout and we can see the Volume is also on higher side, Since the Listing of the stock it was in downward direction, and from past year Stock is now in its bullish Run We can see a good upward move.
Disclaimer: I am not SEBI Registered; this is not a recommendation. Analysis shared for educational purpose only.

Gold price maintains accumulation below 3400✍️ NOVA hello everyone, Let's comment on gold price next week from 07/21/2025 - 07/25/2025
⭐️GOLDEN INFORMATION:
Gold prices edge higher in Friday’s North American session as a softer US Dollar and pre-weekend profit-taking lend support. Dovish remarks from a Federal Reserve (Fed) Governor, hinting at a possible rate cut as early as July, further bolster the yellow metal. At the time of writing, XAU/USD is trading around $3,353, gaining 0.43%.
Improved market sentiment also underpins bullion, following the University of Michigan’s report showing that US consumers are growing more optimistic about the economy, with inflation expectations easing. Meanwhile, Fed Governor Christopher Waller’s call for rate cuts weighed on US Treasury yields, adding positive momentum to gold.
The US Dollar Index (DXY) weakens to 98.48, down 0.13%, making USD-priced gold more attractive to foreign buyers and helping sustain the current uptrend.
⭐️Personal comments NOVA:
Gold price remains in the accumulation range of 3300 - 3400, the market awaits information on upcoming interest rate policy
🔥 Technically:
Based on the resistance and support areas of the gold price according to the H4 frame, NOVA identifies the important key areas as follows:
Resistance: $3367, $3392
Support: $3305, $3280, $3246
🔥 NOTE:
Note: Nova wishes traders to manage their capital well
- take the number of lots that match your capital
- Takeprofit equal to 4-6% of capital account
- Stoplose equal to 2-3% of capital account
- The winner is the one who sticks with the market the longest

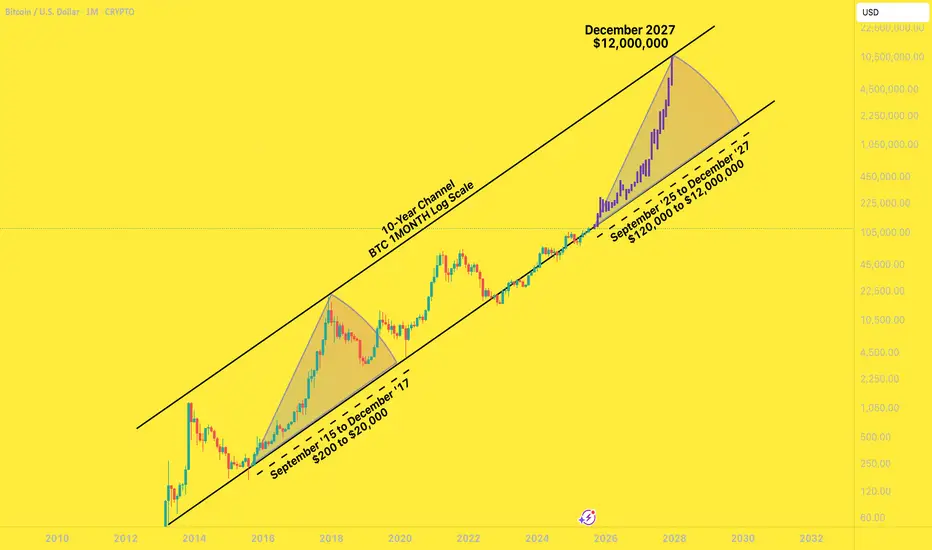
BTC to $12,000,000 December '27I had a years-old bookmarked chart from @MillionaireEconomics that I wanted to update and pick a random, extremely bullish candle pattern from the last time BTC came off the bottom channel to slap on it.
Riddle me this:
Why shouldn't Bitcoin go to $12,000,000 by December 2027?
Saylor continues to lead the way for global companies to scramble to build their own BTC warchests. These early adopters are having investor money dumped into them by the truckload.
Countries are stacking BTC
The BTC ETFs are a smash hit
Trump is all for making his own multi-billy family bitty stack
Mid-curvers will sell far too early, for far too little.
In the next two years, you'll be bombarded with countless, seemingly good reasons to sell your Bitcoins for hundreds of thousands of dollars - and then millions of dollars.
A shocking number of people will be far too early to sell. They will wake up in a cold sweat, night after night, haunted by their "could-have-been" stack, the number that updates in their head ten times a day, going up by six or seven figures a day .
... until they FOMO right back in at $11,999,999.
eth buy longterm"🌟 Welcome to Golden Candle! 🌟
We're a team of 📈 passionate traders 📉 who love sharing our 🔍 technical analysis insights 🔎 with the TradingView community. 🌎
Our goal is to provide 💡 valuable perspectives 💡 on market trends and patterns, but 🚫 please note that our analyses are not intended as buy or sell recommendations. 🚫
Instead, they reflect our own 💭 personal attitudes and thoughts. 💭
Follow along and 📚 learn 📚 from our analyses! 📊💡"

uptrend, heading towards 3400⭐️GOLDEN INFORMATION:
Gold prices (XAU/USD) climb toward $3,350 in early Asian trading on Tuesday, supported by renewed safe-haven demand after US President Donald Trump threatened sweeping 100% tariffs on Russia. Traders now shift focus to the upcoming US Consumer Price Index (CPI) report, which could offer further cues for the Federal Reserve’s policy outlook.
Late Monday, Trump warned that unless Russian President Vladimir Putin agrees to a peace deal to end the Ukraine conflict within 50 days, the US will impose 100% tariffs on Russian goods. The proposed sanctions, described as secondary tariffs, lack detailed clarification but have already fueled market anxiety. Heightened geopolitical tensions are likely to sustain near-term demand for gold as investors seek safety in the yellow metal
⭐️Personal comments NOVA:
Maintaining buying pressure above 3350, gold price in an uptrend, paying attention to CPI results to assess the inflation level of the world's number 1 economy
⭐️SET UP GOLD PRICE:
🔥SELL GOLD zone: 3400- 3402 SL 3407
TP1: $3390
TP2: $3380
TP3: $3370
🔥BUY GOLD zone: $3330-$3328 SL $3323
TP1: $3340
TP2: $3350
TP3: $3360
⭐️Technical analysis:
Based on technical indicators EMA 34, EMA89 and support resistance areas to set up a reasonable BUY order.
⭐️NOTE:
Note: Nova wishes traders to manage their capital well
- take the number of lots that match your capital
- Takeprofit equal to 4-6% of capital account
- Stoplose equal to 2-3% of capital account

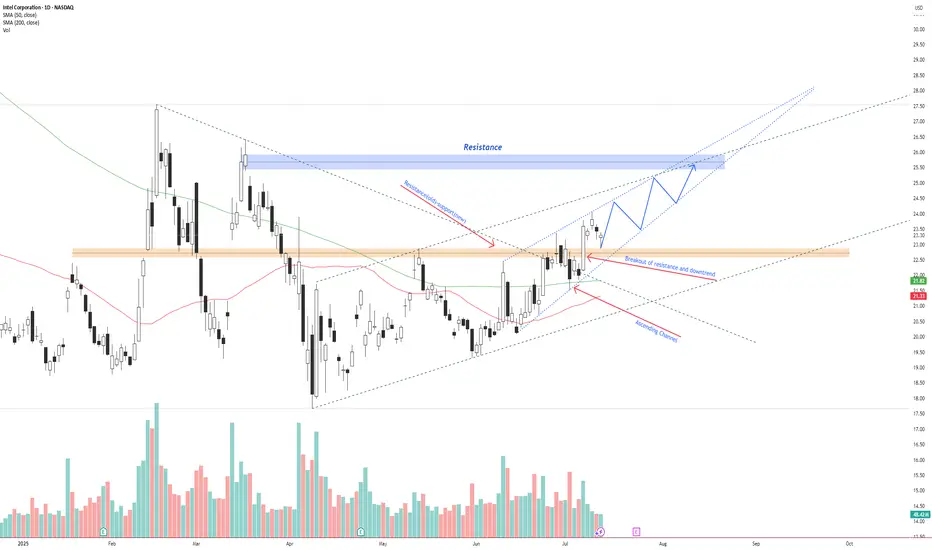
INTC – Breakout Confirmed, Bullish Continuation Inside AscendingIntel NASDAQ:INTC has broken above previous resistance and a descending trendline, confirming a bullish reversal.
Price is currently respecting an ascending channel and forming higher highs and higher lows. The breakout retest around $22.50 has held as new support.
If the current structure remains intact, price could continue toward the $26.00–$26.50 resistance zone. A breakout above this zone opens the door for a move toward $28+.
Key levels:
Support: $22.50 (previous resistance)
Resistance: $26.00–$26.50
Trend structure: Bullish channel
Volume supports the trend, and price is trading above both the 50 SMA and 200 SMA.
📌 Watching for a pullback and continuation move inside the channel.
This is not financial advice. Always do your own research.
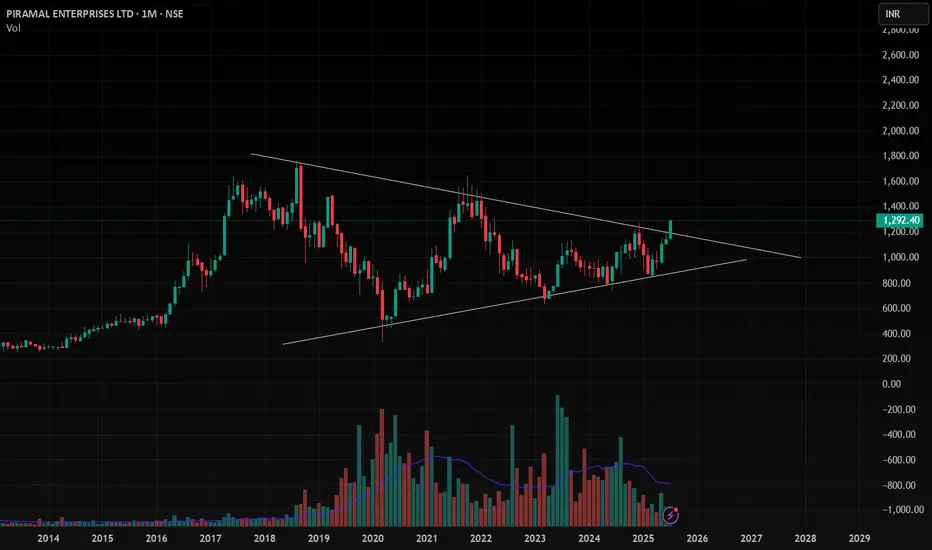
PEL , 1M , BullishThe Triangle Pattern is Breaking Out in Monthly Time Wait for Strong and Perfect close in Weekly Time and Enter after Confirmation .
Take Risk According to your capital
Follow for more ideas like this
recovery, towards 3400, gold price⭐️GOLDEN INFORMATION:
Gold prices (XAU/USD) extended their gains to around $3,365 during the early Asian session on Monday, as investors flocked to safe-haven assets in response to an escalation in global trade tensions.
The move comes after US President Donald Trump intensified the trade war over the weekend, announcing a 30% tariff on imports from the European Union and Mexico, effective August 1. This followed last week’s declarations of a 35% duty on Canadian goods and a sweeping 15%–20% tariff proposal on most trading partners, in addition to a 50% tariff on copper imports. Mounting concerns over the economic fallout from these aggressive trade measures have fueled demand for gold, a traditional refuge during times of uncertainty.
⭐️Personal comments NOVA:
Continued price increase, tariff pressure helps gold to be positive again
⭐️SET UP GOLD PRICE:
🔥SELL GOLD zone: 3384- 3386 SL 3391
TP1: $3376
TP2: $3364
TP3: $3352
🔥BUY GOLD zone: $3308-$3310 SL $3303
TP1: $3319
TP2: $3328
TP3: $3340
⭐️Technical analysis:
Based on technical indicators EMA 34, EMA89 and support resistance areas to set up a reasonable BUY order.
⭐️NOTE:
Note: Nova wishes traders to manage their capital well
- take the number of lots that match your capital
- Takeprofit equal to 4-6% of capital account
- Stoplose equal to 2-3% of capital account

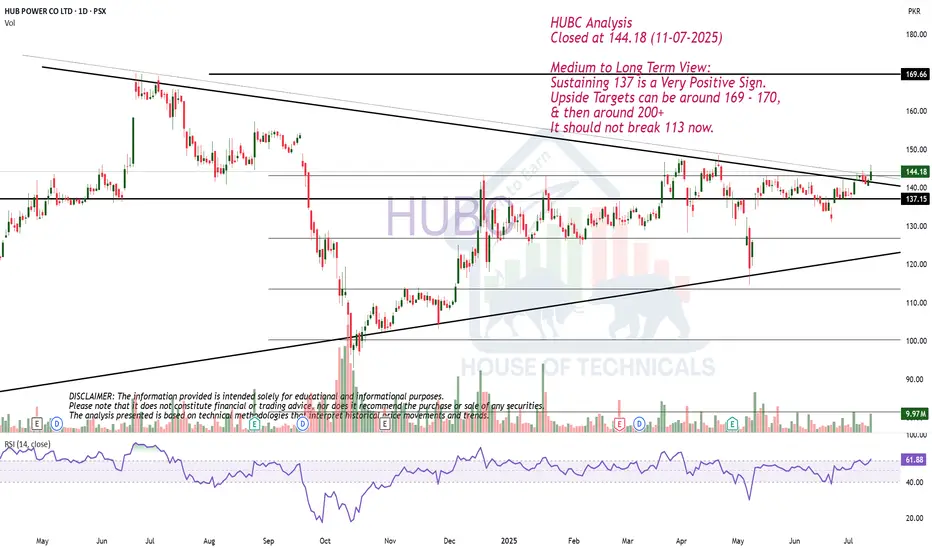
Medium to Long Term View.HUBC Analysis
Closed at 144.18 (11-07-2025)
Medium to Long Term View:
Sustaining 137 is a Very Positive Sign.
Upside Targets can be around 169 - 170,
& then around 200+
It should not break 113 now.
short recovery, trend line✍️ NOVA hello everyone, Let's comment on gold price next week from 07/14/2025 - 07/18/2025
⭐️GOLDEN INFORMATION:
Gold prices surged nearly 1% on Friday as market sentiment soured in response to US President Donald Trump’s controversial trade policies targeting Canada, while hinting at broader tariffs on other nations and copper. At the time of writing, XAU/USD is trading at $3,354, rebounding from intraday lows of $3,322.
On Thursday, Trump announced a 35% tariff on Canadian imports, though goods complying with the 2020 USMCA trade agreement remain exempt. He also signaled intentions to expand tariffs across most trading partners, proposing blanket rates ranging from 15% to 20%.
With a light US economic calendar, attention turned to Fed commentary. Chicago Fed President Austan Goolsbee pushed back on calls for rate cuts aimed at reducing government borrowing costs, stressing the central bank’s focus remains firmly on employment and price stability.
⭐️Personal comments NOVA:
growth according to the trend, maintaining the accumulation price zone above 3300
🔥 Technically:
Based on the resistance and support areas of the gold price according to the H4 frame, NOVA identifies the important key areas as follows:
Resistance: $3392, $3447
Support: $3330, $3308, $3246
🔥 NOTE:
Note: Nova wishes traders to manage their capital well
- take the number of lots that match your capital
- Takeprofit equal to 4-6% of capital account
- Stoplose equal to 2-3% of capital account
- The winner is the one who sticks with the market the longest

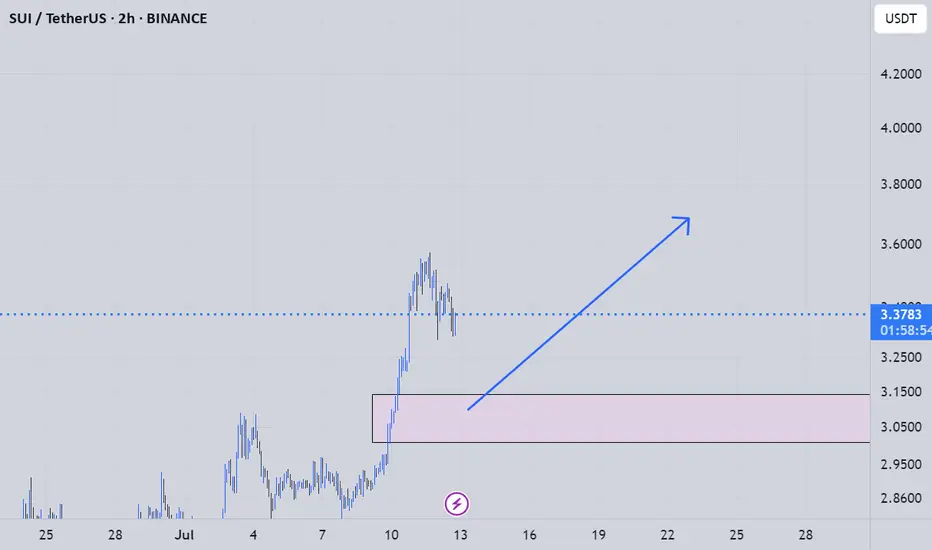
suiusdt long analysyou can use this analys for your spot trades its a longsetup for making a good profit and a getting on a big trend