MOSCHIP📊 Stock Analysis: MOSCHIP
The stock has been consolidating within a ascending triangle pattern and is nearing a critical Buy Above level at ₹187 , signaling a potential breakout. The target is set at ₹359, offering a potential gain of 25.90%. Key insights:
Trend: A breakout above the wedge could indicate renewed bullish momentum.
Support Levels: Strong support around ₹170/197, making this a low-risk entry point.
Volume Buzz: The recent increase in volume shows rising investor interest.
🔔 Keep an eye on this setup! Always analyze your risk tolerance before making any decisions.
📢 Disclaimer: This post is for educational purposes and not financial advice. Conduct your research or consult a financial advisor before investing.
What are your thoughts? Share them below! 📝
#StockTrading #TechnicalAnalysis #BreakoutTrading #MOSCHIP
Longterm

$BUSDT Ready to Explode? Breakout Could Send It Flying#BUSDT is demonstrating strong potential for a pennant breakout.
A successful breakout could trigger a +60% bullish rally in the coming days. 🚀
#Altseason2025

BTC breakout soon and return to ATH💎 Update Plan BTC (May 29)
Notable news about BTC:
The overall cryptocurrency market capitalization has remained relatively stable over the past 24 hours, hovering near the $3.42 trillion level. Digital assets appear largely indifferent to the recent rally in equities, as gains in traditional markets are driven by corporate earnings and tariff-related developments rather than shifts in monetary policy or liquidity conditions. Meanwhile, the US Dollar is strengthening for a third consecutive session, adding further pressure.
Bitcoin (BTC) has pulled back from the upper end of its recent trading range near $110,000, settling closer to the $107,000 mark. This pause near previous highs has helped ease short-term market overheating. As institutional participation in Bitcoin deepens, its price behavior is increasingly mirroring that of traditional financial instruments like equities and commodities—marked by more tempered momentum and fewer fear-driven surges.
Technical analysis angle
It is still a 107k bumper area that brings profits to Buyer. But the worrying thing here is that the vertices of BTC are lower.
We will have two scenarios for BTC:
) First within the next 1 week, the organizers still go in this flag model and gradually narrow towards the top. If the price line follows this model, it will be negative for BTC and investors
) Secondly: BTC price will breakout area 109k, the target will go straight to 113k-115k and lower boundary if Breakout area 107k will return to 102k-100k
🔥BTC 4H is currently in the adjustment phase, this time will cause a lot of traders, Future - Margin to lose money, this rhythm will last long
At this time, whether new or old, should spend more time to practice, load more knowledge about the PTKT, as well as find knowledge posts at the channel ..., to strengthen the solid foundation, as well as avoid losing money at this time offline
==> Comments for trend reference. Wishing investors successfully trading

BTCUSDT LONG - TRADING PLANBTC Making a ABCD Pattern and follow the Trend Line it mate break the trend line but we have to focus on High High and High Low. My Entry is on pervious HH and my TP is D Point. I hope you Get this Trade. Thank you

IBM: Bullish AttemptsIBM has made progress in our scenario: Currently, the price is rising above the crucial resistance at $265.72; clearly surpassing this mark is important in the ongoing wave (3) in magenta. While we cannot entirely remove our alternative scenario with a new low for wave alt. in green, it still holds a 33% probability. We primarily expect that the regular wave in green was already completed at $211.52 and are therefore preparing for a direct continuation of the increases in the broader wave in green.
📈 Over 190 precise analyses, clear entry points, and defined Target Zones - that's what we do.


$AXIBT Breakout Confirmed – 2x Potential Ahead?$AXIBT just broke above a key accumulation zone after days of consolidation.🚀
Strong volume, bullish Ichimoku support, and a clean breakout above resistance suggest this could be the start of a major move.
If this rally continues, we could see a sharp push toward the $0.50+ zone, nearly 2x from here.
Reclaiming and holding above the $0.22–$0.24 zone is crucial for confirmation.
Eyes on this one.

Symmetrical Triangle Breaks – $ETHFI Targets $2+CRYPTOCAP:ETHFI just broke out of a strong symmetrical triangle on the 2H chart finally escaping a long consolidation phase.
Price surged above resistance and reclaimed key EMAs, showing clear bullish momentum. If this breakout sustains, the next leg could take us toward $2.00+
Risk is tight below $1.27 the breakout zone and previous resistance-turned-support.
This move could be the start of something big.
Watch closely!

What is Bitcoin Dominance, and When Can We Expect Altseason?What is Bitcoin Dominance, and When Can We Expect Altseason?
✅ In the fast-paced and ever-changing world of digital currencies, traders and investors are continually seeking signs and tools to aid them in making informed decisions. One key sign is Bitcoin Dominance (BTC.D).
Understanding this and examining its chart can provide us with important clues about what the market might do next, especially regarding when Altseason (the period of growth for altcoins) might begin.
CRYPTOCAP:BTC.D
What is Bitcoin Dominance (BTC.D)?
Simply put, Bitcoin Dominance indicates the percentage of the total value of all digital currencies that is held by Bitcoin. For example, if the total value of all digital currencies is $1 trillion and Bitcoin's value is $600 billion, then Bitcoin's Dominance is 60%.
This number is very important because:
It shows market feeling: When Bitcoin Dominance goes up, it usually means money is moving to Bitcoin as a safer option, and people are less willing to take risks. When Bitcoin Dominance goes down, it can mean people are more confident in altcoins and are ready to take more risks for bigger profits.
It shows money flow: Changes in BTC.D show how money is moving between Bitcoin and altcoins.
❓ What is Altseason?
Altseason is a time in the digital currency market when altcoins (digital currencies other than Bitcoin) do much better than Bitcoin, and their prices go up a lot.
During Altseason, money often flows from Bitcoin to altcoins, and many altcoins can see their prices increase many times over.
Looking at the Current Bitcoin Dominance Chart and forecasting Altseason
If we look at the provided chart for Bitcoin Dominance (BTC.D), we can see a few key things:
Long-term upward channel: The chart shows that Bitcoin Dominance has been in a long-term upward path. The bottom of this path is marked by a blue support line , and the top is marked by a red resistance line . This means that, in the bigger picture, Bitcoin's control over the market has been growing.
Broken short-term upward trend: There was a shorter-term upward trend line (shown in black on the image) that the price broke below on May 9th . This break could be an early warning sign that Bitcoin's dominance might be weakening in the short term, and its dominance might start to fall.
⚠️ But here is a very important point:
We cannot be sure that Altseason has definitely started until the price clearly breaks below the main support line of the channel (the blue line) and stays below it.
The break of the short-term upward trend line (black line) is an early signal. However, to confirm a change in the trend and the possible start of a significant Altseason, we need to see stronger support levels, like the blue support line on the chart, get broken.
⏳ So, When Should We Expect Altseason?
Based on the chart analysis and the points mentioned:
Early Sign: The break of the short-term upward trend line (black) on May 9th might make people pay more attention to altcoins, but it's not enough on its own.
Key Condition for Altseason: The most important signal for the start of a real Altseason would be if the Bitcoin Dominance price breaks below the blue support line of the long-term upward channel. As long as Bitcoin Dominance stays above this support line, Bitcoin will likely keep its relative strength in the market, and altcoins might only see limited growth or could even face selling pressure.
Conclusion:
Analyzing Bitcoin Dominance is a useful tool for understanding how the digital currency market works and for predicting possible trends. Right now, because the short-term trend line has been broken, the market is at a sensitive point. However, traders and investors should watch the BTC.D price movements very carefully and wait for stronger confirmations, especially a possible break of the blue support line, before announcing the start of Altseason.

$BEAM Coiling Up in the Golden Zone – Breakout Incoming?NASDAQ:BEAM is consolidating inside a symmetrical triangle, right near the 0.5–0.618 Fib golden pocket a zone where strong moves often begin.
It’s a clean setup with a good risk-reward and a clear stop-loss.
Keeping this on watch and accumulating inside the pattern, a breakout could push the price toward $0.009 or higher.
DYOR, NFA

Gold price accumulates above 3300, new week⭐️GOLDEN INFORMATION:
Gold (XAU/USD) faced some selling pressure around the $3,335 mark during Monday’s early Asian session, as easing trade tensions slightly dampened demand for the safe-haven asset. The recent softening in rhetoric surrounding global trade disputes has contributed to the metal’s pullback, though upcoming economic events could shift momentum.
On Sunday, US President Donald Trump announced a delay in imposing the proposed 50% tariffs on the European Union until July 9, easing fears of an imminent escalation in trade hostilities. This development has weighed on bullion prices by reducing immediate risk aversion in the markets.
Nonetheless, investor attention now turns to Wednesday’s release of the FOMC Minutes, which could offer further clarity on the Federal Reserve’s monetary policy outlook. Meanwhile, market participants will continue to monitor trade negotiations between the US and Japan, as well as other major economies. Any renewed tensions or setbacks in these discussions could quickly revive demand for gold as a protective hedge.
⭐️Personal comments NOVA:
Gold prices reacted slightly lower after the official announcement of tariff postponement. Accumulated above 3300
⭐️SET UP GOLD PRICE:
🔥SELL GOLD zone : 3388- 3390 SL 3395
TP1: $3376
TP2: $3363
TP3: $3350
🔥BUY GOLD zone: $3301- $3299 SL $3294
TP1: $3312
TP2: $3325
TP3: $3338
⭐️Technical analysis:
Based on technical indicators EMA 34, EMA89 and support resistance areas to set up a reasonable BUY order.
⭐️NOTE:
Note: Nova wishes traders to manage their capital well
- take the number of lots that match your capital
- Takeprofit equal to 4-6% of capital account
- Stoplose equal to 2-3% of capital account

$FET has formed an ascending triangle pattern!NYSE:FET has formed an ascending triangle pattern!
After getting rejected from the $0.93–$0.95 resistance zone, price pulled back but it's holding above this lower trend-line support and this 100EMA.
If this support holds, we could see a move back toward the resistance zone, and maybe even a breakout above it.
DYOR, NFA

$GRASS just broke out of a long-term downtrend!$GRASS just broke out of a long-term downtrend!
#GRASS has broken out of a long-term symmetrical triangle and flipped the trend bullish.
Price is currently holding above the breakout zone and also respecting the 0.786 fib level from the recent range.
As long as it stays above the $2.13–$2.14 zone, the move toward $2.60+ looks likely.
This breakout could be the start of a bigger trend shift. Let’s see how it holds up in the coming days.
DYOR, NFA

$PENGU is prepared for a bounce! CSECY:PENGU is prepared for a bounce!
Price is still moving inside the rising channel and just touched the lower support line.
As long as it stays above the $0.0128–$0.0132 zone, we could see a bounce toward the top of the channel near $0.018.
This setup offers a good risk-reward.
Entry: $0.0130
Stop-loss: $0.0119
DYOR, NFA
#cryptocurrencies

Moving in the uptrend, bulls dominate⭐️GOLDEN INFORMATION:
Gold prices slipped by approximately 0.48% on Thursday, retreating from a two-week peak of $3,345 and falling below the key $3,300 level. The decline was driven by renewed strength in the US Dollar, even as Treasury yields pulled back from their intraday highs. The pressure on the yellow metal intensified after the US House of Representatives passed President Trump’s budget proposal, which now heads to the Senate for final approval. At the time of writing, XAU/USD is trading at $3,289, marking a 0.83% daily loss.
While sentiment in the broader market has seen a modest rebound, it remains fragile following Moody’s recent downgrade of US sovereign debt. The fiscal package approved by the House is expected to raise the national debt ceiling by a staggering $4 trillion, amplifying concerns over long-term fiscal sustainability.
⭐️Personal comments NOVA:
Gold price is still moving in the H1 uptrend line, buying power is still quite strong.
⭐️SET UP GOLD PRICE:
🔥SELL GOLD zone : 3344- 3346 SL 3351
TP1: $3335
TP2: $3322
TP3: $3307
🔥BUY GOLD zone: $3248- $3246 SL $3241
TP1: $3258
TP2: $3270
TP3: $3280
⭐️Technical analysis:
Based on technical indicators EMA 34, EMA89 and support resistance areas to set up a reasonable BUY order.
⭐️NOTE:
Note: Nova wishes traders to manage their capital well
- take the number of lots that match your capital
- Takeprofit equal to 4-6% of capital account
- Stoplose equal to 2-3% of capital account

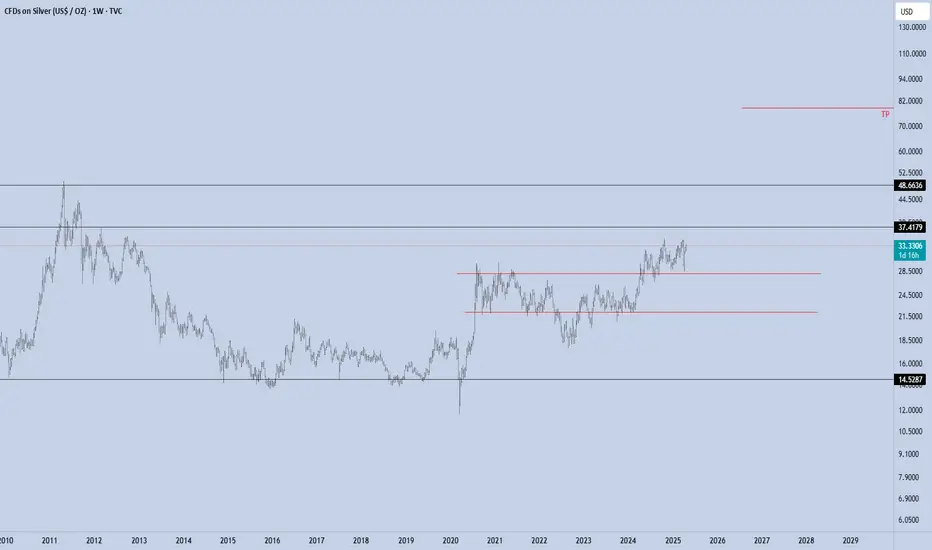
SILVER - Late But Harder Time to load up for the long term. Gold's going crazy right now while silver's still sleeping. This discount ain't gonna last.
#ChillGuy Breakout Confirmed – Long Setup Active!#ChillGuy has broken out of a symmetrical triangle and is currently holding above horizontal support in the short term, which looks strong !
We can consider a long position at the current market price (CMP) with a stop-loss at $0.0857.
If the market plays out as expected, we could see a solid move from here.
DYOR, NFA

BTC traffic update and channel exit.As we can see, the BTC price is moving according to the previously mentioned rules. Here we can see how the price left channel number 1 at the top, and the increase after leaving the channel gave an upward movement at the level of the height of the channel itself.
In this situation, it is worth paying attention to channel number 2, from which we also previously got an exit at the top with a strong upward movement, currently we can see how the price is fighting with strong resistance at the level of $ 111,500, however, taking into account the height of channel number 2, we can mark the level of around $ 121,500 as another very strong resistance.

#BITCOIN HISTORY IS ABOUT TO REPEAT !!#Bitcoin HISTORY IS ABOUT TO REPEAT! 🔥
The next move is obvious…
🔹 November 2023: Major breakout led to a 140% rally
🔹 October 2024: Another breakout fueled a 50% move
🔹 Now — May 2025: We are currently observing the Semmeler structure; will it break out again? 👀
New ATH loading... 🚀
CRYPTOCAP:BTC BITSTAMP:BTCUSD BINANCE:BTCUSDT

Will BTC endure and continue to reach further highs?As we can see, the BTC price has broken the previous ATH and established a new one at $ 109,886, but here we have to see that we had a slight breakout and the price immediately returned below the previous peak. At this point, we should observe whether it will positively break out from the previous peak and whether it will stay above it so that it can gather energy for a strong move towards strong resistance at $ 130,000.
However, if we see a correction, it may first go down to $ 101,500, then we can see support at $ 96,000, and then we may have a drop to around $ 87,000.
When we look at the Stoch RSI indicator, we will see that despite the current increases, the indicator remains around the middle of the range, which could potentially give room for another upward move.

Platinum: The New Gold for the Next Decade?For centuries, Gold has been the ultimate store of value, a safe haven in times of economic uncertainty. However, as Gold potentially enters a multi-year distribution phase, investors may need to look elsewhere for the next big opportunity. Enter Platinum, a metal that is rarer, more versatile, and increasingly relevant in the modern industrial landscape.
Gold’s Distribution Phase and Bitcoin’s Speculative Nature
Gold has historically been a hedge against inflation and economic downturns, but recent trends suggest it may be topping out. Central banks have been stockpiling Gold, yet its price movements indicate a possible stagnation. Meanwhile, Bitcoin, once hailed as "digital gold," has shown extreme volatility, largely driven by speculation and relentless social media hype. Unlike Gold, Bitcoin lacks intrinsic value, and its future remains uncertain as institutional interest fluctuates.
Why Platinum Stands Out
Platinum is 30 times rarer than gold and has been in an accumulation phase since 2015. Unlike Palladium, which is highly volatile, Platinum maintains a more stable price structure. Its industrial applications make it indispensable in sectors such as:
Automotive Industry : Used in catalytic converters to reduce emissions.
Clean Energy & Hydrogen Economy : Essential in fuel cells for green energy.
Cloud Computing & Electronics : Platinum’s conductivity makes it valuable in advanced computing.
Space Exploration & Aerospace : Its resistance to extreme temperatures makes it ideal for high-tech applications.
Medical & Biomedical Uses : Found in cancer treatments and medical implants.
The Future of Platinum
With global trends shifting toward industrialization and sustainability, platinum’s demand is set to rise. Supply constraints, primarily due to limited mining operations in South Africa, further add to its scarcity. As gold enters a distribution phase, platinum is positioned to take off, potentially becoming a new standard for wealth preservation and industrial utility.
TVC:PLATINUM TVC:PALLADIUM TVC:GOLD TVC:SILVER MARKETSCOM:BITCOIN TVC:DXY SP:SPX EURONEXT:N100 BITSTAMP:BTCUSD OANDA:XAUUSD OANDA:XPTUSD OANDA:XPDUSD OANDA:XAGUSD

Trading around 3200 at the beginning of the week⭐️GOLDEN INFORMATION:
Gold (XAU/USD) is staging a recovery from recent losses, trading around $3,230 per troy ounce during Monday’s Asian session, as investors seek refuge in safe-haven assets amid growing anxiety over the US economic outlook and fiscal sustainability.
The rebound comes on the heels of Moody’s decision to downgrade the US credit rating by one notch, from Aaa to Aa1, citing mounting debt and a rising burden from interest payments. This follows earlier downgrades by Fitch in 2023 and S&P in 2011. Moody’s now projects US federal debt to surge to roughly 134% of GDP by 2035, up from 98% in 2023, driven by ballooning debt-servicing costs, expanding entitlement programs, and weakening tax revenues—all of which have intensified investor concerns and lent fresh support to gold prices.
⭐️Personal comments NOVA:
Gold traded around 3200 at the beginning of the week, not much news impact, continue sideways
⭐️SET UP GOLD PRICE:
🔥SELL GOLD zone : 3259- 3261 SL 3266
TP1: $3250
TP2: $3240
TP3: $3230
🔥BUY GOLD zone: $3192 - $3190 SL $3185
TP1: $3200
TP2: $3210
TP3: $3220
⭐️Technical analysis:
Based on technical indicators EMA 34, EMA89 and support resistance areas to set up a reasonable BUY order.
⭐️NOTE:
Note: Nova wishes traders to manage their capital well
- take the number of lots that match your capital
- Takeprofit equal to 4-6% of capital account
- Stoplose equal to 2-3% of capital account

TATATECHKeep eye on TATATECH. If the price moves above 732, consider buying with a small SL.
Confirmation of the head and shoulders pattern occurs when the price breaks decisively below the neckline
Disclaimer:
This is not financial advice. Please do your own research or consult with a financial advisor before making any investment decisions. Investments in stocks can be risky and may result in loss of capital.
