BTC - Correction Phase Almost Done 👌Hello TradingView Family / Fellow Traders,
Based on my recent BTC analysis (attached on the chart), we anticipated the onset of a bearish correction around the upper boundary of the channel, unless there is an upward break of the last high marked in red.
📉 BTC fell short of surpassing the previous minor high and, instead, was rejected at the upper bound of the channel, leading to a subsequent decline.
📈 Currently, BTC is approaching the lower boundary of the channel. As a result, we will be on the lookout for trend-following buy setups, knowing that BTC might still test the lower red trendline before the bullish trend resumes.
📉 We will be on the lookout for buy setups unless there is a downward break of both the lower red trendline and the 40,000 level. In such a scenario, we anticipate a medium-term shift in momentum from bullish to bearish.
📚 Always follow your trading plan regarding entry, risk management, and trade management.
Good luck!
All Strategies Are Good; If Managed Properly!
~Richard Nasr
Longterm

Pfizer.... Start buildingPfizer is one of those companies that we all feel has been shady and the stock value shows it. As much as human emotion can draw this value down, hedge funds and smart money will start stepping in now. The chart says it all. We are talking about one of the longest running publically traded companies folks, this will rebound. Its not a matter of if, but when.
I have started a minor position in Pfizer today and plan to DCA weekly small amount until we form a bullish trend.
Good luck!

BTC - Top-Down Analysis 📹 2024 RoadmapHello TradingView Family / Fellow Traders. This is Richard, also known as theSignalyst.
📈 Here is a detailed update top-down analysis for #BTC.
Which scenario do you think is more likely to happen? and Why?
📚 Always follow your trading plan regarding entry, risk management, and trade management.
Good Luck!.
All Strategies Are Good; If Managed Properly!
~Rich

AUDCHF - Top-Down Analysis 📹 From Weekly To M30Hello TradingView Family / Fellow Traders. This is Richard, also known as theSignalyst.
📈 Here is a detailed update top-down analysis for #AUDCHF.
Which scenario do you think is more likely to happen? and Why?
📚 Always follow your trading plan regarding entry, risk management, and trade management.
Good Luck!.
All Strategies Are Good; If Managed Properly!
~Rich

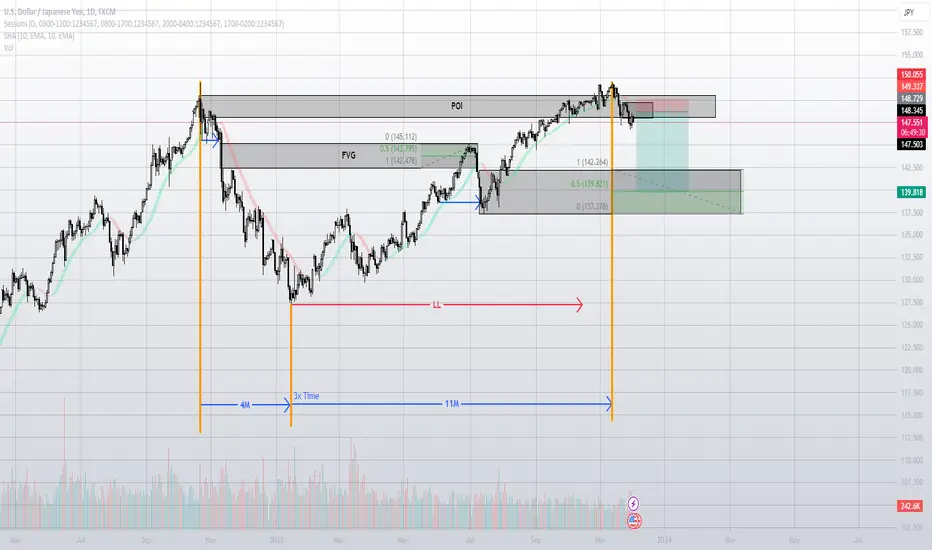
Short USDJPYLong term short position, explanation shown! The price is in a strong Short POI, I used external ExpertAdvisors, available only for mt5, and indicators, including LVL2 data. Not investment advice!!!!
Short position is placed on the chart for illustrative purposes only! Always Analyze and look for your own entry, don't blindly follow anyone!
GBP/USD prepare for longsHere we can see a detailed look at the Wyckoff Accumulation. The question is are we in Phase E (Trend out of Range) at the end? Is it preparing to mark up, or is GBP/USD going to fall back within the Trading Range and move lower to touch the trendline? Let see on Monday! We will trade the New York session, during the European session we will monitor how the price develops.

AUDCHF - Trading The Channel 🌙Hello TradingView Family / Fellow Traders. This is Richard, also known as theSignalyst.
📉 AUDCHF has been overall bearish trading inside the falling channel in red, and it is currently approaching around the upper bound / trendline.
Moreover, the zone 0.59 is a strong resistance.
🏹 So the highlighted red circle is a strong area to look for sell setups as it is the intersection of the green resistance and upper red trendline acting as a non-horizontal resistance.
📚 As per my trading style:
As AUDCHF approaches the red circle zone, I will be looking for bearish reversal setups (like a double top pattern, trendline break , and so on...)
📚 Always follow your trading plan regarding entry, risk management, and trade management.
Good luck!
All Strategies Are Good; If Managed Properly!
~Rich

BITCOIN: HISTORICAL CYCLES AND HEALING ROADMAP!THIS CHART IS BASED ON HISTORICAL DATA
In the first cycle, after the ATL, CRYPTOCAP:BTC took 532 days to break above it’s previous ATH.
In the second cycle, it’s taken 546 days to break above its previous ATH.
If history repeats itself, we could see a new ATH around 385 days from today, possibly by December
2024.
ROADMAP FOR BITCOIN HEALING
First Halving: July 9, 2016
546 days of the bull market!
Second Halving: May 11, 2020
546 Days of Bull Market after Halving 3
Third Halving: April 25, 2024 (Expected)
Likely to last 528 days to 546 days of bull market.
Based on fractal analysis and chart data, it is anticipated that Bitcoin will reach its next bull market peak in September 2025. Subsequently, a shift back into the bear market is expected. Consequently, a decision to exit the market before September is considered, given that these projections are assumptions derived from fractal chart data.
I hope this graph clarifies how BTC's long-term growth dynamics work.
Only in a probabilistic approach, this concept is.
This chart is likely to help you make better trade decisions if you consider upvoting it.
I would also love to know your charts and views in the comment section.
Thank you

ETH - Wait For The Bulls 🏆Hello TradingView Family / Fellow Traders,
ETH has been overall bullish trading inside the rising channel in blue, and it is currently in a correction phase retesting the lower bound / blue trendline.
Moreover, it is approaching a strong support zone 2150.0
🏹 So the highlighted blue circle is a strong area to look for buy setups as it is the intersection of the red support and lower blue trendline acting as a non-horizontal support.
📈 As per my trading style:
As BITRUE:ETHUSDT approaches the blue circle zone, I will be looking for bullish reversal setups (like a double bottom pattern, trendline break , and so on...)
📚 Always follow your trading plan regarding entry, risk management, and trade management.
Good luck!
All Strategies Are Good; If Managed Properly!
~Richard Nasr

SasanSeifi 💁♂ CHZ 3D ⏩ 0.10 /0.12 As you can see in the long-term 3-day time frame, the price has been rising from the demand zone of 0.053. After liquidating the buyers from the liquidity zone, the price corrected slightly and completed a pullback. Then, it faced buying demand again from the price zone of 0.072. It is currently trading at the price zone of 0.092. There is a possibility of further growth.
Our expectation is that if the price remains in the price zone of 0.087/0.084 in the medium term, we will see further growth of the price to the zones of 0.10/0.12. In the case of growth, in order to better understand the continuation of the movement trend, we need to see how the price will react to the target resistance zones.
In addition, if the price penetrates below the price zone of 0.084 and stabilizes, the price may face further correction.
🔵Remember, always conduct your analysis and consider other factors before making any trading decisions. Good luck!"✌️
❎ (DYOR)...⚠️⚜️
Sure, if you have any more questions or need further clarification, feel free to ask. I'm here to help!
if you found my analysis helpful, I would appreciate it if you could show your support by liking and commenting. Thank you!🙌✌

INJ on resistance level as predicted!INJUSDT has reached the big resistance level as we predicted short time ago.
From here it will retrace and consolidate before a next leg up!

potential reversal zone D1 or D2|EURUSD at weakly supply zone 1.06500 and 1.05241 liquidity taking creates the weekly supply zone thus expecting a reversal to 1.08307 or 1.07596 - 1.06534 demand zone

BTC - Still Strong 🏆Hello TradingView Family / Fellow Traders,
🏹 After breaking above the orange symmetrical triangle, BTC initiated a new parabolic impulse and has been bullish trading within the ascending red channel.
Presently, BTC is hovering near the upper boundary of the channel, which could potentially lead to a bearish correction.
📉 In such a scenario , as BTC approaches the intersection of the lower red trendline and $40,000, we will be on the lookout for trend-following buying opportunities.
📈 Concurrently , for the bulls to assert dominance aggressively, a decisive break above the current minor high at $44,500 is crucial. In this scenario, a movement towards the $48,000 resistance level can be anticipated.
📚 Always follow your trading plan regarding entry, risk management, and trade management.
Good luck!
All Strategies Are Good; If Managed Properly!
~Richard Nasr

AUDNZD - Trading The Wedge 🌙 AgainHello TradingView Family / Fellow Traders. This is Richard, also known as theSignalyst.
As per my last AUDNZD analysis, we have been looking for sell setups around the green resistance zone.
AUDNZD traded lower and it is currently hovering around a robust demand zone.
Moreover, it is approaching the lower red trendline.
🏹 So the highlighted red circle is a strong area to look for buy setups as it is the intersection of the blue demand and red trendline acting as a non-horizontal support.
As per my trading style:
As AUDNZD approaches the red circle zone, I will be looking for bullish reversal setups (like a double bottom pattern, trendline break , and so on...)
📚 Always follow your trading plan regarding entry, risk management, and trade management.
Good luck!
All Strategies Are Good; If Managed Properly!
~Rich

XAGUSD LONGhello traders.for silver we had choch in weekly and also daily time frame.now we are in demand area and after confirmation in this zone ,price can keep going to upside.
what do you think?
R:R 2.32
“”your follows and boosts encourage me to publish more analysis””

NEAR/USDT approaching a local top?NEARUSDT analysis using the Unyx Data
Today we take a look at NEAR and its current state in the market:
- BRS: As usual let's get a feeling for the current temperature of NEARs price. We see that it is creeping up towards the over-heated zones 9 and 10 of the Rainbow Score, indicating that we should be ready to take some profits in the coming days.
- BSR: the Strength Reversion showed some sell signals in April (indicated by the red dots) as well as some buy signals in May (green dots). Currently the BSR hasn't triggered any sell signals, but as it is in an Overbuy state, this should happen any time soon.
- BUX: let's finally see what the BUX has to say. First let's take a look at the Oscillator (BUO). It clearly shows a change of trend as it is now moving more on the lower half of the oscillator, indicating that its indicators are mostly overbought. Taking a look at the screener (BUS) we see that in the Daily timeframe, all indicators expect the CCI are overbought. Looking at the smaller timeframes (1h and 4h), the overbought trend isn't much visible, but this will probably change over the day as the European and American markets wake up. On the weekly timeframe again, most of the indicators show an overbought state.
So clearly, NEAR isn't a buy right now, but if you have some in your bags it will soon be a good moment to take some profits. If you bought at the end of the summer, you should be in a profit of around 130%, depending on your average entry price.
Do you have some NEAR in your portfolio? If so, what is your next target price? Let us know!
