OYAKC - Monthly // Decision Month - LONG TERM LEVELSI believe that this month is decision month for OYAKC.Either 600 days accumulation or 600 days ATHs. Any TURP problem could occur in Turkey so check the levels.
Monthly Close below 25.6 - SL
I'll be buying it till 2030.
DYOR.
Longterm

GOLD(XAUUSD) -Weekly Forecast,Technical Analysis & Trading IdeasMidterm forecast:
2772.38 is a major support, while this level is not broken, the Midterm wave will be uptrend.
We will close our open trades, if the Midterm level 2772.38 is broken.
OANDA:XAUUSD TVC:GOLD
Technical analysis:
A peak is formed in daily chart at 3167.60 on 04/03/2025, so more losses to support(s) 3000.00, 2955.00, 2879.11 and minimum to Major Support (2772.38) is expected.
Take Profits:
2833.00
2879.11
2955.00
3000.00
3057.40
3100.00
3167.60
3200.00
__________________________________________________________________
❤️ If you find this helpful and want more FREE forecasts in TradingView,
. . . . . . . . Hit the 'BOOST' button 👍
. . . . . . . . . . . Drop some feedback in the comments below! (e.g., What did you find most useful? How can we improve?)
🙏 Your support is appreciated!
Now, it's your turn!
Be sure to leave a comment; let us know how you see this opportunity and forecast.
Have a successful week,
ForecastCity Support Team

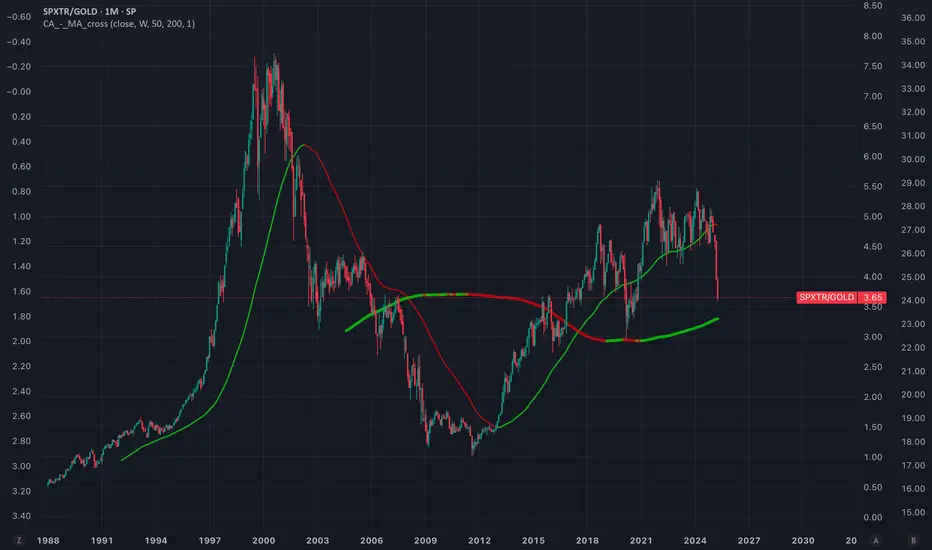
SPX/GOLD ratio near to key supportcrossing below moving average of 200 months could trigger a secular movement in favour of gold.
Potential global debt colapse and lack of confidence in USD + high valuation, mag-7 concentration and high growths expectations on AI are macro/fundamental facts that supports this idea.
XRP - Two Longs on the Horizon!Hello TradingView Family / Fellow Traders. This is Richard, also known as theSignalyst.
📈 Medium-Term: XRP broke below the $2 support zone last week, shifting the momentum from bullish to bearish.
📍 As it retests the lower bound of the channel — which perfectly intersects with the orange demand zone and the $1.5 round number — I’ll be looking for short-term longs.
🚀 For the bulls to take over in the long term and kick off the next bullish phase, a breakout above the red structure at $2.15 is needed.
Which scenario do you think will happen first — and why?
📚 Always follow your trading plan regarding entry, risk management, and trade management.
Good luck!
All Strategies Are Good; If Managed Properly!
~Rich

Bitcoin -Weekly, Daily, H4, H1 Forecasts, Trading IdeasMidterm forecast, Weekly Timeframe:
While the price is above the support 70550.04, resumption of uptrend is expected.
We make sure when the resistance at 91037.20 breaks.
If the support at 70550.04 is broken, the short-term forecast -resumption of uptrend- will be invalid.
BITSTAMP:BTCUSD MARKETSCOM:BITCOIN
Daily Timeframe:
A trough is formed in daily chart at 74545.70 on 04/09/2025, so more gains to resistance(s) 86499.57 and maximum to Major Resistance (91037.20) is expected.
Take Profits:
86499.57
91037.20
94505.46
98675.19
101430.12
105431.17
109932.89
115000.00
120000.00
125000.00
130000.00
140000.00
H4 Timeframe:
H1 Timeframe:
________________________________________________________________
❤️ If you find this helpful and want more FREE forecasts in TradingView,
. . . . . . . . Hit the 'BOOST' button 👍
. . . . . . . . . . . Drop some feedback in the comments below! (e.g., What did you find most useful? How can we improve?)
🙏 Your support is appreciated!
Now, it's your turn!
Be sure to leave a comment; let us know how you see this opportunity and forecast.
Have a successful week,
ForecastCity Support Team

WLD — Heavy Discount. Long-Term Opportunity on the TableWLD has pulled back over 80% from its previous high — a massive correction that now opens the door for long-term accumulation. The current range looks like a gift for patient players. Don’t sleep on setups like this — they don’t come often.
Follow for more high-conviction plays like this one.
Entry: 0,7-0,71
TP: 1,37-3,35

S&P 500 for 100 yearsThis is probably really dumb, but I thought it looked cool, appreciate any feedback
#longterm
#trend

THE REALITY!You cant beat the Index fund in Long term growth....Compare your portfolio with Major Indices
Warren buffet Quote - You can't Beat S&P500 Index

Long Term - Defence Fundamental PickDefence stocks are currently trading low due to the ongoing tariff trade war. Here are some strong fundamental picks to consider for long-term investment.
📊 Script: COCHINSHIP
⏱️ C.M.P 📑- 1338
🎯 PE 🏆 - 42.78
📊 Script: BDL
⏱️ C.M.P 📑- 1255
🎯 PE 🏆 - 81.3
📊 Script: GRSE
⏱️ C.M.P 📑- 1523
🎯 PE 🏆 - 44.2
📊 Script: PARAS
⏱️ C.M.P 📑- 917
🎯 PE 🏆 - 73.5
📊 Script: MAZDOCK
⏱️ C.M.P 📑- 2317
🎯 PE 🏆 - 34
⚠️ Important: Always maintain your Risk & Reward Ratio.
✅Like and follow to never miss a new idea!✅
Disclaimer: I am not SEBI Registered Advisor. My posts are purely for training and educational purposes.
Eat🍜 Sleep😴 TradingView📈 Repeat 🔁
Happy learning with trading. Cheers!🥂

Long Term - Railway Fundamental PickRailway stocks are currently trading near their 52-week low because of the market decline. Here are some solid fundamental picks to consider adding to your portfolio for the long term.
📊 Script: RVNL
⏱️ C.M.P 📑- 335
🎯 PE 🏆 - 56.1
📊 Script: RAILTEL
⏱️ C.M.P 📑- 281
🎯 PE 🏆 - 32.4
📊 Script: IRCON
⏱️ C.M.P 📑- 144
🎯 PE 🏆 - 17.7
📊 Script: IRFC
⏱️ C.M.P 📑- 122
🎯 PE 🏆 - 24.5
📊 Script: TITAGARH
⏱️ C.M.P 📑- 748
🎯 PE 🏆 - 34.6
⚠️ Important: Always maintain your Risk & Reward Ratio.
✅Like and follow to never miss a new idea!✅
Disclaimer: I am not SEBI Registered Advisor. My posts are purely for training and educational purposes.
Eat🍜 Sleep😴 TradingView📈 Repeat 🔁
Happy learning with trading. Cheers!🥂

BTC - One More Leg...Hello TradingView Family / Fellow Traders!
This is Richard, also known as theSignalyst.
📉 BTC has been overall bearish , trading within the falling channel marked in red.
But the big question is — where could the potential bottom be?
👉 I’m watching the $70,000 zone!
Here’s why:
The $70,000 area is a key confluence zone — it aligns with the lower red trendline, horizontal support, a psychological round number, and a potential demand zone.
📚 According to my trading style:
As #BTC approaches the blue circle zone, I’ll be looking for bullish reversal setups — such as a double bottom pattern, trendline break, and more.
📚 Reminder:
Always stick to your trading plan — entry, risk management, and trade management are key.
Good luck, and happy trading!
All Strategies Are Good, If Managed Properly!
~Rich

S&P 500: Historic Crash or Just Another Chance?Let’s be real: What’s happening with the S&P 500 right now is rare. This is only the fourth time in history that the index has dropped more than 10% in two days (technically three, including today’s Monday session). The other times? October 1987, November 2008 during the financial crisis, and March 2020 during the pandemic crash.
And now? We’re seeing a similar drop, this time triggered by a global tariff war , stoked by the U.S. and other governments playing chicken to see who folds first.
Yeah, it sucks. It hurts. But it could also be a hell of an opportunity.
We just tagged the 4,800 level —a place many didn’t expect to see this quickly. Neither did I. But here we are. The untapped VWAP got hit, and this might very well be the start of Wave A. Could we go lower? Absolutely. There’s a monthly Fair Value Gap around $4,500, and a drop to $4,250 isn’t out of the question either.
But here’s the thing: it depends entirely on your perspective.
If you’re trading on the 30-minute chart, this is a full-blown crisis. But zoom out to the daily, weekly, or monthly chart—and it’s just market noise.
Pull up the log chart from 1953 to 2025 in the top left corner. We’ve seen this before. A handful of times. And on that scale? Nobody cares.
If you’re in the game to build long-term wealth, this moment is just another temporary shakeout. If you’re doing dollar-cost averaging, this is exactly where you want to be adding—not panicking.
The market doesn’t care about your plan. It forces you to adapt. You can’t fight it, only flow with it.
And if you’re in it for the long haul? This is just noise. Ignore it, zoom out – and stay the course.

Delhivery seems to be at a good bargain Price Delhivery seems to be at a good bargain Price. This is a long term positional opportunity.
Note: This is not a recommendation. Markets are falling, do consult an investment advisor before making any investments.

Will ETH finally change direction?ETH is approaching support at $1,559, but here you can see how the price has fallen below the upward trend line, which could have resulted in a stronger rebound. When support is broken, you can still see a strong support level at $997, to which we can see a decline.
Only when the trend changes direction will ETH have to face resistance levels at $1,889, then $2,151, and then $2,560 before we see any major upward movements.
The Stoch RSI indicator shows us moving along a line where we could previously observe strong price rebounds, while the RSI indicator itself, taking into account the interval of one weekend, shows us approaching the level we last touched during the bear market bottom.

#LAYERUSDT setup remains active 📉 LONG MEXC:LAYERUSDT.P from $1.5722
🛡 Stop loss: $1.5440
🕒 Timeframe: 1H
✅ Market Overview:
➡️ The coin is showing "its own game" — price action is independent of #BTC and #ETH, reacting to internal volume dynamics.
➡️ Ascending triangle breakout with a confirmed close above the key $1.5440 zone.
➡️ Empty space ahead — no major resistance levels until $1.6060–$1.6210.
➡️ Accumulation is forming between $1.5440–$1.5700 — a breakout may follow.
➡️ Important: candles must close above $1.5440 to confirm the long scenario.
🎯 TP Targets:
💎 TP1: $1.5880
💎 TP2: $1.6060
💎 TP3: $1.6210 (full measured move from triangle pattern)
📢 Recommendations:
If volume MEXC:LAYERUSDT.P increases during a breakout above $1.5722 — expect a rapid move.
If price pulls back — the $1.5254 area could offer a second entry opportunity.
The coin looks strong but slightly overbought — partial take profit at TP1 is advised.
📢 A strong breakout above $1.5700 may lead to a sharp move due to lack of resistance.
📢 Avoid 1H candle close below $1.5440 — scenario invalidation.
📢 If the move occurs on weak volume — watch for a potential reversal near TP1.
🚀 MEXC:LAYERUSDT.P setup remains active — holding the key level could lead to a move toward TP2–TP3!

401(k)s: A Safe Bet or a Rigged Game?In 2008, the S&P 500 dropped 57% at its lowest, wiping out decades of savings for millions of Americans. People who were 5–10 years from retirement lost everything overnight—and they had no way out.
And here’s the problem:
• 401(k)s are heavily stock-weighted, especially those “target-date” funds that adjust based on age—but not fast enough in a crash.
• No active protection. These funds don’t hedge, use stop-losses, or rotate into cash. If the market dumps, you’re just riding it down.
• No control or transparency. Most people don’t even know what they’re invested in unless they dig deep into fund holdings.
It’s no coincidence that the same Wall Street firms managing 401(k)s make money shorting crashes or getting bailouts, while regular people are told to “just wait it out.” Sure, that might work over decades, but what if you’re close to retirement? Or just don’t want to wait 10 years for a recovery?
The Harsh Reality
• 401(k)s aren’t really optional. They’re the main retirement plan in the U.S., so most people are forced into them with few alternatives.
• Most people don’t actively manage them. They pick a default option, get put into a target-date fund, and hope for the best. That’s where the “sheep” feeling comes in.
• You can’t easily exit. There are penalties for withdrawing early, so in a crash, you’re locked in like a prisoner or financial refugee, while the “big boys” cash out first.
It’s not a scam in a legal sense—but it is a system that favors the knowledgeable and punishes the passive. Those who don’t study markets, adjust their portfolios, or take active control end up paying the price. And sadly, that’s the majority.

Reversal in Godrej Properties.On monthly Time frame, Godrej Properties is taking support at golden zone of Fibonacci retracement. Weekly closing above 2203 will the entry and closing below 1950 will be the SL. Expecting new high in coming months.
Please note: This a Monthly setup so it will be long term Investment. Will keep on adding quantity and weekly basis.

GOLD(XAUUSD) -Weekly Forecast,Technical Analysis & Trading IdeasMidterm forecast:
2772.38 is a major support, while this level is not broken, the Midterm wave will be uptrend.
We will close our open trades, if the Midterm level 2772.38 is broken.
OANDA:XAUUSD TVC:GOLD
Technical analysis:
A trough is formed in daily chart at 2832.55 on 02/28/2025, so more gains to resistance(s) 3100.00, 3150.00, 3200.00 and more heights is expected.
Take Profits:
2833.00
2879.11
2955.00
3000.00
3057.40
3100.00
3150.00
3200.00
__________________________________________________________________
❤️ If you find this helpful and want more FREE forecasts in TradingView,
. . . . . . . . Hit the 'BOOST' button 👍
. . . . . . . . . . . Drop some feedback in the comments below! (e.g., What did you find most useful? How can we improve?)
🙏 Your support is appreciated!
Now, it's your turn!
Be sure to leave a comment; let us know how you see this opportunity and forecast.
Have a successful week,
ForecastCity Support Team

New ATH , GOLD is comming 3173⭐️GOLDEN INFORMATION:
US President Donald Trump dismissed expectations that the new tariffs would target only a select group of nations with the largest trade imbalances, declaring on Sunday that reciprocal tariffs would apply universally. This announcement, coupled with the existing 25% duties on steel, aluminum, and auto imports, has intensified fears of an escalating global trade war.
Additionally, investors are increasingly convinced that the economic slowdown triggered by these tariffs will pressure the Federal Reserve (Fed) to resume rate cuts, despite persistent inflation concerns. As a result, Gold has surged to a fresh record high, marking its strongest quarterly performance since 1986.
⭐️Personal comments NOVA:
The backdrop of everything from technical to political and economic is supporting the increase in gold prices in the first quarter of 2025. Gold prices have the highest growth in history.
⭐️SET UP GOLD PRICE:
🔥 ATH : SELL 3162 - 3164 SL 3169
TP: 3155 - 3140 - 3127
🔥BUY GOLD zone: $3093 - $3091 SL $3086
TP1: $3100
TP2: $3110
TP3: $3120
⭐️Technical analysis:
Based on technical indicators EMA 34, EMA89 and support resistance areas to set up a reasonable BUY order.
⭐️NOTE:
Note: Nova wishes traders to manage their capital well
- take the number of lots that match your capital
- Takeprofit equal to 4-6% of capital account
- Stoplose equal to 2-3% of capital account

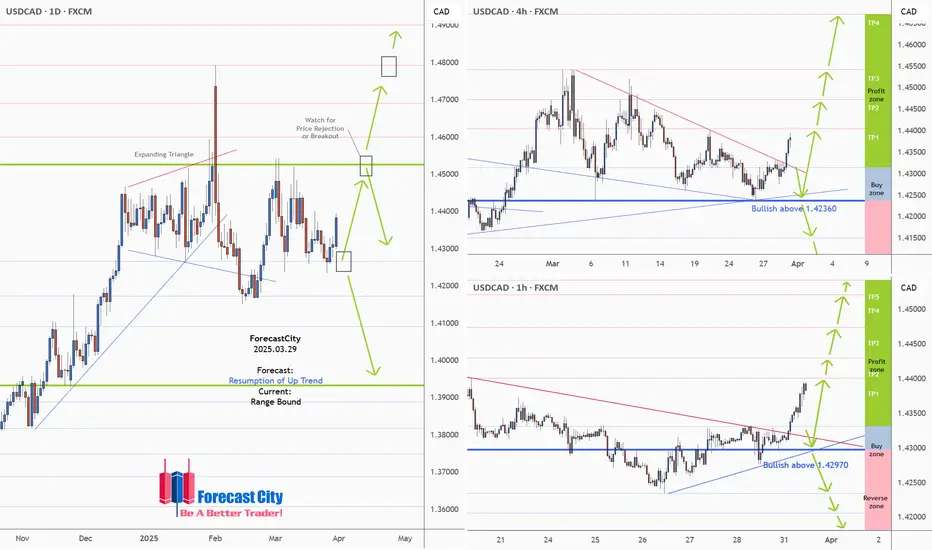
USDCAD -Weekly Forecast,Technical Analysis & Trading Ideas
Technical analysis is on the chart!
No description needed!
OANDA:USDCAD
________________________________________________________________
❤️ If you find this helpful and want more FREE forecasts in TradingView,
. . . . . . . . Hit the 'BOOST' button 👍
. . . . . . . . . . . Drop some feedback in the comments below! (e.g., What did you find most useful? How can we improve?)
🙏 Your support is appreciated!
Now, it's your turn!
Be sure to leave a comment; let us know how you see this opportunity and forecast.
Have a successful week,
ForecastCity Support Team
ATH 3127, continues to aim for big growth⭐️GOLDEN INFORMATION:
Gold's record-breaking rally continues unchecked as buyers push prices past the $3,100 milestone for the first time ever. Mounting concerns over a potential global trade war and rising stagflation risks in the United States (US) have further fueled demand for the safe-haven metal, reinforcing its status as a store of value.
A recent report from The Wall Street Journal (WSJ) suggests that US President Donald Trump may introduce even higher and broader reciprocal tariffs on April 2, known as “Liberation Day.” This prospect has sent fresh waves of risk aversion rippling through global markets, amplifying investor uncertainty.
⭐️Personal comments NOVA:
Tariff pressure, fears of trade war outbreak in April. Gold price is growing continuously, expected to reach 3127
⭐️SET UP GOLD PRICE:
🔥SELL GOLD zone: $3126 - $3128 SL $3133
TP1: $3120
TP2: $3110
TP3: $3100
🔥BUY GOLD zone: $3092 - $3094 SL $3087
TP1: $3098
TP2: $3103
TP3: $3110
⭐️Technical analysis:
Based on technical indicators EMA 34, EMA89 and support resistance areas to set up a reasonable BUY order.
⭐️NOTE:
Note: Nova wishes traders to manage their capital well
- take the number of lots that match your capital
- Takeprofit equal to 4-6% of capital account
- Stoplose equal to 2-3% of capital account

SPY Price Projection: Mid-2025 TargetRevealing Market Trends: Logarithmic Regression Analysis Indicates Bullish Path for SPY
In the ever-evolving realm of financial analysis, the search for reliable predictions remains ongoing. Logarithmic scale regression analysis, coupled with potent indicators, has emerged as a promising tool for discerning trends, particularly regarding assets like the SPY.
This analysis delves into the utilization of logarithmic scale regression alongside two robust indicators, offering insights into the potential trajectory of the SPY's price movement. It's essential to note that the interpretations and predictions presented are based on my analysis alone and should not be construed as financial advice. As with any market analysis, uncertainties persist, and actual outcomes may diverge from projections.
Logarithmic scale regression accounts for the exponential nature of price movements, providing a nuanced perspective on long-term trends. When combined with indicators such as moving averages or momentum oscillators, the analysis gains depth, revealing not only the direction but also the strength of the trend.
After meticulous examination of historical data and the application of analytical tools, our analysis suggests a bullish trajectory for the SPY, with a projected price nearing 620 EUR by mid-2025. This projection implies a significant uptrend from the current date, with a potential increase of approximately 20% over the specified timeframe.
However, it's crucial to approach such forecasts with caution, recognizing the inherent risks associated with financial markets. While our analysis indicates a positive outlook, market conditions can change rapidly, leading to deviations from expected trends.
In summary, logarithmic scale regression analysis, supported by robust indicators, offers valuable insights into market trends and potential price movements. While our analysis suggests a bullish sentiment for the SPY, investors should conduct thorough research and seek professional advice before making investment decisions.
Disclaimer: The analysis provided is based on personal interpretation and should not be considered financial advice. Investing in financial markets carries risks, and actual outcomes may differ. Readers are encouraged to conduct their own research and consult with financial professionals before making investment decisions.

Reciprocal tariffs - gold continues to rise✍️ NOVA hello everyone, Let's comment on gold price next week from 03/31/2025 - 04/04/2025
🔥 World situation:
Gold prices surged on Friday, reaching a new all-time high of $3,086 as uncertainty surrounding US trade policy and an uptick in the Federal Reserve's (Fed) preferred inflation gauge fueled demand for the safe-haven metal. Following this, market sentiment suggests growing confidence that the Fed will implement two rate cuts in 2025. At the time of writing, XAU/USD trades at $3,079, up 0.79%.
Investor sentiment remains cautious as markets brace for April 2, dubbed “Liberation Day” by US President Donald Trump, who has signed an executive order imposing a 25% tariff on all imported automobiles. This move has sparked global reactions, particularly from Canada and the European Union (EU), both of which are preparing retaliatory measures in response to the tariffs.
🔥 Identify:
Gold price moves up, early April will continue to explode to NEW Ath
🔥 Technically:
Based on the resistance and support areas of the gold price according to the H4 frame, NOVA identifies the important key areas as follows:
Resistance: $3100, $3132, $3150
Support : $3002, $2957
🔥 NOTE:
Note: Nova wishes traders to manage their capital well
- take the number of lots that match your capital
- Takeprofit equal to 4-6% of capital account
- Stoplose equal to 2-3% of capital account
- The winner is the one who sticks with the market the longest
