Technical & Historical Key TakeawaysThis chart analyzes the historical price cycles of Gold (XAU/USD) over the past decades, focusing on the alternation between long bull runs and prolonged bear markets.
You highlighted clear phases:
1970 - 1980: 10-year Bull Run
Massive price rally, followed by a sharp correction.
1980 - 2001: 20-year Bear Market
Prolonged sideways and downward movement.
2001 - 2011: 10-year Bull Run
Strong upward trend, reaching new all-time highs.
2011 - 2016: 5-year Bear Market
Significant correction but shorter in duration.
2016 - 2025: 10-year Bull Run
Another strong bullish phase, possibly ending in May 2025.
🔮 Scenarios projected:
Scenario 1 (Blue path):
A shorter bear market (5 years) similar to 2011-2016 correction, then continuation of the long-term uptrend.
Scenario 2 (Yellow path):
Gold enters a long-term 20-year bear market, similar to what happened post-1980.
You are asking if Gold is now entering a short bear phase (Scenario 1) or will fall into a multi-decade bear market (Scenario 2).
Cyclicality of Gold:
Gold has shown repetitive cycles of 10-year bull runs followed by either short (5-year) or long (20-year) bear markets.
These cycles seem to reflect macroeconomic shifts (inflation, interest rates, global crises).
Current Cycle (2016 - 2025):
If we respect the pattern, May 2025 might mark the end of the current bull cycle, opening the door to a corrective phase.
Scenario 1 favors a soft correction:
Based on the last cycle (2011-2016), a 5-year bear market might occur.
This would keep the long-term bullish trend alive, especially if macroeconomic conditions stay inflationary or geopolitical risks remain high.
Scenario 2 warns of a harsh bear market:
If history repeats the 1980-2001 phase, gold could enter a multi-decade bear market, driven by reduced inflation fears, strong dollar cycles, or financial system stability.
Key Indicators to watch:
Real interest rates.
USD strength vs global currencies.
Demand from central banks and emerging markets.
Geopolitical tensions and inflation expectations.
Longtermanalysis

XRP Breakout Watch — Are You Positioned for the Move?#XRP is still respecting the 150-day falling wedge structure.
Price is pushing toward the upper resistance with rising momentum.
If the breakout confirms, a strong move could be ahead.
Watching closely for confirmation.
Retweet if you're ready.
#Altseason2025

$ALT Breaks 136-Day Resistance — Big Rally Loading?#ALT has officially broken above the 136-day-long resistance.
Price is now consolidating above the breakout zone, showing strength.
If momentum continues, a major rally could be ahead.
Watching closely for confirmation of the next move.
NASDAQ:ALT BINANCE:ALTUSDT

Why Invest in CONMED Corp (CNMD)?Why Invest in CONMED Corp (CNMD)?
Strong Earnings Growth – CONMED has experienced a remarkable increase in earnings, with EPS surging by 104% year-over-year and net income rising by 105% YoY. This indicates strong financial performance and profitability momentum.
Attractive Valuation – The stock is currently trading at a P/E ratio of 13.79, which is significantly lower than its historical averages. This suggests that CNMD may be undervalued relative to its past performance and industry peers.
Consistent Revenue Growth – The company reported revenue of $1.31 billion for the last year, marking a 5% increase compared to the previous period. This steady growth highlights CNMD’s ability to expand its market presence.
Improving Margins and Efficiency – CONMED has seen an increase in operating income (+66% YoY), operating margin (+58% YoY), and return on assets (+104% YoY), demonstrating better cost management and operational efficiency.
Dividend and Low Payout Ratio – The company pays a dividend of $0.80 per share, yielding approximately 1.35%, with a conservative payout ratio of 18.6%. This allows room for future dividend increases while maintaining financial flexibility.
Healthcare Sector Stability – As a medical technology company specializing in surgical devices, CONMED operates in a defensive sector that tends to be resilient during economic downturns. This provides investors with a level of stability.
Solid Balance Sheet and Liquidity – The company has a current ratio of 2.3, indicating strong short-term liquidity. Additionally, its quick ratio of 0.94 suggests it can cover its immediate liabilities effectively.
Final Thoughts:
CONMED presents a compelling investment case due to its strong earnings growth, attractive valuation, improving profitability, and stable position in the healthcare sector. However, potential investors should always consider market conditions and individual risk tolerance before making investment decisions.

Reasons to Invest in CVS Health (CVS)Reasons to Invest in CVS Health (CVS)
Strong Market Position
CVS Health is a leading healthcare company with a diversified business model, including retail pharmacies, insurance, and healthcare services. Its extensive network provides a competitive advantage.
Attractive Valuation
CVS is currently trading at a P/E ratio of approximately 12.23, which is lower than its historical average of 17.55. This suggests the stock may be undervalued compared to its long-term performance【41】.
Consistent Free Cash Flow (FCF)
The company generates significant free cash flow, which allows it to invest in growth, reduce debt, and return capital to shareholders.
Dividend and Shareholder Returns
CVS has a stable dividend policy with a payout ratio that allows for sustainable growth while reinvesting in the business【40】.
Resilient Business Model
The healthcare industry is defensive, meaning CVS can perform well even in economic downturns. The company benefits from consistent demand for prescriptions and healthcare services.
Future Growth Potential
CVS is expanding its healthcare services through acquisitions and technology-driven solutions. Investments in Medicare, pharmacy benefits, and digital health are expected to drive long-term growth.
Would you like a deeper fundamental comparison between CVS and its competitors?

Bitcoin's 2025 Price Action Mirrors 2017 - Is History Repeating?Bitcoin Halving & The Trump Factor: A Historical Parallel
Bitcoin's price action in 2025 is eerily reminiscent of the post-halving rally of 2017. In both cases, BTC saw a prolonged accumulation phase before a massive markup period. What's even more intriguing is how macro-political events align: Trump was elected in November 2016 , just before BTC went parabolic in 2017, and once again, he's elected in November 2024 , right before Bitcoin enters its explosive post-halving markup phase. Could this be more than just coincidence?
Accumulation Phase Ends – The Markup Begins
From November 9, 2024 , to February 28, 2025 , Bitcoin was in a 107-day accumulation phase . This mirrors previous post-halving cycles, where BTC consolidates in the Green HPR band before entering the next stage. Now, it appears we are entering the Markup Phase, where I expect Bitcoin to rally towards $120K+ in the coming months.
Applying the 2017 Cycle to 2025
The 2017 bull run followed a 59:156:360-day cycle (Accumulation → Markup → Distribution). Using the same ratio and expanding it for 2025, I’ve projected a 107:280:646-day cycle , where:
✅ 107 days Accumulation (Completed!)
📈 280 days Markup (Just Beginning!)
📉 646 days Distribution & Declining (Post-Top Phase)
This fractal projection aligns well with historical price action, reinforcing the likelihood of Bitcoin repeating this structure.
BitBo’s Rainbow Regression Chart Confirms the Setup
Looking at BitBo’s Bitcoin Rainbow Halving Price Regression Chart , BTC briefly dipped into the blue band , just like in 2017’s first wave. However, in both cases, Bitcoin quickly recovered within days and launched into its Markup phase , which is exactly what we’re seeing now!
🔹 Key Takeaway: Bitcoin is following its historic halving cycle patterns, and if history continues to rhyme, the next 280 days could be a wild ride to six-figure BTC prices! 🚀
Don't forget,
Patience is Paramount

NVIDIA The Next long Too Take I cover NVIDIA Range and where I perceive us to gravitate too from the current level . Watch This Before You Buy Nvidia

NZDUSD - LongTerm + MidTerm forecast, Technical AnalysisMonthly TimeFrame:
Weekly TimeFrame:
LongTerm forecast (Monthly Timeframe):
Price is in a Downtrend, But 0.5470 is a Major support.
Considering that this support line has not been broken since 2009, there is a high probability that the price will be rejected and a long-term upward trend will be formed.
But this process will also take years.
MidTerm forecast (Daily Timeframe):
0.57992 is a major resistance, while this level is not broken, the Midterm wave will be downtrend.
We would set buy orders based on Daily-Trading-Opportunities and expect to reach MidTerm targets.
Beginning of entry zone (0.5540)
Ending of entry zone (0.5470)
Take Profits:
0.5664
0.5750
0.5799
0.5863
0.5916
0.6036
0.6118
0.6259
0.6368
__________________________________________________________________
❤️ If you find this helpful and want more FREE forecasts in TradingView,
. . . . . Please show your support back,
. . . . . . . . Hit the 👍 BOOST button,
. . . . . . . . . . . Drop some feedback below in the comment!
🙏 Your Support is appreciated!
Let us know how you see this opportunity and forecast.
Have a successful week,
ForecastCity Support Team

CAD/CHF - Analysis and Forecast for 2025Are you ready to explore one of the most intriguing currency pairs in the forex market? 🌍 In this video, I dive deep into CAD/CHF to uncover the trends, key levels, and potential opportunities that 2025 holds for traders like you! 🕵️♂️💡
🚀 What to Expect:
✅ A detailed analysis of the Canadian Dollar 🇨🇦 vs. Swiss Franc 🇨🇭.
✅ Key drivers shaping the forex market this year, including oil prices 🛢️, monetary policy 📊, and global economic dynamics 🌐.
✅ Entry points, targets 🎯, and risk management tips for smarter trading.
💼 Whether you're a seasoned trader or just starting your journey, this video provides actionable insights to help you make informed decisions. 📊📈
👀 Why CAD/CHF?
The CAD/CHF pair is not just another forex pair—it’s a battleground of two strong economies with unique influences. From Canada’s oil-driven strength 🛢️ to Switzerland’s reputation for stability 🏦, this pair offers volatility and opportunity for those who know how to trade it.
💡 Don't Miss Out!
Watch till the end to see why I entered a buy position and how I plan to capitalize on the upcoming trends. 🎯💰
🌟 Hit the Like Button 👍, Subscribe 🔔, and Join the Discussion in the Comments!
Let’s decode the future of CAD/CHF together! 💬👨💻

CHINA50 // breaking the countertrendAfter a nice wave formed a long trend on the monthly timeframe, the daily and the weekly has come back to print a countertrend.
Now, after 61.8 correction, the daily crossed above the impulse base with waves, so the daily is back (in the minor phase of) the long trend, in sync with the monthly, just breaking the countertrend.
The expansion phase starts above the highest daily breakdown.
———
Stay Patient, Stay Disciplined! 🏄🏼♂️
Your comments, questions, and support are greatly appreciated! 👊🏼
Please check out my video ideas for more explanation.

Long-term Cup & Handle PatternA long-term cup & handle pattern has formed in Nintendo (I have been buying during the "handle" formation). It's not a perfect setup as the top of the "handle" is higher than the high near the end of 2007, although that's in the chart adjusted for dividends. It looks a lot more clear on the chart that's not adjusted for dividends (I will post an update with that). Additionally, the "cup" formation is pretty deep, which likely limits upside from here. Therefore, I think a 50% rise is possible if it can decisively break out above $16 on a monthly closing basis. (This would be a price target in the mid-$20 range; more may be possible, and would be welcomed, but at some point I would have a stop loss in mind and hopefully it would continue to run for a while. I will update this idea if/when that happens.)

Gold Long Term Analysis Dec 1stWe saw another week of volatile movements for Gold. This time, the movement appeared to be influenced by news of Trump's pick for Treasury Secretary and the Ceasefire announced between Israel and Hezbollah. This resulted in a sudden drop in the Gold price at the start of the week before we saw some significant economic news released towards the end of the week.
The announcement of the ceasefire resulted in some some risk-on movement of money as the market viewed this as an easing of tension in at least one geopolitical hotspot. Some sabre rattling from Russia, mean that this was short lived. Whilst the reaction to Trump's nomination of Scott Bessant for Treasury Secretary seemed a little confused given his more muted comments about the use of tariffs and stated desire to reduce the budget deficit. Both of these, on the face of it, would help to ease inflation and make the Fed's job of lowering rates much easier and should have been a support for the Gold price. Towards the end of the week it appears that the market had better parsed the implications of this pick.
On the economic front we had inflation, GDP and labour market numbers broadly come in at expectations along with the FOMC minutes talk of a potential slowing in rate cuts. The probability of a December rate cut increased slightly as yields and the US dollar both dropped.
It is possible that the the observed volatility in Gold prices continues in the short-term leading up to the Fed's interest rate decision in December and the economic implications of Trump's policy statements and cabinet picks continue to be debated.
Looking at the current trend, we have seen periods of sideways movements following an upwards movement in the price and it is likely that we are entering another phase leading up to the innaguration of the president elect. It has been pointed out the the last seven years have seen a rally in Gold prices, but it is unclear whether the conditions are present for an eight. If the Fed chooses to hold off on a rate cut in December, then there's a good chance we won't. I will look at the likely price movement leading into next week in another post.

Gold Long Term Analysis Nov 25The gold price saw a strong rebound last week with the price rising nearly 6%. This saw the gold price respect the upwards trend that has been established over the last year. Uncertainty in the Russia Ukraine conflict provided the main demand for gold last week in the absence of any major economic news as investors looked for a risk hedge.
This movement in gold prices ran counter to increases in the USDX and US treasury yields. The higher yields reflect expectations of better economic conditions leading to a pause (or slowdown) in the pace of monetary policy easing by the Fed and the expected impact of Trump trade policy. With the FOMC minutes, personal consumption and GDP figures coming out later this week we may see some subdued price movement prior to the release of these numbers.
Gold closed last week around a key resistance level that lines up with the 23% fib retracement. We may see gold linger around these levels given recent comments from the Fed reserve over the last week. However a pull back may occur as profits are taken off last week's stellar rise. Hey levels of support are seen around 2693 and 2670.

Bitcoin Fibo and Time- A bit messy graph.
- Some peoples will get it and some not.
- in matter of time and fibo analysis.
- More will BTC take time to go up.
- More BTC price will go higher.
- in simple words, if u compare the 2015 bullrun and 2018 :
- 2015 was 1055 days ( around..)
- 2018 was 820 Days ( excluding the bouble top)
- Nothing much to deduct from that, but 2 scenarios are still possible :
- 100 000$ is not enough (161.8 FIbo), i still persist on that one, so not a scenario imo.
- 150k$ (261.8 Fibo) possible if BTC goes fast. ( same as 2018).
- 200k$ (361.8 fibo ) or 250k$ (423.6 Fibo ) are both possible if BTC goes slow. (same as 2015 )
- i still believe that " more Bitcoin will take time to go up, more the price will go higher "
- Don't forget this is only TA, not FA, not Economic or World Situation.
- Feel free to share with me your view.
Happy Tr4Ding !

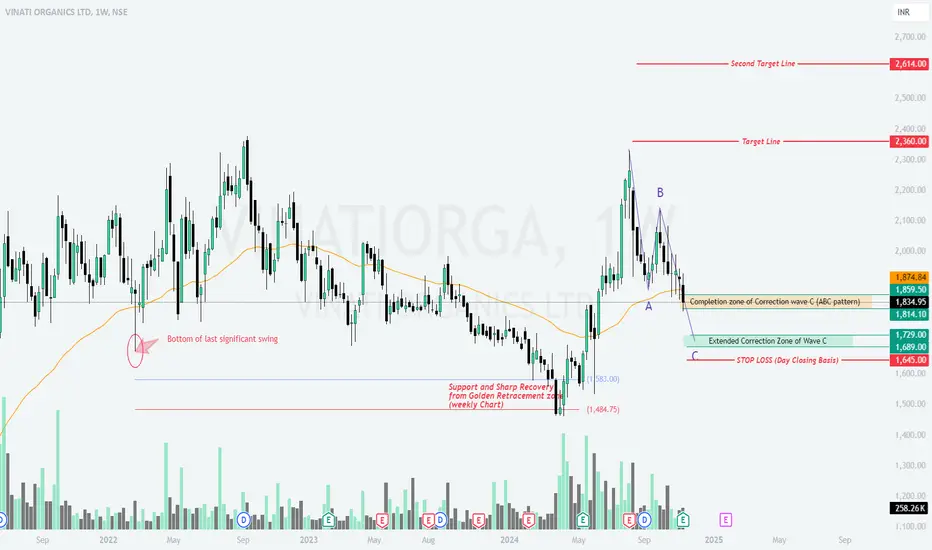
VINATIOR - ABC Correction Near Completion (weekly)Vinati Organics Ltd – Weekly Chart Analysis
1. Current Correction and Support Zone
The price has completed the ABC corrective structure with wave C nearing its completion in the Extended Correction Zone (₹1,729-₹1,689) .
The current price (₹1,834.95) is hovering near the completion zone of wave C , and a sharp recovery is anticipated if support holds.
2. Key Levels and Trading Plan
b Bullish Scenario
Sustained buying from the current levels or the demand zone (₹1,729-₹1,689) could lead to a recovery toward the following target zones:
Target 1: ₹2,360
Target 2: ₹2,614
b Bearish Scenario
A break below ₹1,645 (on a day closing basis) could invalidate the bullish setup, with potential downside to lower levels.
3. Observations and Indicators
Support at Golden Retracement Zone: The stock had shown sharp recoveries in the past from the 61.8% Fibonacci retracement levels, as seen in earlier price movements on the weekly timeframe.
Volume Analysis: A noticeable increase in volume during previous support testing phases indicates buyer interest around key levels.
4. Key Risks
A failure to hold the current correction zone could push the stock toward lower levels. Watch for macroeconomic factors or company-specific news that might impact sentiment.
📈 What’s Your Take on the Setup?
Are we heading toward the targets, or will bears take over? Share your insights in the comments! 🚀📉
GOOGL Strong Move Post-Earnings. My AnalysisHey, guys. Not going to go into too much detail on the description here. Just wanted to get my thoughts out there on NASDAQ:GOOGL . Certainly seems to have a strong long term trend here. As always, in long term trends, there could be various counter trend moves so always be prepared in that regard. Hopefully this offers some more insight for you as you think about NASDAQ:GOOGL from an investment perspective, or even a trading perspective. Even if you are looking for short term trades in GOOGL, I find it helpful to know how your trade might fit in to the longer term trend (whether to the downside or upside).
Hope you enjoy the review, and best of luck out there!

Long term bullmarket scenarioThis idea is a long-term bull market scenario. This idea could start on the day of the FED interest rate decision. The rate decision could lead price action into a bear trap by making traders think we are making a lower low. Well, we do, but this should be considered a bear trap as we have been moving sideways since March and a big event like the FED rate decision could lead to a trend change. Considering the fact that we are making lower lows, it seems like we are constantly liquidating the long positions and the market makers are keeping the short positions alive to sell on a late uptrend.

Bitcoin Returns following the HalvingThis chart provides a visual representation of Bitcoin's price movements in relation to its halving events. Bitcoin halving is a significant event that occurs approximately every four years, where the reward for mining new Bitcoin blocks is halved, effectively reducing the rate at which new Bitcoin is generated. Historically, these halving events have been followed by significant changes in Bitcoin’s price.
Key Points from the Chart:
Historical Performance After Halvings:
The chart tracks Bitcoin's monthly price performance following each halving event. It shows a pattern where September, after a halving year, often marks a critical turning point.
For instance, in past cycles (2013, 2016, and 2020), the months following September have seen significant gains, particularly in October and November.
September as a Pivot Month:
The data suggests that September, following a halving year, tends to be a weaker month, often showing negative or relatively flat returns. However, it is followed by strong positive returns in the following months (October, November, December).
This pattern indicates that September could be the last opportunity to enter the market before a potential significant upward movement.
Average and Median Returns:
The table in the chart highlights average and median returns for October, November, and December after the halving. These months typically exhibit strong performance, with October and November particularly showing robust growth historically.
Market Sentiment Advice:
The message associated with this chart emphasizes a contrarian investment approach: "Buy when there's fear." The logic is that entering the market when sentiment is low (fear is high) can position investors well for the strong returns historically seen in the months following September in a halving year.
Conclusion:
This chart and analysis suggest that if Bitcoin follows its historical patterns post-halving, there could be significant gains in the final quarter of 2024. September might be a period of accumulation for those looking to enter or expand their positions before a potential bull run. The overarching message is to be cautious of buying into hype and to consider entering the market during periods of fear and uncertainty, which could offer the best buying opportunities.

Study of Nifty since it's inception for long term view/Outlook. Nifty has closed at highest monthly closing. It is almost at all time high. Now what the future holds for investors? It is the right time to look at All Time Chart of Nifty. This will help us in taking a long term view of Nifty we decided to look at the all time channel of the same since it's inception in 1991. This research has given three indications. The long term channel is the best way to get predict the Nifty as it filters out all noise. The cut off date we have indicated is January 2028.
This study and analysis has shown an interesting result which indicates that the best case scenario for Nifty by 2028 can be 49K+ levels. (If we continue to grow at the same rate along with the same trendline). In case of stutter the moderate case scenario seems to be that we can reach 30K+ levels.
The worst case scenario as of now seems to be that we remain at similar levels of 23K+. This can happen in case of a major global catastrophe or some internal disruption in India. (Both are worst case scenarios). The reason we might not fall below these levels is that we have a strong rule of law, India as of now is not aligned to any global power and has become leader of the Global south so in case of conflict we might not grow but we by all means will not fall below a certain level.
Since 2005 Nifty has gone below Mid channel support only on two occasions once in sub prime crisis in 2008 and once during Covid 19 outbreak. Even if we fall below Mid channel support we mostly will bounce back very strongly. Thus the indications of all time chart of Nifty seem that India will remains a bull run for a long long time to come.
If we believe the current trend within this decade that is before 2030 Nifty touching or crossing 50K also remains a fair possibility.
So invest in equity, Educate yourself, learn Techno-funda analysis. Reading The Happy Candles Way To Wealth creation my book which is available on Amazon in Paperback and Kindle version can be a good beginning for you. All the best! Happy Investing.

Gold is set to rise - Bullish Momentum Ahead!Welcome to another analysis, where we dive into the latest market trend and chart the potential path ahead for GOLD !
So is gold a good long-term investment? In my view, the short answer is YES .
Gold is likely to continue rising in the coming years due to several fundamental factors. Firstly, ongoing global economic uncertainty, including inflation concerns and geopolitical tensions, often drives investors toward gold as a safe-haven asset. Central banks around the world are also increasing their gold reserves, reflecting confidence in its long-term value.
If we examine the consolidation period between 2016 and 2019, we can see that the breakout from this consolidation initiated Elliott Wave 3.
What's particularly noteworthy is how well the technical indicators have aligned throughout this process.
The Fibonacci extension tool accurately predicted where gold would peak in 2020. After reaching that peak, gold entered a new period of consolidation and sideways movement as we moved into the new years.
Once again, it appears we've entered another phase of Elliott Wave 3 and will probably soon have a minor correction or sideways time period before going into wave 5.
Looking ahead, my long-term projection for gold suggests a potential peak between $3,200 and $3,500, likely around 2026.
Only time will tell!
Thanks for reading, and make sure to follow me here on tradingview and on X for more updates as we progress: @PuppyNakamoto
CAPITALCOM:GOLD TVC:GOLD MCX:GOLD1!

STG Long Term Profits PlanHello traders!
Currently, we are experiencing a big drop in Crypto but other markets have also been dropping hard. So, now instead of going all panic mode let's switch gears and plan ahead to take advantage of the buying opportunities. So, here's my plan in the long term for StarGate.
1) Right now, we can see price hit the Demand Zone which is the zone marked in green. It got pierced though recently after a real long time. However, it's turning into a hammer candle and reversing altogether which means strong buying pressure stepping and it could totally be a fakeout, so we should stay alert to see how it plays out.
Possible confirmations for the demand zone to be safe are: Wait for the price breakout and take a position when it re-test the zone back again.
In the future if the bearish trendline gets broken, we can expect an important rise on the price. We still have to deal with a strong supply zone which is marked in red. If price manages to pierce through the supply then we fly to the moon ♥ meanwhile, I'll be monitoring weekly and informing STG movements over time.
2) TARGETS: The nearest one would be 0.53, which would act as a mean reversion zone. After that, we can expect ranging, and we'll have to wait for signs and clues to find out what could possibly happen next. Targets long term: the supply zone and the ATH +
This idea is to spot for the long term. This asset is still in ranging mode; there hasn't been a breakout of the range yet. However, it's worth noting that there's a triangle pattern playing out in the monthly timeframe, right now.
I hope you find it useful and are able to take advantage of this idea.
Kina Tip of the Day: Take profits partially even when they don't seem much because, in the long run, they will grow in a balanced way with the rest of the portfolio.
Keep it shiny ⭐
Kina, The Girly Trader

USDCHF | Long Term | Buy OpportunityDay : Bearish Trend > marked Day Supply Zone
15m: Likely to grab entire sell-side liquidity soon and shift to a bullish trend, continuing until the daytime frame supply zone mitigation.
Take a long position after strong bullish confirmation in both 15m and 1m charts.
