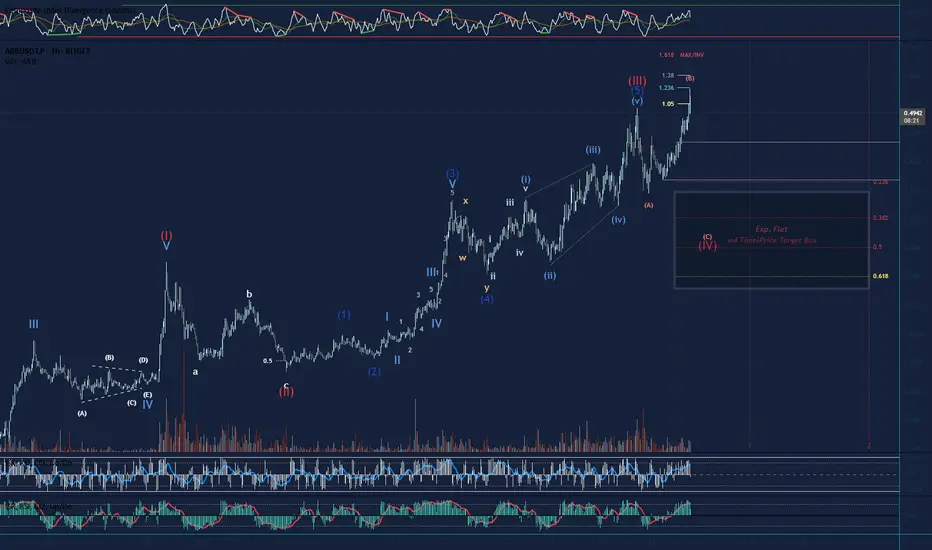
Looking to complete a wave 4 Retracement on Arbitrum Short term outlook is bearish as we are looking to complete an expanding flat to the downside. Wave B neared it invalidation, but reversed down. Lets see if the bears can push it down to the 0.5 Fib Target, soft target is the 0.382 Fib. If volume increases this could be a third up, but we need the wave 4 at the moment, and wave B of the expanding flat is a clear 3 waver so far. Long term we are still bullish with plenty of nested wave 3s to keep us counting to the upside in the future haha. Not Financial Advice
Longtermbullish
Gold’s December Dilemma: Seasonal Rally or Further Decline?OANDA:XAUUSD Multi-Timeframe Analysis
Current Price: 2650.350
Executive Summary:
Gold experienced a significant drop on Monday, November 25, after reaching $2,721, driven by easing geopolitical tensions and strong resistance. The price then fell to $2,605 and has since been consolidating within a bearish flag pattern. Currently, gold is trading at $2,650, showing mixed sentiment with short-term bearish potential and long-term bullish prospects.
Technical Analysis:
Bearish Flag (Short-Term Bearish)
The bearish flag pattern suggests potential downside, signalling a continuation of the recent correction. While it’s possible that the price could rise to the strong pivot resistance at $2,695, which aligns with the upper boundary of the falling wedge, rejection from this level could result in a breakdown from the flag pattern. Alternatively, the price may fail to reach $2,695 and break below the flag.
Key Levels to Watch:
First Target: $2,617 (strong pivot and support).
Next Target: $2,578 (ultimate support).
Gap Fill: If $2,578 breaks, the price could decline to $2,565 (filling the gap from November 18).
Psychological Level: A further drop could test $2,500, which coincides with the lower boundary of the falling wedge and serves as strong structural support.
Falling Wedge: (Long-Term Bullish)
In the long term, the falling wedge pattern suggests a bullish reversal. We expect the price to rebound from support levels near $2,565 or $2,500, resuming its bullish cycle. Gold could potentially rally to new all-time highs (ATH) during December, driven by seasonal demand and technical breakout momentum.
Seasonality:
Gold historically rallies in December, driven by holiday demand, portfolio rebalancing, and year-end events. Significant price increases were observed in December 2022 and 2023, and similar trends could support bullish momentum this year, barring any unexpected bearish developments.
Final Note:
Gold’s short-term sentiment leans bearish, with the bearish flag pointing to potential downside. However, the falling wedge suggests a strong long-term bullish outlook. Watch for key levels like $2,695, $2,617, and $2,500 for potential opportunities. Remember to practice tight risk management.
Happy trading!

What will happen after the NVDA correction? NASDAQ:NVDA
On July 17th, NVDA broke out of a symmetrical triangle formation. Based on this, the current price target is $96.
NDVA recently broke below its 50-day MA, which was then retested and failed to break above. Given the current macro environment and high market fear, I am looking to hold off until the price target is reached before considering re-entry into this name.
Of all the companies, I believe this to be the most resilient to the macro environment due to the ecosystem it has created and the reliance on its hardware and software by other large-cap companies.
To deal with recessionary pressures, companies are going to find ways to cut costs. This will likely be in the form of layoffs. In this environment, to maintain productivity, they are going to rely on NVDA products for further advancement.
NVDA is currently at support around its 100-day MA. If this is broken, there is a gap that needs to be filled which is right near the above-stated price target. Once this area is tested, I will reassess. It is not out of the cards that even this high-flyer retests its 200-day MA in these current conditions, but if that is the case, that will be a massive buying opportunity.
Depending on market open I am currently considering buying OTM puts for $95 target. If that goes as planned I will close that position and sell cash secured puts at the level of the 200 day MA. If it gets close to the 200 day MA I will likely hammer call options.

NEXT MRF - HONEYWELL AUTO ( HONAUT ) Multiple study like flag and trend line from upper price that share price is running on 38800
CHART PATTERNS HOLD
1. Trend line on monthly
2. Multiple cup & handle
3. Ready to cross us supply zone
4 Range breakout
2 Slide flag pattern brekaout
BUY honey well auto above 39000
TRG 1 - 44000
TRG 2 - 48000
TRG 3- 52000
and above 52000 that convert in jackpot trade if that not split
TRG 64000 --- 72000 ----- 88000 if everything will be going in good that share

RBLX - Updated analysis for expected pullbacks and trade entriesThis is what we should see going forward if we want to continue with a healthy move up to retest orange tapered selling and beyond.
Happy Trading :)
- TraderDaddyOG

HTF Bullflag, LTF H&SHowdy - Quick idea here for potential short term and long term setups.
We are in a weekly uptrend and recently saw our first signs of weakness by a double top and neckline retest. The next moves will decide whether we continue our bullish performance or continue to see struggle from buyers at this level.
Bullish Bias: On the weekly, we broke out of a strong bull trend line and approached our swing low. We had a strong bounce (indicating strong support and additional liquidity). We are seeing a potential bull-flag and approaching the top of that down-trend line. Even if we don't break out on this attempt, this is still a longer-term possibility. If we break out of resistance line with force, we can see price continue up to retest the 2.000 psychological level.
Bearish Bias: On the MTF (2HR), if we reject the upper trend line, we can see a drop toward 1.7500 liquidity or at minimum a neckline retest. This is where we might see our H&S play out to propel us toward that demand zone.

BTC Potential H&S PlayAs BTC was recently rejected from the 200 day SMA (~$28,000) as well as the 0.5 Fib level (of rally June 16-23), the potential for Head & Shoulders pattern is coming into play.
SPY
is also testing lower trendline of it's rising wedge ("recession news" likely coming) and could capitulate, leading to further pressure on BTC.
Just some Wine Wednesday speculation, but I wouldn't be surprised if we see another sharp leg down before the end of the year.
Long term bull, but "Uptober" might be a bulltrap.

USD/CAD Top Down Analysis - Short term and Long Term SetupsHappy Sunday and Labor Day Weekend for those celebrating! However, the FourX market never goes on holiday.
Updated outlook and analysis on USD/CAD - we have some very interesting confluence at important levels to determine the controlling trend.
We are currently in a daily pullback (uptrend) within a HTF downtrend with signs of either:
1. Reversal from LTF Pullback back toward HTF downtrend
2. HTF Bullflag to break us out of downtrend and created higher high
In both these scenarios, I believe we have a short term move down first. We are at the tops of trend lines and strong resistance levels and this would be the point from where we begin to drop.
All the resistance points above us lead me to believe that we need more liquidity and momentum from demand levels below. It’s too big a fight as it is now.
Confluence:
- 70.70% retracement level & 1.400 psychological level resistance
- HTF Double Top at this level (April 2023)
- 61.8% golden retracement level resistance – 1.367 level
- LTF Double top at this level (Aug 2023)
- Support turned resistance on breakout below trend line support (2HR Chart)
- Resistance at top of weekly downtrend channel
- CHoCH supply zone mitigated (this is our short trade entry zone)
- Large demand zones and untapped liquidity below
Now, while I do expect a drop toward these demand zones for buyers to regain liquidity and try to reverse us out of this downtrend, we are still well within our HTF uptrend pullback, meaning this could be a smaller pullback within a HTF uptrend and potential break of new highs. Therefore, this liquidity pull and subsequent drop will be mainly to sustain our future attempts at new highs. And this reversal to the upside can happen again at any point – especially as we’ve created a strong level of support at the 50% fib retracement from weekly time frame swing H’s and L’s. That 1.336 level would be our trade Take Profit 1
LTF/Short Term Trade setup:
Stop Loss: Above 61.8 Fib level – 1.367 or Fib 70.7 level – 1.39
Take Profit1 : 50% HTF Fib level and demand zone/POI - 1.336 = 4.7 R:R
Take Profit 2: HTF Demand zone and stronger POI – 1.300 Psychological level = 8.75 R:R or 2 R:R (for higher stop loss)
If we take profit, and see support growing at either of these levels, we will consider our bullish trade entry and as buyers attempt to fulfill the HTF bull flag that’s very much in play
Update to last week's USD/CAD Trades
My initial setups (linked below) that I posted last week were shorter term setups that we took as objective points. Meaning, where price has the likelihood to go to first in order to get to its main/larger objective. Objective points are areas where buyers or sellers might want to grab liquidity from on the lower time frames in order to fulfill its higher time frame main objective.
In this case, my objective points were fulfilled on:
Trade #1:Linked below “USD/CAD Quick Scalp 2.5 R:R” where we utilized the move toward the supply zone knowing we wanted to mitigate this zone created by a minor CHoCH – so this zone acted as an objective point for a larger move I called out:
Trade #2: Linked below “USD/CAD LTF Trade Setup” which was to short from the supply zone to the next Break of structure (Which we hit) – this larger move was also an objective point for an even larger HTF trade:
Trade #3: Linked below “USD/CAD Short Trade with a 4.93 R:R” which is bringing us towards our higher time frame demand zone / 50% retracement. Trade still active.
Please see related links and videos to get a better understanding and continue hitting these TP's!!
- FourXTrader

BTC Local Bearish MoveLocal bearish move due to failed retest to gain support and Bollinger Bands bearish breakout.

BTC Perfect retest of the rising wadge and down we go!I said yesterday in my post that we my go down to retest the bottom of the channel on the weekly timeframe which is going to be 33k.
Now i just opened small short position on BTC because of the retest of the rising wadge on the 4 hourly timeframe. My profit taking area is around 34k.
Dont be manipulited by this small pumps and trade smart.
Dont get me wrong i am bullish on the weekly and i think that 33k is the bottom but we need to retest the bottom again.
Much love to all traders.
What do you think about my opinion?
If you like my ideas please follow me and like the post, i am new to Treadingview but i have 6 years expirience in trading.
BTC TO THE MOON!

BTC: Double top / M pattern + Longterm curve lineHello,
When looking at the BTC charts I can see this as a longterm outcome.. This means my ultimate bottom lies around 19k-20k.
I hope we will not reach that, I would much more appreciate it if the maximum bottom would be around 25-30k for a quick reversal, however looking at how the curve is going all these years.. how we are now under it and how other lines + the M pattern lines up.. I will trade accordingly and Dollar Cost Average (DCA) all the way to this level.
My strategy is the "percentage wallet" strategy, meaning my amount of stablecoins (which I split up in gold, dollar and euro) vs my amount of crypto (which I split up in btc, eth and altcoins) differs every week. At the moment my cryptowallet is around 36%, it was 27% at 43k when we dropped and it has been 44% at the 35k bottom. I sold alot past week though, bringing it to 36%.
I am preparing multiple buys until 20k, around 10% around the 28-31k level (as many other traders), I skip the 25k-27k zone and I start another 10-15% buy at the 20-23k region. This would be a big buy because I expect a good bounce from this level. If we bounce from there, I will probably resell some of the bought crypto at 20k. Probably around 30-35k. This way I can keep compensating earlier buys and I can aim for an ultimate bottom.
In the end, as you can see in the chart, my goal for BTC is still ATH in the coming 1 or 2 years. I don't think markets are ready to slide into crisis yet.. That would be "too simple". However IF we really go into another bullish cycle, I am prepared to sell 70% of my total cryptowallet.. probably bringing my stablecoin wallet to 80 or 90 %. I think that the next bullish cycle could be the last for now, before we reach some bearmarket.
By the way, google M pattern... If we are looking at a "bearish 5-0 pattern" then we are in for a good bottom around 10-20k.

XAUUSD buy 1788 - 1792 TP 1821Gold on higher timeframe is making a bullish run. Expect to buy on pullback. Ride trend until 1870++.

XAUUSD IdeaGold overall looks to be a buy, but i believe before that there will be possible sell forecasts to look into in which would drop to around 1794.5 (within that region). In my opinion from there it is a strong buy to firstly 1817 then to 1845/1855 level which you could take profit.

Ethereum Classic $600 soon?It appears Ethereum Classic is almost breaking out the bull pennant. The $65 was the peak before the sell off. Based on the fib ETC can squeeze to ath $600 soon.

BTC, ETH: Trading a falling channel (updated).BTC and ETH trading bearish at the lower edge of a falling mid-term channel (which I have called in my ideas since Sep-03), after decisive bearish moves on reasonable volume . We are continuing Since Sep-22 for at least yet another swing up/down.
Trading setup*:
- in a falling mid term channel since Sep-07 from 52.9k
- two decisive moves to the downside confirmed the channel on Sep-07 (52.9k -> 42.2k) and on Sep-21 (48.8k -> 39.7k) and defined size and angle of the channel
- variant A has been invalidated on Sep-22
- trading long in B up to 45k from Sep-21 (has been successful) in the first step
- in B, the higher value has been confirmed, hence trading from B down to 36.3k by shorting
- planning to get there around Oct-04
--> all in all, this includes a long with ~8% profit and a short with ~20% profit. I will do this on 5x margin, and for fun I'll trade it in ETHUSD (for it has more volatility), even though this plan is about BTCUSD.
- up to now price decline rejected at a major rising long term trend line 2 times (but on low + declining volume) --> watch this closely in the daily chart, breakout above local bearish pennant on reasonable volume could still invalidate trading setup
Intermediate review
- entry missed, hence lost some additional %% in the beginning
- TP1 at B (45k) anticipated perfectly in time and price using my new technique (described in my idea "TA: Trying to find the perfect entry point for a short.") --> exited first long on a good profit
- strong movements between Sep-24 and Sep-26 not anticipated, hence lost some trading opportunities - but "stick to your plan" as a matter of risk management
- On Sep-2029 in a short from 45k, which is at 6% profit now (inbetween has been 10%), multiplied by 5 through leverage
- trading setup essentially on plan up to now, going further
*) I have been documenting my trades in this channel since Sep-21 in my idea "BTC, ETH: Trading a falling channel". On Sep-22 I had to update the channel setup. My setup and decisions have become less visible in the old idea because the chart in it still pictures the old variant. That's why I moved it to this update here.
_____
Of course, this is not a trading advice, just my private analysis as well as a text for entertainment purposes.
Never put your heart and your money in the same place.
You could end up with your balance getting f***** while you're doing the hard work.

WANCHAIN IS READY, LONG.Wanchain is ready to bounce for the long term goal: $10. Look at this beauty. I love this chart.
Wanchain bridges keep getting better, you can now bridge AVAX.
$MOVR farming pair added.
An article about the L2L2 direct bridges of Wanchain has been published
Zookeeper, NFT crafting(two identical NFTs can now be crafted into one NFT with better boost rates) and minting NFTs(new NFT market)
Not financial advice.
-Emrys

BTC, ETH: Trading a falling channel.BTC and ETH trade at the lower edge of a falling mid-term channel (which I have called in my ideas since Sep-03), after decisive bearish moves on reasonable volume. I think we will continue for at least yet another swing up/down.
I will trade this (on ETH for higher volatility) between the two fib lines of the last large uptrend, where I will look for exit / entry points. For BTCUSD it's the .236 , lining up with the .786 (B: .382 - .5) short term fib retrace level of todays down swing. For ETHUSD its the .382 fib level of the last longer uptrend.
Tomorrow I will see if we're at variant A or B, depending on the power of the anticipated retrace / correction.
Not the perfect entry now, but I need to go to bed ;-)
_____
Of course, this is not a trading advice, just my private analysis as well as a text for entertainment purposes.
Never put your heart and your money in the same place.
You could end up with your balance getting f***** while you're doing the hard work.

BTCUSD: Next move down to 41.200.The recent BTCUSD movements have proven my perspective from Sep-03 right. We're heading down and a new trend channel to lower regions is about to open. Price retraced from the top of the last mid term rising trend, down to the 0.382 fib level. It retested the 0.236 fib level in a fresh swing to the upside. Now it looks as if it would get rejected there. This confirms the current mid-term downtrend.
Where now?
The next level we could be heading to is the 0.5 fib level of the last mid-term upswing at around 41.200, if we should poke through it we would see 38.5k as well. Large retracements like this would be little surprising, we had this before.
If not, we could still see prices confirm the new falling channel with another 51k retest. I think that this is less likely.
If price would hit 50k and rise above, my strategy would prove wrong.
What do you think?
_____
Of course, this is not a trading advice, just my private analysis as well as a text for entertainment purposes.
Never put your heart and your money in the same place.
You could end up with your balance getting f***** while you're doing the hard work.

Bears are back in town ...Guys, have you seen this live? :-)
In my last chart idea I already looked sceptically at the volumes of the last "range breakout" - they were only a third of the least of range breakouts in the last year. That didn't look like the way to the new top to me.
Today, Tue 2021-09-07, a heavy pullback hit BTCUSD and virtually all major cryptocurrencies. It started after the price almost touched 53k at 03:22 UTC , ending in a major bloodrush after 14:30 UTC , with BTCUSD (kraken) finally touching down as low as 42k. About 20% down within two hours . It kinda looked like a long squeeze. At the time of writing prices seem to stabilize around 47k . Now, this is where we have been one month before.
This still could be just a healthy correction on the way to Scenario B and the next ATH , guys ... ;-)
Would you buy that?
It could as well be the case we're just back in Scenario A of the Idea I published four days ago. And this would mean that the market has no trust in a further way up yet after hitting the 63k in spring . That we need to get back to lower levels , yes, as deep as the 20s range. There we will fill our pockets, before we get back and make money and hit the 100k.
Share your thoughts!

BTCUSD correcting lower in the coming weeks.I stay with my view on the mid term development of BTCUSD price move.
Missing upwards pressure and a breakout that failed due to low volume one week before were followed by a massive downside correction. This move set BTC back into an new falling channel which will lead prices down to the base path of the long term fib channel which has been valid since at least 2014.
We will see falling prices until Q1-2022. Depending on the decidedness of this downside correction we will find good buying opportunities in the lower 30k or even uper 20k region by end Q1, beginning Q2 2022.
_____
Of course, this is not a trading advice, just my private analysis as well as a text for entertainment purposes.
Never put your love and your money in the same place.
You could end up with your balance getting f***** while you're doing the hard work.

Short term bearish view on BTCUSD: Fib channels.For me, a likely scenario could be BTC dropping until Q2-2022, then long-term building up for next ATH.
Why?
Using long term fib channels we see that sell territory has always begun above the 0.5 line. When this had been reached, a correction to the channel below 0.236 followed suit - time for buyers. After BTCUSD has been in the channel above 0.618 it didn't drop there yet. That's where it may go next (scenario A).
Why not moving further up, into scenario B?
BTCUSD had never made a correction through more than 2 channels during a bullish phase. Now it already went through 4 of them. There are no new psychological or fundamental reasons why this time should be different (like the corona drop was in 03-2020). This makes scenario B rather unlikely for me.
This is not a trading advice, just my private analysis.

BTC/USD SHORT / LONG after BINANCE:BTCUSDT
SHORT TERM
We can see rising wedge on btc usdt ... Thats should be short-termed trend reversal . I think price can go down to 20.000 in short term ...
Iam selling 30% CRYPTO now and if BTC falls more than 10.000USD i will sell another 30%...
LONG TERM
If my SHORT TERM thinking will be right ... it will be possible to form very BIG pennant wedge and falling trend reverse back to bullish & my first bullish targets in this scenario will be 80.000USD-100.000USD ---> maybe in December ...
When I am looking to BTC for LONG term i think it will be BULLISH for next years ...

BTC Wyckoff Distribution. Are we sure the pattern is complete?Short-Med term bearish, long term bullish ( i believe this cycle still has to finish correcting before we can start accumulating foe the next one).
Just my own opinion but I'm seeing that everyone is all bullish because we've just had a pump, & people are now thinking we're in the Wyckof Accumulation phase.. Are we forgetting that the Wyckoff Distribution has 2 big tests on either side & all look rather symmetrical? The one earlier was not big enough to be that, & the leg down not long enough. You couldn't call that one a "Fakeout test", it was just a re-test. Wyckoff Distributions commonly have a last big Fakeout to exhaust more retail supply & induce one more big shorting opportunity before coming down to consolidation & accumulation phase. Are we forgetting too that sub 50% is a cycle correction? Most parabolic pumps correct 60-80% before accumulation, both in micro & macro. 2017 ATH corrected 81% before finally ending correction late 2018. This has happened alot quicker, & there is more institutional money this time so i wouldn't expect an identical correction but we have to expect that an end of cycle is generally more than 55%. So i feel that this isnt done yet, this is a test, & the Wyckoff pattern & head & shoulders still has to compete before the next cycle can begin.
Another thing i would add is ive been following the chart with a Fib Spiral since just early January, just after the retest down after the first big test. The same pattern that forms waves, clouds etc. By the time we got to Wave no 3 i noticed the wave peaks were plateauing out, in line with the shape of the spiral. I had a big feeling Wave no4, 64k was the peak but i didn't trust my own judgement cos im still learning. But by the time we got to Wave no5 i realised that the bigger wave, the whole cycle, was about to break. So i cashed everything to stables & ultimately avoided a whole lot of pain. So given the whole cycle seems to be shaped by the spiral, the fact that the first big test up, on the upside, & the recent big test up on the downside, are almost identically opposite each other at around the same price level, rings major alarm bells for me. They look far too symmetrical to me to be a mere coincidence, & remember symmetry is such a common thread in chart patterns, head & shoulders/double bottoms/double tops ect. So i think there's a high chance we haven't finished our correction from ATH yet. there's too much adoption & fundamentals now for it to be a full 80% correction like 2017, but i think 65% is highly likely.
We also have to take into account the fact the announcement just after NY trading hours finished, on monday, the same day of the biggest buying volumes in months, that Tether is being taken to court by the DOJ over fraud, something they will have a harder time defending than Ripple over the SEC. So its highly likely that the sudden trading volume was Tether insiders & Bitfinex hurredly offloading Tether for BTC in advance o the announcement. Given how much Wyckoff activity is all market insiders i find the coincidence between the pump & the announcement on the same day very suspicious. So again, another reason to believe that this "Breakout" is a fakeout & not a trend.
Tread carefully.. But of course the much bigger picture, across cycles is still up.. 2017 ATH corrected 81% & then the next ATH was 13-14x that. So if we repeat the pattern then the next ATH is about 260k. But i dnt believe that will happen for another year. And the sooner we finish correcting, the sooner we can start accumulating, & the cheaper the buying will be.. Tread carefully, don't FOMO in, wait a little to see what happens. I'm certain this correction isn't finished yet..
Take care & look after yourselves :)
