DONEAR AT SUPPORT ZONE.This is the Weekly chart of DONEAR.
Donear is currently trading near its support zone in the ₹95–₹100 range.
The stock is trading within a larger pattern structure (broadening pattern) and is currently moving inside a smaller formation—an ascending channel (in DAILY timeframe) support at 103-105 range.
if this level is sustain ,then we may see higher price on ascending channel resistance at 130-135 range and long term resistance of the broadening pattern .........
Thank you !!!!
Longtermsupportlevel
DRREDDY.... BULLISH. - Healthcare and Pharma SectorNSE:DRREDDY
This stock is fundamentally at ALL TIME HIGH but its PE at the lower band......
stock taking support of the major trendline (RED)
if it breaks 4615 level in WEEKLY TIMEFRAME with strong volume, then it can show a massive rally.
this is all for educational purpose, not a stock recommendation for trading.
invest at your own risk.
Is the selloff over?We wouldn’t blame you if you mistook the lumber price chart with a cryptocurrency. Down more than 70% from its peak in May 2021, lumber’s had astonishing volatility over the past few years.
On a longer-term chart, the 460 handle represents a very long-term support/resistance level. With current Lumber prices just shy of this major support level of 460, could we see a breakout higher? Previous 2 attempts to break this level were rejected sharply and a huge rally ensued.
Additionally, current RSI readings indicate oversold levels which have been useful in picking the past few bottoms.
Overall, we think that lumber could be primed for a move up as it edges closer to the major long-term support level.
Entry at 475, stops at 435. Target at 630.
The charts above were generated using CME’s Real-Time data available on TradingView. Inspirante Trading Solutions is subscribed to both TradingView Premium and CME Real-time Market Data which allows us to identify trading set-ups in real-time and express our market opinions. If you have futures in your trading portfolio, you can check out on CME Group data plans available that suit your trading needs www.tradingview.com
Disclaimer:
The contents in this Idea are intended for information purpose only and do not constitute investment recommendation or advice. Nor are they used to promote any specific products or services. They serve as an integral part of a case study to demonstrate fundamental concepts in risk management under given market scenarios.
BTC to $7800 in 3 days?
If we retain our current descending channel then that answer is yes! The good news is that if it does maintain course, there is absolute hard support at $7800. We should be a little cautious and observant if we bounce off of $8200/$8300 support as it could lead us to a nasty head and shoulders that could break the 5+ year ascending trendline in the not too distant future if so. I feel like this is fairly improbable as I believe strongly in crypto maintaining the current long-term bull trend line.
Once we broke the ascending channel we came back up and confirmed it as resistance, this was a strong bear signal. I really thought BTC was going to run a wider, slower descending channel as it had started just as it was breaking out of the previous ascending channel. This sell off has really been epic and with force that could help it penetrate the long-term ascending trend line but if we do, I feel it will quickly recover to the trend line.
As I have been mentioning since probably Oct last year, look at any touch of this 5 year trendline as a huge buy opportunity, possibly the last time its this cheap every time it touches that line because that’s what it has represented for the last 5 almost 6 years. It is important to recognize the significance of this trend line, if we break it and convert it to resistance. If we ever turn this long term ascending trendline into resistance, I will be heavy short on crypto as the correction would likely be really drastic. I do not see any reason to believe we would break this trend line in any meaningful way.
Another observation I have made is that the global order books have been fairly stable. Of the major exchanges which we track, the global market liquidity was at about $1Billion (Not including derivatives) for crypto with BTC representing about 10% of that market depth with 100M in order books. At the beginning of this crash, the global order books fell down around $750M USD and they have been holding up around $750M and BTC sitting at around $80M. One thing a little concerning is that if you chart the books, it looks like we have established resistance at just under $790M. The books definitely maintain trends as well, in fact, the global books signaled a break in the trend before price did (Feb 15th) and often signal bottoms and tops as they tend to recover before price. Come play with market depth with 6 different depths of market, TV charts, special depth metrics and more @ vcdepth.io
I am crypto long and 2020 feels like its going to be a good year. This is not investment advice, I am merely sharing my research. I recommend you do your own research, always.
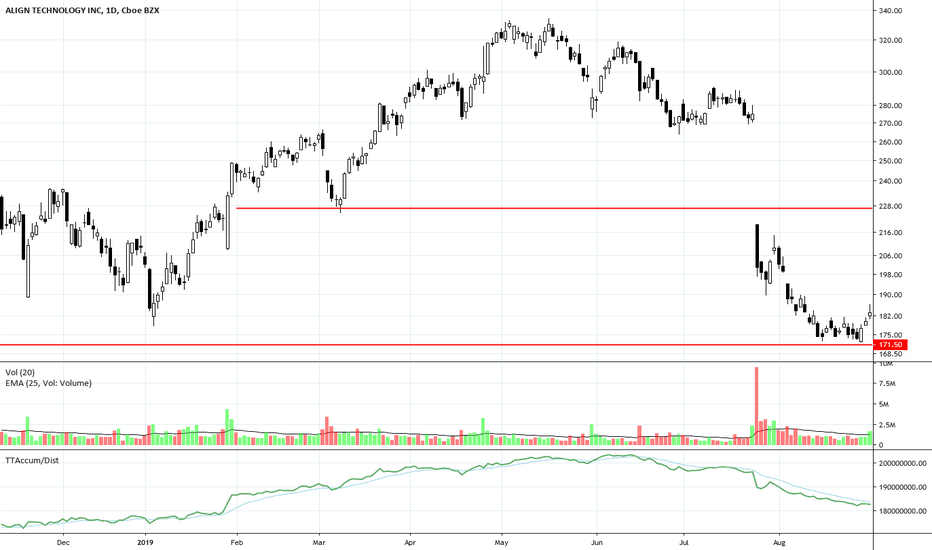
ALGN at Long-Term Support LevelALGN gapped down at the end of July on weak earnings news. It has now collapsed to a strong long-term support level. The final capitulation by Smaller Funds managers has ended. The consistency of the candlestick pattern with closely aligned lows and an early Shift of Sentiment™ pattern on the Balance of Power Indicator reveals some Dark Pool Quiet Rotation™ at this level.


