MANTA/USDT Buy LevelsBINANCE:MANTAUSDT
This idea has a long-term profit goal.
All goals are indicated on the chart.
- Risk 0.5% on deposit
- All levels for purchase in % for the long term are indicated on the chart
P.S (This is not an investment recommendation, this is my personal opinion.f)
Longtrade

Wait for today's Gold price trend with PMI news⭐️ Smart investment, Strong finance
⭐️ GOLDEN INFORMATION:
During Tuesday's trading session, the price of Gold (XAU/USD) reached $2,030, indicating a gain of 0.43%. This comes after a notable 2% loss last week, as the bears take a pause. The daily chart suggests a neutral-to-bearish sentiment, while the four-hour indicators show a slight inclination towards the upside, hinting at a potential shift in momentum.
From a fundamental standpoint, strong economic data in the United States and hawkish sentiments from the Federal Reserve (Fed) have resulted in significant selling of metals. This has raised doubts about the possibility of a future rate-cutting cycle by the Fed. As a result, the upside potential for gold is limited, as rising US yields, which are often considered the cost of holding non-yielding metals, are causing concerns.
⭐️ Personal comments NOVA:
Accumulated price, sideway disputes price range $2030-$2020. Today's PMI news may determine the Gold price trend this week, breaking out of the above zone
⭐️ SET UP GOLD PRICE:
🔥BUY GOLD zone: $2002 - $2005 SL $1995
TP1: $2012
TP2: $2016
TP3: $2020
Pay attention to the BUY2019 and SELL2038 break zones, which can be used for scalping in the Asian and EUR sessions.
🔥SELL GOLD zone: $2053 - $2055 SL $2062
TP1: $2048
TP2: $2040
TP3: $2030
⭐️ Technical analysis:
Based on technical indicators EMA 34, EMA89 and support resistance areas to set up a reasonable BUY order.
⭐️ NOTE:
Note: Nova wishes traders to manage their capital well
- take the number of lots that match your capital
- Takeprofit equal to 4-6% of capital account
- Stoplose equal to 2-3% of capital account
- The winner is the one who sticks with the market the longest

PEOPLE/USDT BINANCE:PEOPLEUSDT
This idea has a medium-term profit target.
All targets are indicated on the graph.
- Risk 0.5% on deposit
- R/R 1/2
P.S (This is not an investment recommendation, this is my personal opinion.

UNIONBANK go long ifit crosses 116
enter @ 116.10
stop loss: 112.70 (if stop loss is hit then loss is 11.5% so take entry if you are capable to take the loss of 11.5%)
target: 141.70 ( if worked then the profit will be 22% with risk from buying level is 11.50%)
NOT SEBI registered , so do your own analysis to take the entry , this is my analysis according to which i may trade.

RITES go long ifit crosses 525.70
entry @ 525.75
stop loss: 470.95 (10.42% risk involved)
target: 635.10 (20.80% reward with a risk of 10.42%)
buy this stock only one can handle risk of 10.42%
this is my stock idea and i am entering in it with 10.42% risk, if one cannot handle 10.42% risk please do not enter into it.
I am no SEBI registered individual , please do your own analysis before entering into it.

USD/ JPY !! continue to increase the price trendline⭐️ Smart investment, Strong finance
⭐️ USD/ JPY INFORMATION:
During the Asian session on Thursday, the Japanese Yen (JPY) has gained ground against the American counterpart, breaking a three-day losing streak. It had previously reached its lowest level since November 28. The JPY's relative safe-haven status is being supported by a generally weaker risk tone and the subdued price action of the US Dollar (USD). However, the upside potential is limited due to expectations that the Bank of Japan (BoJ) will maintain its ultra-dovish stance in response to factors such as a recent earthquake in Japan, declining inflation rates in Tokyo, and weaker wage growth.
⭐️ Personal comments NOVA:
The upward price trendline is still very nice, testrend to then have more BUY power
⭐️ SET UP USD/JPY PRICE:
🔥BUY zone:147.750 - 147.600 SL 147.100
TP1: 148.100
TP2: 148.400
TP3: 148.700
⭐️ Technical analysis:
Based on technical indicators EMA 34, EMA89 and support resistance areas to set up a reasonable BUY order.
⭐️ NOTE:
Note: Nova wishes traders to manage their capital well
- take the number of lots that match your capital
- Takeprofit equal to 4-6% of capital account
- Stoplose equal to 2-3% of capital account
- The winner is the one who sticks with the market the longest

Will a short-term recovery take place?⭐️ Smart investment, Strong finance
⭐️ GOLDEN INFORMATION:
During the early trading hours in Asia on Thursday, the price of gold (XAU/USD) has fallen to the $2,000 level. This decline in the value of the precious metal is driven by strong economic data in the United States, which has diminished expectations of an immediate interest rate cut. Currently, at the time of writing, the price of gold is trading at $2,007, representing a 0.07% increase for the day.
In the meantime, the US Dollar Index (DXY), which measures the value of the US dollar against its major trading partners, has surged to a new high for 2024, reaching approximately 103.70. Across the yield curve, US Treasury yields are rising, with the 10-year yield standing at 4.10%.
⭐️ Personal comments NOVA:
Continuously good economic data for the US economy, the dollar recovered. Gold price decreased around 2000. Expect a slight recovery today
⭐️ SET UP GOLD PRICE:
🔥BUY GOLD zone: $1995 - $1993 SL $1985
TP1: $2002
TP2: $2010
TP3: $2022
🔥SELL GOLD zone: $2024 - $2026 SL $2030 Scalping
TP1: $2020
TP2: $2015
TP3: $2010
🔥SELL GOLD zone: $2033 - $2035 SL $2043
TP1: $2025
TP2: $2017
TP3: $2010
⭐️ Technical analysis:
Based on technical indicators EMA 34, EMA89 and support resistance areas to set up a reasonable BUY order.
⭐️ NOTE:
Note: Nova wishes traders to manage their capital well
- take the number of lots that match your capital
- Takeprofit equal to 4-6% of capital account
- Stoplose equal to 2-3% of capital account
- The winner is the one who sticks with the market the longest

Rising Star in Insurance: Kingstone Companies, Inc.Kingstone Companies, Inc. (NASDAQ: KINS), an insurance company offering policies to small and mid-sized businesses and individuals, has experienced a notable increase in its stock price over the past year. The company's stock has soared by 27% in the last three months and climbed 55% in the last year. Despite this surge, it's important to consider various aspects of the company's performance and market position before making investment decisions.
Kingstone Companies operates in a competitive insurance industry and faces competition from several companies. However, it has managed to maintain a competitive position in the market. The company's profitability rank is moderate, with ROE, ROA, and ROIC figures suggesting profitability lower than the industry average. Nonetheless, the company has remained profitable for 7 out of the past 10 years.
The company's growth rank also indicates a moderate growth rate, with a mixed record in terms of revenue and earnings per share growth over the past few years. This suggests that while the company has potential, its growth has been inconsistent.
Kingstone Companies recently transitioned from making a loss to reporting a profit, which is a positive sign. However, the modest dividend yield might not be a significant factor in supporting the stock price. When evaluating the company's potential for investment, it is crucial to look beyond just the recent surge in stock price and consider the overall financial health and future prospects of the company.
In conclusion, while Kingstone Companies Inc. has shown promising stock price performance recently, investors should carefully assess the company's financials, market position, and growth prospects before adding it to their portfolio. The recent increase in stock price could be an indicator of potential, but a thorough analysis of the company's overall performance and market dynamics is essential for making informed investment decisions.

Gold's growth momentum continues⭐️ Smart investment, Strong finance
⭐️ GOLDEN INFORMATION:
The price of gold (XAU/USD) is experiencing slight increases above the $2,050 level in the early Asian session on Tuesday. The rising tensions in the Red Sea and the prevailing risk-off sentiment favor the demand for safe-haven assets like gold. Currently, the gold price is being traded at $2,055, registering a 0.06% gain for the day.
In the meantime, the US Dollar Index (DXY), which measures the value of the USD against a basket of currencies used by US trading partners, continues to consolidate near 102.60 since the beginning of the year. The yields on Treasury bonds are decreasing, with the 10-year yield currently at 3.95%.
⭐️ Personal comments NOVA:
Today's FOMC meeting will partly determine the Gold trend for the week, along with news of military tensions that will have a positive impact on Gold and precious metals.
⭐️ SET UP GOLD PRICE:
🔥BUY GOLD zone: $2040 - $2042 SL $2034
TP1: $2050
TP2: $2058
TP3: $2067
🔥SELL GOLD zone: $2067 - $2069 SL $2075
TP1: $2060
TP2: $2050
TP3: $2040
⭐️ Technical analysis:
Based on technical indicators EMA 34, EMA89 and support resistance areas to set up a reasonable BUY order.
⭐️ NOTE:
Note: Nova wishes traders to manage their capital well
- take the number of lots that match your capital
- Takeprofit equal to 4-6% of capital account
- Stoplose equal to 2-3% of capital account
- The winner is the one who sticks with the market the longest

BSE still has potential upside?After a fantastic run in a short period, BSE has been consolidating between the range of 2200-2300. In the last trading session's close, the price has taken support at the crucial level of 78.6% retracement. A high above today's close with volume support can take the stock back to its previous high of 2582
Entry - 2320
Stop Loss - 2210
Target - 2580

GOLDEN UP trend prevails !! Monday⭐️ Smart investment, Strong finance
⭐️ GOLDEN INFORMATION:
The price of gold (XAU/USD) is trading without much movement during the early Asian session on Monday. However, the increase in the value of the precious metal is being supported by the weaker US Producer Price Index (PPI) data and escalating tensions in the Middle East. Currently, the gold price stands at $2,045, experiencing a minimal decrease of 0.01% for the day.
On Friday, the US Producer Price Index (PPI) for December saw a yearly increase of 1.0%, compared to the revised 0.8% growth in November. This figure fell below market expectations of 1.3%. The annual core PPI, which excludes volatile food and energy prices, rose by 1.8% in December, down from the previous reading of 2.0% and lower than the market consensus of 1.9%. The monthly core PPI remained unchanged for the third consecutive month.
⭐️ Personal comments NOVA:
After PPI data decreased compared to expectations last week, along with the tense military situation in the Middle East, Gold prices continued to have a positive start in the Asian session on Monday.
⭐️ SET UP GOLD PRICE:
🔥BUY GOLD zone: $2031 - $2033 SL $2023
TP1: $2045
TP2: $2055
TP3: $2063
🔥SELL GOLD zone: $2063 - $2065 SL $2070
TP1: $2055
TP2: $2048
TP3: $2033
⭐️ Technical analysis:
Based on technical indicators EMA 34, EMA89 and support resistance areas to set up a reasonable BUY order.
⭐️ NOTE:
Note: Nova wishes traders to manage their capital well
- take the number of lots that match your capital
- Takeprofit equal to 4-6% of capital account
- Stoplose equal to 2-3% of capital account
- The winner is the one who sticks with the market the longest

RUNEUSDTHello dear friends
Considering the maintenance of the $4.35 support area, we expect price growth.
On the chart for us LL is not formed.
With the consumption of the orange range ($5.9547), we get a confirmation for the uptrend.
What do you think?

opportunity to go long or short in AVAXUSDTguys there is an opportunity to go long or short if the price breaks and closes below or above the support line and can aim the recent swing low or high and i have also used fib to predict where to set the take profit for both long a short position, for long position you can set your TP at the above arrow and for short position you can set your TP at the down arrow

by using my past knowledge the can do thisi think that the market will do this that the market will form lower lows into support and the support will break and then it will retest back the support

Gold price in the context of tense war✍️ NOVA hello everyone, Let's comment on gold price next week from 15/1 - 19/1/2024
🔥 World situation:
Traders purchased Gold as a result of the intensification of the conflict in the Middle East. Additionally, the rise in demand for the precious metal was driven by the decrease in yields of US Treasury bonds. This was fueled by expectations that the US Federal Reserve would implement substantial interest rate cuts, potentially as early as March.
🔥 Identify:
In the context of increasing US military tensions with the Middle East, creating a great premise for Gold prices to increase sharply despite economic data. That is an important factor to believe that Gold prices will continue to increase next week
🔥 Technically:
Based on the resistance and support areas of the gold price according to the H4 frame, NOVA identifies the important key areas as follows:
New Resistance: $2074, $2140
Support : $2015, $1990
🔥 NOTE:
Note: Nova wishes traders to manage their capital well
- take the number of lots that match your capital
- Takeprofit equal to 4-6% of capital account
- Stoplose equal to 2-3% of capital account
- The winner is the one who sticks with the market the longest

NEAR/USDT TRADE SETUP! #NEAR:
Entry Point:
Buy at CMP: Consider entering the trade at the Current Market Price (CMP), taking advantage of the current market conditions.
Additional Entry: Be prepared to add more positions if the price drops to $3.34. This level is identified as a potential strategic buying opportunity.
Target Prices:
Set specific target prices at $3.52, $3.6, $3.78, $4.01, and $4.2. These levels represent potential profit-taking points as the price moves upward.
Stop Loss (SL):
Set a stop-loss at $3.236. This level is chosen to limit potential losses and effectively manage risk.
Leverage:
The recommendation advises maintaining low leverage and entering the market at the lowest possible price. It suggests a gradual entry approach and encourages traders to avoid sudden decisions. Using leverage cautiously is crucial to minimize risk.
Cautionary Note:
Reminds traders to do their own research (DYOR) before making any trading decisions. This reinforces the importance of conducting personal research for informed decision-making.
Includes "NFA" (No Financial Advice), emphasizing that the provided information is not a recommendation for financial decisions.
In summary, the recommendation outlines a trading strategy for #NEAR, providing specific entry points, target prices, and a stop-loss level for risk management. It emphasizes caution with leverage, gradual entry, and the necessity of conducting personal research. As always, the information is not financial advice.

Strategic Long Trade: Unlocking Potential Profits in #SEI #SEI long trade setup:
Entry Point:
Buy at CMP: Consider entering the trade at the Current Market Price (CMP), taking advantage of the current market conditions.
Additional Entry: Add more positions up to $0.661. This level is identified as a potential strategic buying opportunity.
Target Prices:
Set specific target prices at $0.78, $0.85, $0.92, $1.01, and $1.2. These levels represent potential profit-taking points as the price moves upward.
Stop Loss (SL):
Set a stop-loss at $0.66. This level is considered mandatory to effectively manage potential losses. A stop-loss is a risk management tool that automatically sells the asset if the price reaches a specified level, limiting potential downside.
Leverage:
The recommendation suggests utilizing leverage based on individual risk appetite. It emphasizes the importance of exercising caution and choosing leverage wisely. Leverage amplifies both potential profits and potential losses, so it should be used with care.
Cautionary Note:
Emphasizes the importance of doing your own research (DYOR) before making any trading decisions. This reinforces the idea that the provided information is not financial advice.
In summary, the recommendation outlines a long trade setup for #SEI, providing specific entry points, target prices, and a stop-loss level for risk management. It also advises caution with leverage and underscores the significance of conducting personal research. As always, the information is not financial advice.

Scalping!! XAU BUY short term before CPI news⭐️ Smart investment, Strong finance
⭐️ GOLDEN INFORMATION:
The US Dollar bulls are facing uncertainty regarding the rate-cut path of the Federal Reserve. This uncertainty is providing support to the Comex Gold price, which is gaining some positive momentum due to repositioning trades before the release of the US consumer inflation figures.
Following the December policy meeting, where the Fed unexpectedly adopted a dovish stance, the markets reacted swiftly. As a result, they are now factoring in five interest rate cuts by the end of 2024. These rate cuts would amount to a total easing of approximately 140 basis points (bps).
⭐️ Personal comments NOVA:
Scalping following the short-term Uptrend after CPI news
⭐️ SET UP GOLD PRICE:
🔥BUY GOLD zone: $2027 - $2029 SL $2024 Scalping
TP1: $2033
TP2: $2037
TP3: $2040
⭐️ Technical analysis:
Based on technical indicators EMA 34, EMA89 and support resistance areas to set up a reasonable BUY order.
⭐️ NOTE:
Note: Nova wishes traders to manage their capital well
- take the number of lots that match your capital
- Takeprofit equal to 4-6% of capital account
- Stoplose equal to 2-3% of capital account
- The winner is the one who sticks with the market the longest

NAKA Looking Good 📈Looks like it's broken out of its sideways channel, possible wave 4 for the next leg up ⬆️

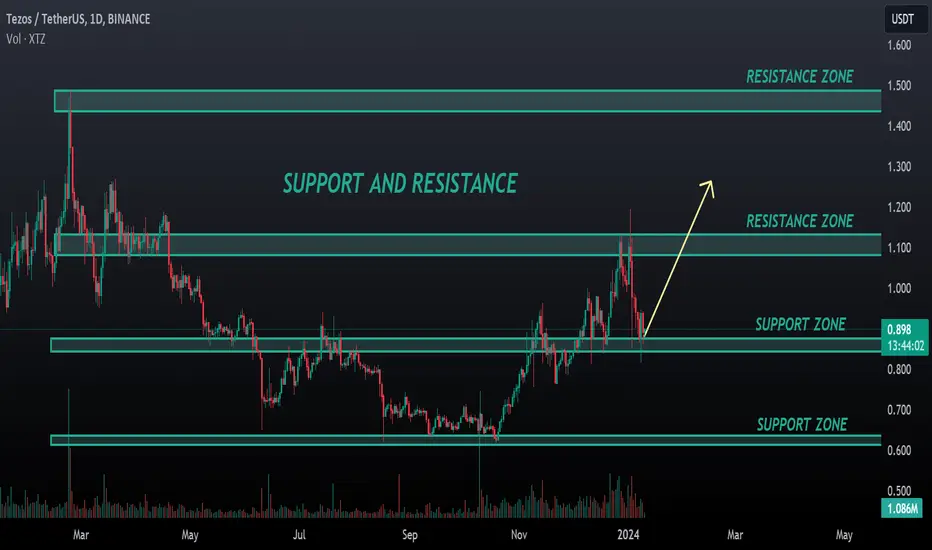
XTZ ANALYSIS🔮 #XTZ Analysis - Support and Resistance 🚀🚀
💲💲 #XTZ is trading above its supply zone and we have seen rejection from its resistance zone before. But if #XTZ closes above the supply zone and sustain the higher price, it will indicate a good bullish move 📈
🔖 Current Price: $0.899
⏳️ Target Price: $1.130
⁉️ What to do?
- We have marked crucial levels in the chart . We can trade according to the chart and make some profits. 🚀💸
🏷Remember, the crypto market is dynamic in nature and changes rapidly, so always use stop loss and take proper knowledge before investments.
#XTZ #Cryptocurrency #Support #Resistance #DYOR
NAS100 Bullish Scenario: The Only Long I See (Daily/1 Hour)Fundamentally, 2023 was a strong year for stocks notably tech, which has created a strong bullish anticipation for 2024. We are in the midst of a CPI release coming this Thursday on the 11th. It is obviously the most important data release of the year (since we're 9 days in lol). More seriously it is the factor that WILL determine the move to come (no shit). By default I am bullish for speculative and technical reasons so I propose a rational entry for a long position assuming the show will go on. Here is the technical reasoning:
1. Price wicked perfectly on the DAILY 'bullish' 0.618 fib level during the Friday 5th session. This serves as our first bullish signal.
2. Throughout the session an intermediary range was created with a high that will serve as our BOS ('break of structure') line.
3. Throughout that same session and the following session (Monday 6th) price bounced twice, precisely, on its fib 'reload zone' which is the area that ranges between 0.618 and 0.782 (0.702 is extremely effective). These zones tend to render good entries if it's line with the general outlook (fundamentals + daily/weekly trend + general analysis). This serves as our second bullish signal.
4. With our BOS (third bullish signal), an FVG ('fair value gap') was formed. I couldn't explain why it works but with back testing and live testing, it changed the game for me. This FVG serves as another entry point. Why this FVG and not the ones above? We want the one with the highest probability of success so we pair it with the 'reload zone'!
5. By tracing a trend-based fib, which honestly I just learnt how to use today, you'll notice how price reacted perfectly to the 1.702 fib. This is just a way to increase the legitimacy of my analysis and to seem like I know things. But it is a high that we'll use for our potential profit taking (spoiler!).
6. The trade: we have a confluence of factors which giveth the highest success probability (in my opinion) for an entry point (EP) IF we are backed by a strong data release. So EP:16430, MAX SL:16240 / MIN SL: 16330 (based on the low of the FVG) and TP1: 16675 (the high/fib 1.702) / TP2: 17000 (a nice round number which is a good target since it represents a strong psychological bias for all traders). This gives a good RR 1:3 so in the midst of the CPI release which could basically f*** everything up, I wouldn't risk more than 1%. For trade management put the SL in BE when price has taken TP1.
Note: if the CPI is very bullish, just leave approx. 20% of the position to flow to new highs (TP3).
NFA and happy trading! :)

"ACE/USDT Long Trade: Breaking Wedge, Retest, and Upside Potenti"ACE/USDT Long Trade Alert 🚀
ACE breaks falling wedge, now retesting.
Entry: Current Market Price (CMP), add more up to 9.0081.
Targets: Aiming for 60-80% gains.
Stop Loss: If any 2-hour candle closes back inside the wedge.
Leverage: 5x to 10x.
R:R (Risk-Reward Ratio): 1:6 (Lucrative).
Use leverage wisely, DYOR.
Not financial advice.

EURJPY H4 / TRADE ANALYSIS, LONG OPPORTUNITY 📈 Hello Traders!
This is my idea related to EURJPY H4. I expect a retracement until the resistance level at the price of 154.000 and after that a Bullish move until the price of 158.400.
Traders, if you liked my idea or if you have a different vision related to this trade, write in the comments. I will be glad to see your perspective.
____________________________________
Follow, like, and comment to see my content:
www.tradingview.com
